- java.lang.Object
-
- com.softwarefx.chartfx.server.Attributes3D
-
public final class Attributes3D
extends java.lang.Object
Provides access to the Attributes3D object.
The Attributes3D object supported members allow developers to add 3D views and perspective to charts. By enabling 3D in charts, developers may further customize the display by manipulating
setAngleXandsetAngleYangles,setDepth,setPerspective,isRotatedandsetShadow. Additionally, members likeisClusterallow you to add a Z dimension to charts.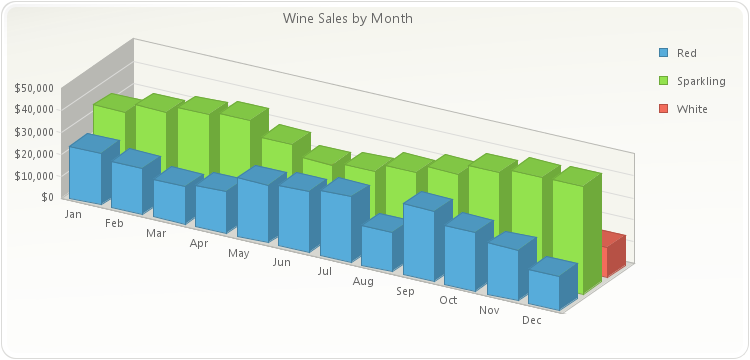
chart1.getView3D().setEnabled(true);
chart1.getView3D().setAngleX(45);
chart1.getView3D().setCluster(true);
PopulateProductSales(chart1);
chart1.getTitles().add(new TitleDockable("Wine Sales by Month"));
chart1.getAxisY().getLabelsFormat().setFormat(AxisFormat.CURRENCY);
chart1.setGallery(Gallery.BAR);
public static void PopulateProductSales(Chart chart1) { ProductSales[] data = new ProductSales[]{ new ProductSales("Jan", 12560, 23400, 34500), new ProductSales("Feb", 13400, 21000, 38900), new ProductSales("Mar", 16700, 17000, 42100), new ProductSales("Apr", 12000, 19020, 43800), new ProductSales("May", 15800, 26500, 37540), new ProductSales("Jun", 9800, 27800, 32580), new ProductSales("Jul", 17800, 29820, 34000), new ProductSales("Aug", 19800, 17800, 38000), new ProductSales("Sep", 23200, 32000, 41300), new ProductSales("Oct", 16700, 26500, 46590), new ProductSales("Nov", 11800, 23000, 48700), new ProductSales("Dec", 13400, 15400, 49100) }; ObjectProvider objProvider = new ObjectProvider(data); chart1.getDataSourceSettings().setDataSource(objProvider); }public static class ProductSales { public ProductSales(String month, double white, double red, double sparkling) { this.setMonth(month); this.setWhite(white); this.setRed(red); this.setSparkling(sparkling); } private String privateMonth; public final String getMonth() { return privateMonth; } public final void setMonth(String value) { privateMonth = value; } private double privateWhite; public final double getWhite() { return privateWhite; } public final void setWhite(double value) { privateWhite = value; } private double privateRed; public final double getRed() { return privateRed; } public final void setRed(double value) { privateRed = value; } private double privateSparkling; public final double getSparkling() { return privateSparkling; } public final void setSparkling(double value) { privateSparkling = value; } }
-
-
Constructor Summary
Constructors Constructor and Description Attributes3D()
-
Method Summary
Methods Modifier and Type Method and Description intgetAngleX()Gets or sets the 3D rotation angle around the X-axis.intgetAngleY()Gets or sets a 3D rotation angle around the Y-axis.intgetBoxThickness()Gets or sets the thickness for the box surrounding the chart.intgetDepth()Gets or sets the thickness along the Z-axis for the series.intgetPerspective()Allows you to set a 3D perspective to control the view of the chart depth.ShadowgetShadow()Gets or sets a value indicating the type of shading to display when the chart is displayed in 3D.booleanisCluster()Displays a z-clustered 3D chart.booleanisEnabled()Gets or sets a value indicating whether 3D effects should be applied.booleanisRotated()Gets or sets a value indicating the chart is Rotated.voidresetAngleX()Set the property AngleX to its default value.voidresetAngleY()Set the property AngleY to its default value.voidresetBoxThickness()Set the property BoxThickness to its default value.voidresetCluster()Set the property Cluster to its default value.voidresetDepth()Set the property Depth to its default value.voidresetEnabled()Set the property Enabled to its default value.voidresetPerspective()Set the property Perspective to its default value.voidresetRotated()Set the property Rotated to its default value.voidresetShadow()Set the property Shadow to its default value.voidsetAngleX(int value)Gets or sets the 3D rotation angle around the X-axis.voidsetAngleY(int value)Gets or sets a 3D rotation angle around the Y-axis.voidsetBoxThickness(int value)Gets or sets the thickness for the box surrounding the chart.voidsetCluster(boolean value)Displays a z-clustered 3D chart.voidsetDepth(int value)Gets or sets the thickness along the Z-axis for the series.voidsetEnabled(boolean value)Gets or sets a value indicating whether 3D effects should be applied.voidsetPerspective(int value)Allows you to set a 3D perspective to control the view of the chart depth.voidsetRotated(boolean value)Gets or sets a value indicating the chart is Rotated.voidsetShadow(Shadow value)Gets or sets a value indicating the type of shading to display when the chart is displayed in 3D.
-
-
-
Method Detail
-
getAngleX
public int getAngleX()
Gets or sets the 3D rotation angle around the X-axis.
The value can be set to an integer between [0-90] or [270-360] indicating the degree of rotation around the X-axis.
Negative values or values greater than 360 are automatically reduced to a value in the range of 0 to 359.
This method can only be used when the chart is in 3D view. So, be sure the
isEnabledmethod is set to true.To avoid jagged lines we recommend you use prominent angles (for example: 0,30,45,60,90, etc).
To set a Y-axis rotation angle, please refer to the
setAngleYmethod.To set an X-axis angle of 60 degrees:
chart1.getView3D().setAngleX(60);
- See Also:
resetAngleX
-
setAngleX
public void setAngleX(int value)
Gets or sets the 3D rotation angle around the X-axis.
The value can be set to an integer between [0-90] or [270-360] indicating the degree of rotation around the X-axis.
Negative values or values greater than 360 are automatically reduced to a value in the range of 0 to 359.
This method can only be used when the chart is in 3D view. So, be sure the
isEnabledmethod is set to true.To avoid jagged lines we recommend you use prominent angles (for example: 0,30,45,60,90, etc).
To set a Y-axis rotation angle, please refer to the
setAngleYmethod.To set an X-axis angle of 60 degrees:
chart1.getView3D().setAngleX(60);
- Parameters:
value-- See Also:
resetAngleX
-
getAngleY
public int getAngleY()
Gets or sets a 3D rotation angle around the Y-axis.
The value can be set to an integer between [0-90] or [270-360] indicating the degree of rotation around the Y-axis.
Negative values or values greater than 360 are automatically reduced to a value in the range of 0 to 359.
This method can only be used when the chart is in 3D view. So, be sure the
isEnabledmethod is set to True.To avoid jagged lines we recommend you use prominent angles (for example: 0,30,45,60,90, etc).
To set an X-axis rotation angle, please refer to the
setAngleXmethod.To set an Y-axis angle of 60 degrees:
chart1.getView3D().setAngleY(60);
- See Also:
resetAngleY
-
setAngleY
public void setAngleY(int value)
Gets or sets a 3D rotation angle around the Y-axis.
The value can be set to an integer between [0-90] or [270-360] indicating the degree of rotation around the Y-axis.
Negative values or values greater than 360 are automatically reduced to a value in the range of 0 to 359.
This method can only be used when the chart is in 3D view. So, be sure the
isEnabledmethod is set to True.To avoid jagged lines we recommend you use prominent angles (for example: 0,30,45,60,90, etc).
To set an X-axis rotation angle, please refer to the
setAngleXmethod.To set an Y-axis angle of 60 degrees:
chart1.getView3D().setAngleY(60);
- Parameters:
value-- See Also:
resetAngleY
-
getBoxThickness
public int getBoxThickness()
Gets or sets the thickness for the box surrounding the chart.
Below is a chart with a BoxThickness of 10.
PopulateProductSales(chart1);
chart1.getTitles().add(new TitleDockable("Wine Sales by Type"));
chart1.getAxisY().getLabelsFormat().setFormat(AxisFormat.CURRENCY);
chart1.setGallery(Gallery.BAR);
chart1.getView3D().setCluster(true);
chart1.getView3D().setBoxThickness(10);
public static void PopulateProductSales(Chart chart1) { ProductSales[] data = new ProductSales[]{ new ProductSales("Jan", 12560, 23400, 34500), new ProductSales("Feb", 13400, 21000, 38900), new ProductSales("Mar", 16700, 17000, 42100), new ProductSales("Apr", 12000, 19020, 43800), new ProductSales("May", 15800, 26500, 37540), new ProductSales("Jun", 9800, 27800, 32580), new ProductSales("Jul", 17800, 29820, 34000), new ProductSales("Aug", 19800, 17800, 38000), new ProductSales("Sep", 23200, 32000, 41300), new ProductSales("Oct", 16700, 26500, 46590), new ProductSales("Nov", 11800, 23000, 48700), new ProductSales("Dec", 13400, 15400, 49100) }; ObjectProvider objProvider = new ObjectProvider(data); chart1.getDataSourceSettings().setDataSource(objProvider); }public static class ProductSales { public ProductSales(String month, double white, double red, double sparkling) { this.setMonth(month); this.setWhite(white); this.setRed(red); this.setSparkling(sparkling); } private String privateMonth; public final String getMonth() { return privateMonth; } public final void setMonth(String value) { privateMonth = value; } private double privateWhite; public final double getWhite() { return privateWhite; } public final void setWhite(double value) { privateWhite = value; } private double privateRed; public final double getRed() { return privateRed; } public final void setRed(double value) { privateRed = value; } private double privateSparkling; public final double getSparkling() { return privateSparkling; } public final void setSparkling(double value) { privateSparkling = value; } }
- See Also:
resetBoxThickness
-
setBoxThickness
public void setBoxThickness(int value)
Gets or sets the thickness for the box surrounding the chart.
Below is a chart with a BoxThickness of 10.
PopulateProductSales(chart1);
chart1.getTitles().add(new TitleDockable("Wine Sales by Type"));
chart1.getAxisY().getLabelsFormat().setFormat(AxisFormat.CURRENCY);
chart1.setGallery(Gallery.BAR);
chart1.getView3D().setCluster(true);
chart1.getView3D().setBoxThickness(10);
public static void PopulateProductSales(Chart chart1) { ProductSales[] data = new ProductSales[]{ new ProductSales("Jan", 12560, 23400, 34500), new ProductSales("Feb", 13400, 21000, 38900), new ProductSales("Mar", 16700, 17000, 42100), new ProductSales("Apr", 12000, 19020, 43800), new ProductSales("May", 15800, 26500, 37540), new ProductSales("Jun", 9800, 27800, 32580), new ProductSales("Jul", 17800, 29820, 34000), new ProductSales("Aug", 19800, 17800, 38000), new ProductSales("Sep", 23200, 32000, 41300), new ProductSales("Oct", 16700, 26500, 46590), new ProductSales("Nov", 11800, 23000, 48700), new ProductSales("Dec", 13400, 15400, 49100) }; ObjectProvider objProvider = new ObjectProvider(data); chart1.getDataSourceSettings().setDataSource(objProvider); }public static class ProductSales { public ProductSales(String month, double white, double red, double sparkling) { this.setMonth(month); this.setWhite(white); this.setRed(red); this.setSparkling(sparkling); } private String privateMonth; public final String getMonth() { return privateMonth; } public final void setMonth(String value) { privateMonth = value; } private double privateWhite; public final double getWhite() { return privateWhite; } public final void setWhite(double value) { privateWhite = value; } private double privateRed; public final double getRed() { return privateRed; } public final void setRed(double value) { privateRed = value; } private double privateSparkling; public final double getSparkling() { return privateSparkling; } public final void setSparkling(double value) { privateSparkling = value; } }
- Parameters:
value-- See Also:
resetBoxThickness
-
isCluster
public boolean isCluster()
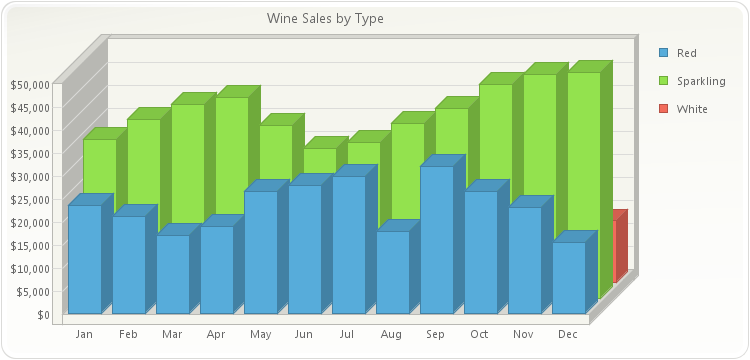
Displays a z-clustered 3D chart. When set to true, the chart will show as clustered; when set to false, the chart displays the series side-by-side.
When setting this method, you must make sure that the chart is displayed in 3D mode (by setting the
isEnabledmethod to true) and that the chart is cluster capable (BAR, LINES or GANTT chart).When displaying a clustered chart, each series will have its own position in the Z axis. This means, if this method is set to true, then each data series will occupy one row of data along the Z-axis
AREA charts are always clustered as there is no way to paint different series side by side. On the other hand, if you have a BAR chart, it is possible to paint bars side-by-side and not clustered in the z-axis.
Below is an example of a non-clustered bar chart vs. a clustered bar chart.
Non-Clustered:
PopulateProductSales(chart1);
chart1.getTitles().add(new TitleDockable("Wine Sales by Type"));
chart1.getAxisY().getLabelsFormat().setFormat(AxisFormat.CURRENCY);
chart1.setGallery(Gallery.BAR);
chart1.getView3D().setEnabled(true);
public static void PopulateProductSales(Chart chart1) { ProductSales[] data = new ProductSales[]{ new ProductSales("Jan", 12560, 23400, 34500), new ProductSales("Feb", 13400, 21000, 38900), new ProductSales("Mar", 16700, 17000, 42100), new ProductSales("Apr", 12000, 19020, 43800), new ProductSales("May", 15800, 26500, 37540), new ProductSales("Jun", 9800, 27800, 32580), new ProductSales("Jul", 17800, 29820, 34000), new ProductSales("Aug", 19800, 17800, 38000), new ProductSales("Sep", 23200, 32000, 41300), new ProductSales("Oct", 16700, 26500, 46590), new ProductSales("Nov", 11800, 23000, 48700), new ProductSales("Dec", 13400, 15400, 49100) }; ObjectProvider objProvider = new ObjectProvider(data); chart1.getDataSourceSettings().setDataSource(objProvider); }public static class ProductSales { public ProductSales(String month, double white, double red, double sparkling) { this.setMonth(month); this.setWhite(white); this.setRed(red); this.setSparkling(sparkling); } private String privateMonth; public final String getMonth() { return privateMonth; } public final void setMonth(String value) { privateMonth = value; } private double privateWhite; public final double getWhite() { return privateWhite; } public final void setWhite(double value) { privateWhite = value; } private double privateRed; public final double getRed() { return privateRed; } public final void setRed(double value) { privateRed = value; } private double privateSparkling; public final double getSparkling() { return privateSparkling; } public final void setSparkling(double value) { privateSparkling = value; } }
Clustered:
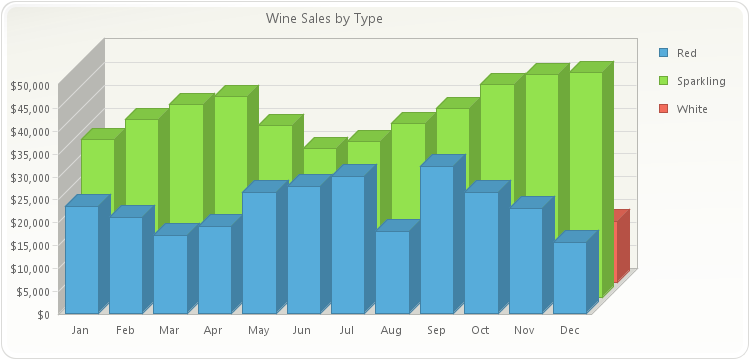
PopulateProductSales(chart1);
chart1.getTitles().add(new TitleDockable("Wine Sales by Type"));
chart1.getAxisY().getLabelsFormat().setFormat(AxisFormat.CURRENCY);
chart1.setGallery(Gallery.BAR);
chart1.getView3D().setCluster(true);
public static void PopulateProductSales(Chart chart1) { ProductSales[] data = new ProductSales[]{ new ProductSales("Jan", 12560, 23400, 34500), new ProductSales("Feb", 13400, 21000, 38900), new ProductSales("Mar", 16700, 17000, 42100), new ProductSales("Apr", 12000, 19020, 43800), new ProductSales("May", 15800, 26500, 37540), new ProductSales("Jun", 9800, 27800, 32580), new ProductSales("Jul", 17800, 29820, 34000), new ProductSales("Aug", 19800, 17800, 38000), new ProductSales("Sep", 23200, 32000, 41300), new ProductSales("Oct", 16700, 26500, 46590), new ProductSales("Nov", 11800, 23000, 48700), new ProductSales("Dec", 13400, 15400, 49100) }; ObjectProvider objProvider = new ObjectProvider(data); chart1.getDataSourceSettings().setDataSource(objProvider); }public static class ProductSales { public ProductSales(String month, double white, double red, double sparkling) { this.setMonth(month); this.setWhite(white); this.setRed(red); this.setSparkling(sparkling); } private String privateMonth; public final String getMonth() { return privateMonth; } public final void setMonth(String value) { privateMonth = value; } private double privateWhite; public final double getWhite() { return privateWhite; } public final void setWhite(double value) { privateWhite = value; } private double privateRed; public final double getRed() { return privateRed; } public final void setRed(double value) { privateRed = value; } private double privateSparkling; public final double getSparkling() { return privateSparkling; } public final void setSparkling(double value) { privateSparkling = value; } }
- See Also:
resetCluster
-
setCluster
public void setCluster(boolean value)
Displays a z-clustered 3D chart. When set to true, the chart will show as clustered; when set to false, the chart displays the series side-by-side.
When setting this method, you must make sure that the chart is displayed in 3D mode (by setting the
isEnabledmethod to true) and that the chart is cluster capable (BAR, LINES or GANTT chart).When displaying a clustered chart, each series will have its own position in the Z axis. This means, if this method is set to true, then each data series will occupy one row of data along the Z-axis
AREA charts are always clustered as there is no way to paint different series side by side. On the other hand, if you have a BAR chart, it is possible to paint bars side-by-side and not clustered in the z-axis.
Below is an example of a non-clustered bar chart vs. a clustered bar chart.
Non-Clustered:
PopulateProductSales(chart1);
chart1.getTitles().add(new TitleDockable("Wine Sales by Type"));
chart1.getAxisY().getLabelsFormat().setFormat(AxisFormat.CURRENCY);
chart1.setGallery(Gallery.BAR);
chart1.getView3D().setEnabled(true);
public static void PopulateProductSales(Chart chart1) { ProductSales[] data = new ProductSales[]{ new ProductSales("Jan", 12560, 23400, 34500), new ProductSales("Feb", 13400, 21000, 38900), new ProductSales("Mar", 16700, 17000, 42100), new ProductSales("Apr", 12000, 19020, 43800), new ProductSales("May", 15800, 26500, 37540), new ProductSales("Jun", 9800, 27800, 32580), new ProductSales("Jul", 17800, 29820, 34000), new ProductSales("Aug", 19800, 17800, 38000), new ProductSales("Sep", 23200, 32000, 41300), new ProductSales("Oct", 16700, 26500, 46590), new ProductSales("Nov", 11800, 23000, 48700), new ProductSales("Dec", 13400, 15400, 49100) }; ObjectProvider objProvider = new ObjectProvider(data); chart1.getDataSourceSettings().setDataSource(objProvider); }public static class ProductSales { public ProductSales(String month, double white, double red, double sparkling) { this.setMonth(month); this.setWhite(white); this.setRed(red); this.setSparkling(sparkling); } private String privateMonth; public final String getMonth() { return privateMonth; } public final void setMonth(String value) { privateMonth = value; } private double privateWhite; public final double getWhite() { return privateWhite; } public final void setWhite(double value) { privateWhite = value; } private double privateRed; public final double getRed() { return privateRed; } public final void setRed(double value) { privateRed = value; } private double privateSparkling; public final double getSparkling() { return privateSparkling; } public final void setSparkling(double value) { privateSparkling = value; } }
Clustered:
PopulateProductSales(chart1);
chart1.getTitles().add(new TitleDockable("Wine Sales by Type"));
chart1.getAxisY().getLabelsFormat().setFormat(AxisFormat.CURRENCY);
chart1.setGallery(Gallery.BAR);
chart1.getView3D().setCluster(true);
public static void PopulateProductSales(Chart chart1) { ProductSales[] data = new ProductSales[]{ new ProductSales("Jan", 12560, 23400, 34500), new ProductSales("Feb", 13400, 21000, 38900), new ProductSales("Mar", 16700, 17000, 42100), new ProductSales("Apr", 12000, 19020, 43800), new ProductSales("May", 15800, 26500, 37540), new ProductSales("Jun", 9800, 27800, 32580), new ProductSales("Jul", 17800, 29820, 34000), new ProductSales("Aug", 19800, 17800, 38000), new ProductSales("Sep", 23200, 32000, 41300), new ProductSales("Oct", 16700, 26500, 46590), new ProductSales("Nov", 11800, 23000, 48700), new ProductSales("Dec", 13400, 15400, 49100) }; ObjectProvider objProvider = new ObjectProvider(data); chart1.getDataSourceSettings().setDataSource(objProvider); }public static class ProductSales { public ProductSales(String month, double white, double red, double sparkling) { this.setMonth(month); this.setWhite(white); this.setRed(red); this.setSparkling(sparkling); } private String privateMonth; public final String getMonth() { return privateMonth; } public final void setMonth(String value) { privateMonth = value; } private double privateWhite; public final double getWhite() { return privateWhite; } public final void setWhite(double value) { privateWhite = value; } private double privateRed; public final double getRed() { return privateRed; } public final void setRed(double value) { privateRed = value; } private double privateSparkling; public final double getSparkling() { return privateSparkling; } public final void setSparkling(double value) { privateSparkling = value; } }
- Parameters:
value-- See Also:
resetCluster
-
getDepth
public int getDepth()
Gets or sets the thickness along the Z-axis for the series.
Below are two examples demonstrating the differences when using a Depth of 0 and a Depth of 150.
Depth value of 0:
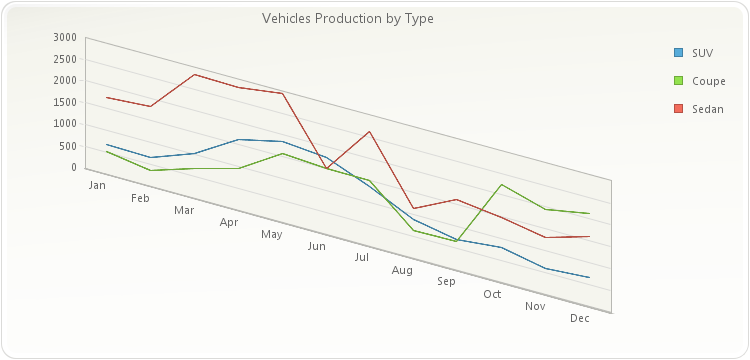
PopulateCarProduction(chart1);
chart1.getTitles().add(new TitleDockable("Vehicles Production by Type"));
chart1.getView3D().setEnabled(true);
chart1.getView3D().setAngleX(45);
chart1.getView3D().setDepth(0);
public static void PopulateCarProduction(Chart chart1) { CarProduction[] production = new CarProduction[] { new CarProduction("Jan", 1760, 535, 695 ) , new CarProduction("Feb", 1849, 395, 688 ) , new CarProduction("Mar", 2831, 685, 1047 ) , new CarProduction("Apr", 2851, 984, 1652 ) , new CarProduction("May", 2961, 1579, 1889 ) , new CarProduction("Jun", 1519, 1539, 1766 ) , new CarProduction("Jul", 2633, 1489, 1361 ) , new CarProduction("Aug", 1140, 650, 874 ) , new CarProduction("Sep", 1626, 653, 693 ) , new CarProduction("Oct", 1478, 2236, 786 ) , new CarProduction("Nov", 1306, 1937, 599 ) , new CarProduction("Dec", 1607, 2138, 678 ) }; ObjectProvider objProvider = new ObjectProvider(production); chart1.getDataSourceSettings().setDataSource(objProvider); }public static class CarProduction { private CarProduction(String month, int sedan, int coupe, int SUV) { this.setMonth(month); this.setSedan(sedan); this.setCoupe(coupe); this.setSUV(SUV); } private String privateMonth; public final String getMonth() { return privateMonth; } public final void setMonth(String value) { privateMonth = value; } private int privateSedan; public final int getSedan() { return privateSedan; } public final void setSedan(int value) { privateSedan = value; } private int privateCoupe; public final int getCoupe() { return privateCoupe; } public final void setCoupe(int value) { privateCoupe = value; } private int privateSUV; public final int getSUV() { return privateSUV; } public final void setSUV(int value) { privateSUV = value; } }
Depth value of 150:
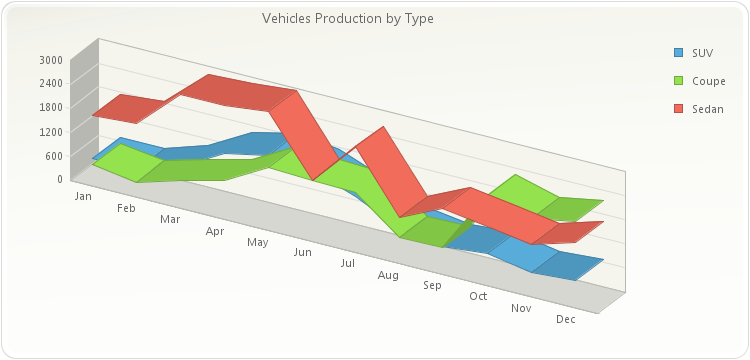
PopulateCarProduction(chart1);
chart1.getTitles().add(new TitleDockable("Vehicles Production by Type"));
chart1.getView3D().setEnabled(true);
chart1.getView3D().setAngleX(45);
chart1.getView3D().setDepth(150);
public static void PopulateCarProduction(Chart chart1) { CarProduction[] production = new CarProduction[] { new CarProduction("Jan", 1760, 535, 695 ) , new CarProduction("Feb", 1849, 395, 688 ) , new CarProduction("Mar", 2831, 685, 1047 ) , new CarProduction("Apr", 2851, 984, 1652 ) , new CarProduction("May", 2961, 1579, 1889 ) , new CarProduction("Jun", 1519, 1539, 1766 ) , new CarProduction("Jul", 2633, 1489, 1361 ) , new CarProduction("Aug", 1140, 650, 874 ) , new CarProduction("Sep", 1626, 653, 693 ) , new CarProduction("Oct", 1478, 2236, 786 ) , new CarProduction("Nov", 1306, 1937, 599 ) , new CarProduction("Dec", 1607, 2138, 678 ) }; ObjectProvider objProvider = new ObjectProvider(production); chart1.getDataSourceSettings().setDataSource(objProvider); }public static class CarProduction { private CarProduction(String month, int sedan, int coupe, int SUV) { this.setMonth(month); this.setSedan(sedan); this.setCoupe(coupe); this.setSUV(SUV); } private String privateMonth; public final String getMonth() { return privateMonth; } public final void setMonth(String value) { privateMonth = value; } private int privateSedan; public final int getSedan() { return privateSedan; } public final void setSedan(int value) { privateSedan = value; } private int privateCoupe; public final int getCoupe() { return privateCoupe; } public final void setCoupe(int value) { privateCoupe = value; } private int privateSUV; public final int getSUV() { return privateSUV; } public final void setSUV(int value) { privateSUV = value; } }
- See Also:
resetDepth
-
setDepth
public void setDepth(int value)
Gets or sets the thickness along the Z-axis for the series.
Below are two examples demonstrating the differences when using a Depth of 0 and a Depth of 150.
Depth value of 0:
PopulateCarProduction(chart1);
chart1.getTitles().add(new TitleDockable("Vehicles Production by Type"));
chart1.getView3D().setEnabled(true);
chart1.getView3D().setAngleX(45);
chart1.getView3D().setDepth(0);
public static void PopulateCarProduction(Chart chart1) { CarProduction[] production = new CarProduction[] { new CarProduction("Jan", 1760, 535, 695 ) , new CarProduction("Feb", 1849, 395, 688 ) , new CarProduction("Mar", 2831, 685, 1047 ) , new CarProduction("Apr", 2851, 984, 1652 ) , new CarProduction("May", 2961, 1579, 1889 ) , new CarProduction("Jun", 1519, 1539, 1766 ) , new CarProduction("Jul", 2633, 1489, 1361 ) , new CarProduction("Aug", 1140, 650, 874 ) , new CarProduction("Sep", 1626, 653, 693 ) , new CarProduction("Oct", 1478, 2236, 786 ) , new CarProduction("Nov", 1306, 1937, 599 ) , new CarProduction("Dec", 1607, 2138, 678 ) }; ObjectProvider objProvider = new ObjectProvider(production); chart1.getDataSourceSettings().setDataSource(objProvider); }public static class CarProduction { private CarProduction(String month, int sedan, int coupe, int SUV) { this.setMonth(month); this.setSedan(sedan); this.setCoupe(coupe); this.setSUV(SUV); } private String privateMonth; public final String getMonth() { return privateMonth; } public final void setMonth(String value) { privateMonth = value; } private int privateSedan; public final int getSedan() { return privateSedan; } public final void setSedan(int value) { privateSedan = value; } private int privateCoupe; public final int getCoupe() { return privateCoupe; } public final void setCoupe(int value) { privateCoupe = value; } private int privateSUV; public final int getSUV() { return privateSUV; } public final void setSUV(int value) { privateSUV = value; } }
Depth value of 150:
PopulateCarProduction(chart1);
chart1.getTitles().add(new TitleDockable("Vehicles Production by Type"));
chart1.getView3D().setEnabled(true);
chart1.getView3D().setAngleX(45);
chart1.getView3D().setDepth(150);
public static void PopulateCarProduction(Chart chart1) { CarProduction[] production = new CarProduction[] { new CarProduction("Jan", 1760, 535, 695 ) , new CarProduction("Feb", 1849, 395, 688 ) , new CarProduction("Mar", 2831, 685, 1047 ) , new CarProduction("Apr", 2851, 984, 1652 ) , new CarProduction("May", 2961, 1579, 1889 ) , new CarProduction("Jun", 1519, 1539, 1766 ) , new CarProduction("Jul", 2633, 1489, 1361 ) , new CarProduction("Aug", 1140, 650, 874 ) , new CarProduction("Sep", 1626, 653, 693 ) , new CarProduction("Oct", 1478, 2236, 786 ) , new CarProduction("Nov", 1306, 1937, 599 ) , new CarProduction("Dec", 1607, 2138, 678 ) }; ObjectProvider objProvider = new ObjectProvider(production); chart1.getDataSourceSettings().setDataSource(objProvider); }public static class CarProduction { private CarProduction(String month, int sedan, int coupe, int SUV) { this.setMonth(month); this.setSedan(sedan); this.setCoupe(coupe); this.setSUV(SUV); } private String privateMonth; public final String getMonth() { return privateMonth; } public final void setMonth(String value) { privateMonth = value; } private int privateSedan; public final int getSedan() { return privateSedan; } public final void setSedan(int value) { privateSedan = value; } private int privateCoupe; public final int getCoupe() { return privateCoupe; } public final void setCoupe(int value) { privateCoupe = value; } private int privateSUV; public final int getSUV() { return privateSUV; } public final void setSUV(int value) { privateSUV = value; } }
- Parameters:
value-- See Also:
resetDepth
-
isEnabled
public boolean isEnabled()
Gets or sets a value indicating whether 3D effects should be applied.
Toggles the chart between 2D and 3D modes. When set to true the chart is displayed in 3D.
To enable the 3D effects:
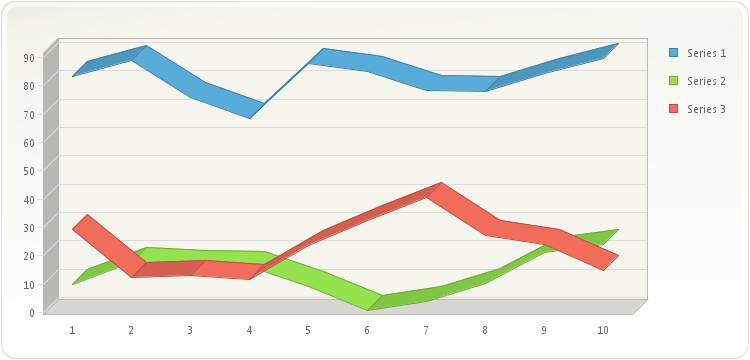
chart1.getView3D().setEnabled(true);
- See Also:
resetEnabled
-
setEnabled
public void setEnabled(boolean value)
Gets or sets a value indicating whether 3D effects should be applied.
Toggles the chart between 2D and 3D modes. When set to true the chart is displayed in 3D.
To enable the 3D effects:
chart1.getView3D().setEnabled(true);
- Parameters:
value-- See Also:
resetEnabled
-
getPerspective
public int getPerspective()
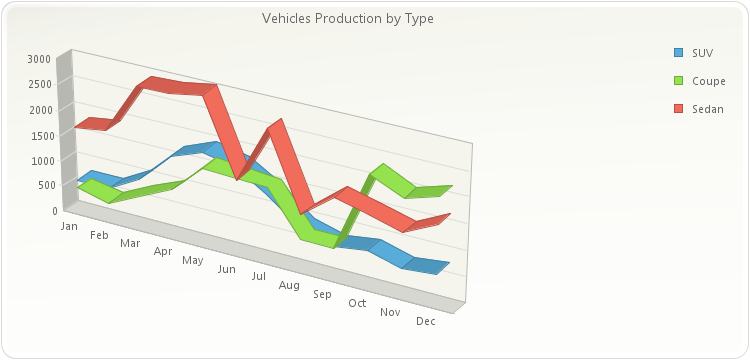
Allows you to set a 3D perspective to control the view of the chart depth.
The perspective value specifies the ratio of the front of the chart to the back of the chart. It ranges from 0 (default) degrees to 100 degrees.
In order to apply a perspective, the chart 3D
isEnabledmust be set to true.To see the difference, below is a chart with the perspective set to 0 (the default) and the same chart set with a perspective of 20.
A perspective value of 0 (default):
PopulateCarProduction(chart1);
chart1.getTitles().add(new TitleDockable("Vehicles Production by Type"));
chart1.getView3D().setEnabled(true);
chart1.getView3D().setPerspective(0);
public static void PopulateCarProduction(Chart chart1) { CarProduction[] production = new CarProduction[] { new CarProduction("Jan", 1760, 535, 695 ) , new CarProduction("Feb", 1849, 395, 688 ) , new CarProduction("Mar", 2831, 685, 1047 ) , new CarProduction("Apr", 2851, 984, 1652 ) , new CarProduction("May", 2961, 1579, 1889 ) , new CarProduction("Jun", 1519, 1539, 1766 ) , new CarProduction("Jul", 2633, 1489, 1361 ) , new CarProduction("Aug", 1140, 650, 874 ) , new CarProduction("Sep", 1626, 653, 693 ) , new CarProduction("Oct", 1478, 2236, 786 ) , new CarProduction("Nov", 1306, 1937, 599 ) , new CarProduction("Dec", 1607, 2138, 678 ) }; ObjectProvider objProvider = new ObjectProvider(production); chart1.getDataSourceSettings().setDataSource(objProvider); }public static class CarProduction { private CarProduction(String month, int sedan, int coupe, int SUV) { this.setMonth(month); this.setSedan(sedan); this.setCoupe(coupe); this.setSUV(SUV); } private String privateMonth; public final String getMonth() { return privateMonth; } public final void setMonth(String value) { privateMonth = value; } private int privateSedan; public final int getSedan() { return privateSedan; } public final void setSedan(int value) { privateSedan = value; } private int privateCoupe; public final int getCoupe() { return privateCoupe; } public final void setCoupe(int value) { privateCoupe = value; } private int privateSUV; public final int getSUV() { return privateSUV; } public final void setSUV(int value) { privateSUV = value; } }
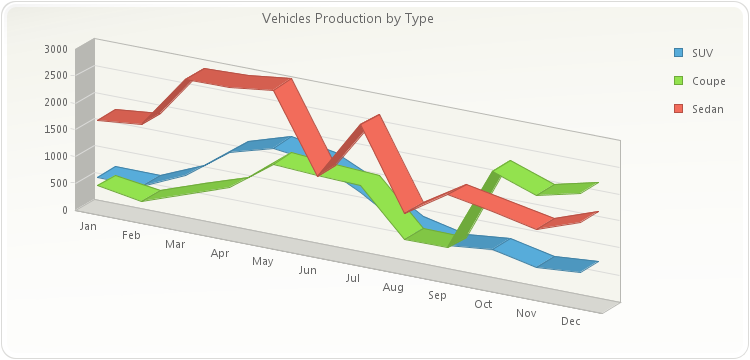
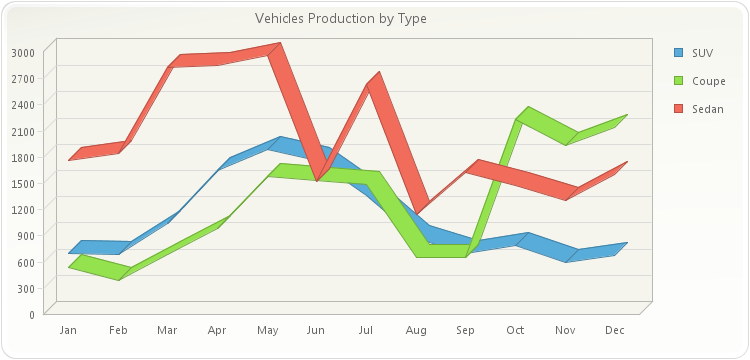
A perspective value of 20:
PopulateCarProduction(chart1);
chart1.getTitles().add(new TitleDockable("Vehicles Production by Type"));
chart1.getView3D().setEnabled(true);
chart1.getView3D().setPerspective(20);
public static void PopulateCarProduction(Chart chart1) { CarProduction[] production = new CarProduction[] { new CarProduction("Jan", 1760, 535, 695 ) , new CarProduction("Feb", 1849, 395, 688 ) , new CarProduction("Mar", 2831, 685, 1047 ) , new CarProduction("Apr", 2851, 984, 1652 ) , new CarProduction("May", 2961, 1579, 1889 ) , new CarProduction("Jun", 1519, 1539, 1766 ) , new CarProduction("Jul", 2633, 1489, 1361 ) , new CarProduction("Aug", 1140, 650, 874 ) , new CarProduction("Sep", 1626, 653, 693 ) , new CarProduction("Oct", 1478, 2236, 786 ) , new CarProduction("Nov", 1306, 1937, 599 ) , new CarProduction("Dec", 1607, 2138, 678 ) }; ObjectProvider objProvider = new ObjectProvider(production); chart1.getDataSourceSettings().setDataSource(objProvider); }public static class CarProduction { private CarProduction(String month, int sedan, int coupe, int SUV) { this.setMonth(month); this.setSedan(sedan); this.setCoupe(coupe); this.setSUV(SUV); } private String privateMonth; public final String getMonth() { return privateMonth; } public final void setMonth(String value) { privateMonth = value; } private int privateSedan; public final int getSedan() { return privateSedan; } public final void setSedan(int value) { privateSedan = value; } private int privateCoupe; public final int getCoupe() { return privateCoupe; } public final void setCoupe(int value) { privateCoupe = value; } private int privateSUV; public final int getSUV() { return privateSUV; } public final void setSUV(int value) { privateSUV = value; } }
- See Also:
resetPerspective
-
setPerspective
public void setPerspective(int value)
Allows you to set a 3D perspective to control the view of the chart depth.
The perspective value specifies the ratio of the front of the chart to the back of the chart. It ranges from 0 (default) degrees to 100 degrees.
In order to apply a perspective, the chart 3D
isEnabledmust be set to true.To see the difference, below is a chart with the perspective set to 0 (the default) and the same chart set with a perspective of 20.
A perspective value of 0 (default):
PopulateCarProduction(chart1);
chart1.getTitles().add(new TitleDockable("Vehicles Production by Type"));
chart1.getView3D().setEnabled(true);
chart1.getView3D().setPerspective(0);
public static void PopulateCarProduction(Chart chart1) { CarProduction[] production = new CarProduction[] { new CarProduction("Jan", 1760, 535, 695 ) , new CarProduction("Feb", 1849, 395, 688 ) , new CarProduction("Mar", 2831, 685, 1047 ) , new CarProduction("Apr", 2851, 984, 1652 ) , new CarProduction("May", 2961, 1579, 1889 ) , new CarProduction("Jun", 1519, 1539, 1766 ) , new CarProduction("Jul", 2633, 1489, 1361 ) , new CarProduction("Aug", 1140, 650, 874 ) , new CarProduction("Sep", 1626, 653, 693 ) , new CarProduction("Oct", 1478, 2236, 786 ) , new CarProduction("Nov", 1306, 1937, 599 ) , new CarProduction("Dec", 1607, 2138, 678 ) }; ObjectProvider objProvider = new ObjectProvider(production); chart1.getDataSourceSettings().setDataSource(objProvider); }public static class CarProduction { private CarProduction(String month, int sedan, int coupe, int SUV) { this.setMonth(month); this.setSedan(sedan); this.setCoupe(coupe); this.setSUV(SUV); } private String privateMonth; public final String getMonth() { return privateMonth; } public final void setMonth(String value) { privateMonth = value; } private int privateSedan; public final int getSedan() { return privateSedan; } public final void setSedan(int value) { privateSedan = value; } private int privateCoupe; public final int getCoupe() { return privateCoupe; } public final void setCoupe(int value) { privateCoupe = value; } private int privateSUV; public final int getSUV() { return privateSUV; } public final void setSUV(int value) { privateSUV = value; } }
A perspective value of 20:
PopulateCarProduction(chart1);
chart1.getTitles().add(new TitleDockable("Vehicles Production by Type"));
chart1.getView3D().setEnabled(true);
chart1.getView3D().setPerspective(20);
public static void PopulateCarProduction(Chart chart1) { CarProduction[] production = new CarProduction[] { new CarProduction("Jan", 1760, 535, 695 ) , new CarProduction("Feb", 1849, 395, 688 ) , new CarProduction("Mar", 2831, 685, 1047 ) , new CarProduction("Apr", 2851, 984, 1652 ) , new CarProduction("May", 2961, 1579, 1889 ) , new CarProduction("Jun", 1519, 1539, 1766 ) , new CarProduction("Jul", 2633, 1489, 1361 ) , new CarProduction("Aug", 1140, 650, 874 ) , new CarProduction("Sep", 1626, 653, 693 ) , new CarProduction("Oct", 1478, 2236, 786 ) , new CarProduction("Nov", 1306, 1937, 599 ) , new CarProduction("Dec", 1607, 2138, 678 ) }; ObjectProvider objProvider = new ObjectProvider(production); chart1.getDataSourceSettings().setDataSource(objProvider); }public static class CarProduction { private CarProduction(String month, int sedan, int coupe, int SUV) { this.setMonth(month); this.setSedan(sedan); this.setCoupe(coupe); this.setSUV(SUV); } private String privateMonth; public final String getMonth() { return privateMonth; } public final void setMonth(String value) { privateMonth = value; } private int privateSedan; public final int getSedan() { return privateSedan; } public final void setSedan(int value) { privateSedan = value; } private int privateCoupe; public final int getCoupe() { return privateCoupe; } public final void setCoupe(int value) { privateCoupe = value; } private int privateSUV; public final int getSUV() { return privateSUV; } public final void setSUV(int value) { privateSUV = value; } }
- Parameters:
value-- See Also:
resetPerspective
-
isRotated
public boolean isRotated()
Gets or sets a value indicating the chart is Rotated.
Allows you to enable or disable a Rotated view in a 3D chart.
When a chart is Rotated, angles and perspective attributes are also applied.
To enable rotation capabilities:
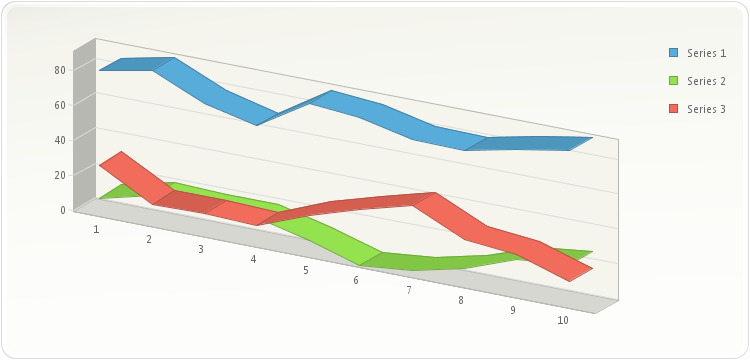
chart1.getView3D().setRotated(true);
- See Also:
resetRotated
-
setRotated
public void setRotated(boolean value)
Gets or sets a value indicating the chart is Rotated.
Allows you to enable or disable a Rotated view in a 3D chart.
When a chart is Rotated, angles and perspective attributes are also applied.
To enable rotation capabilities:
chart1.getView3D().setRotated(true);
- Parameters:
value-- See Also:
resetRotated
-
getShadow
public Shadow getShadow()
Gets or sets a value indicating the type of shading to display when the chart is displayed in 3D.
Below, all shading is turned off:
PopulateCarProduction(chart1);
chart1.getTitles().add(new TitleDockable("Vehicles Production by Type"));
chart1.getView3D().setEnabled(true);
chart1.getView3D().setShadow(Shadow.NONE);
public static void PopulateCarProduction(Chart chart1) { CarProduction[] production = new CarProduction[] { new CarProduction("Jan", 1760, 535, 695 ) , new CarProduction("Feb", 1849, 395, 688 ) , new CarProduction("Mar", 2831, 685, 1047 ) , new CarProduction("Apr", 2851, 984, 1652 ) , new CarProduction("May", 2961, 1579, 1889 ) , new CarProduction("Jun", 1519, 1539, 1766 ) , new CarProduction("Jul", 2633, 1489, 1361 ) , new CarProduction("Aug", 1140, 650, 874 ) , new CarProduction("Sep", 1626, 653, 693 ) , new CarProduction("Oct", 1478, 2236, 786 ) , new CarProduction("Nov", 1306, 1937, 599 ) , new CarProduction("Dec", 1607, 2138, 678 ) }; ObjectProvider objProvider = new ObjectProvider(production); chart1.getDataSourceSettings().setDataSource(objProvider); }public static class CarProduction { private CarProduction(String month, int sedan, int coupe, int SUV) { this.setMonth(month); this.setSedan(sedan); this.setCoupe(coupe); this.setSUV(SUV); } private String privateMonth; public final String getMonth() { return privateMonth; } public final void setMonth(String value) { privateMonth = value; } private int privateSedan; public final int getSedan() { return privateSedan; } public final void setSedan(int value) { privateSedan = value; } private int privateCoupe; public final int getCoupe() { return privateCoupe; } public final void setCoupe(int value) { privateCoupe = value; } private int privateSUV; public final int getSUV() { return privateSUV; } public final void setSUV(int value) { privateSUV = value; } }
- See Also:
resetShadow
-
setShadow
public void setShadow(Shadow value)
Gets or sets a value indicating the type of shading to display when the chart is displayed in 3D.
Below, all shading is turned off:
PopulateCarProduction(chart1);
chart1.getTitles().add(new TitleDockable("Vehicles Production by Type"));
chart1.getView3D().setEnabled(true);
chart1.getView3D().setShadow(Shadow.NONE);
public static void PopulateCarProduction(Chart chart1) { CarProduction[] production = new CarProduction[] { new CarProduction("Jan", 1760, 535, 695 ) , new CarProduction("Feb", 1849, 395, 688 ) , new CarProduction("Mar", 2831, 685, 1047 ) , new CarProduction("Apr", 2851, 984, 1652 ) , new CarProduction("May", 2961, 1579, 1889 ) , new CarProduction("Jun", 1519, 1539, 1766 ) , new CarProduction("Jul", 2633, 1489, 1361 ) , new CarProduction("Aug", 1140, 650, 874 ) , new CarProduction("Sep", 1626, 653, 693 ) , new CarProduction("Oct", 1478, 2236, 786 ) , new CarProduction("Nov", 1306, 1937, 599 ) , new CarProduction("Dec", 1607, 2138, 678 ) }; ObjectProvider objProvider = new ObjectProvider(production); chart1.getDataSourceSettings().setDataSource(objProvider); }public static class CarProduction { private CarProduction(String month, int sedan, int coupe, int SUV) { this.setMonth(month); this.setSedan(sedan); this.setCoupe(coupe); this.setSUV(SUV); } private String privateMonth; public final String getMonth() { return privateMonth; } public final void setMonth(String value) { privateMonth = value; } private int privateSedan; public final int getSedan() { return privateSedan; } public final void setSedan(int value) { privateSedan = value; } private int privateCoupe; public final int getCoupe() { return privateCoupe; } public final void setCoupe(int value) { privateCoupe = value; } private int privateSUV; public final int getSUV() { return privateSUV; } public final void setSUV(int value) { privateSUV = value; } }
- Parameters:
value-- See Also:
resetShadow
-
resetAngleX
public void resetAngleX()
Set the property AngleX to its default value.- See Also:
setAngleX
-
resetAngleY
public void resetAngleY()
Set the property AngleY to its default value.- See Also:
setAngleY
-
resetBoxThickness
public void resetBoxThickness()
Set the property BoxThickness to its default value.- See Also:
setBoxThickness
-
resetCluster
public void resetCluster()
Set the property Cluster to its default value.- See Also:
isCluster
-
resetDepth
public void resetDepth()
Set the property Depth to its default value.- See Also:
setDepth
-
resetEnabled
public void resetEnabled()
Set the property Enabled to its default value.- See Also:
isEnabled
-
resetPerspective
public void resetPerspective()
Set the property Perspective to its default value.- See Also:
setPerspective
-
resetRotated
public void resetRotated()
Set the property Rotated to its default value.- See Also:
isRotated
-
resetShadow
public void resetShadow()
Set the property Shadow to its default value.- See Also:
setShadow
-
-