- java.lang.Object
-
- com.softwarefx.chartfx.server.RealTimeSettings
-
public class RealTimeSettings
extends java.lang.Object
Provides access to the configuration of the real-time capabilities of the chart.
Chart FX supports true real-time charting capabilities by giving specific functions that support chart scrolling in an accelerated painting mode (without flickering). Using the supported members of this class, you can control the type and style of a real-time chart as well as visual attributes to make your charts more readable and useful.
setLoopMarkersets the visual methods of the loop marker.
-
-
Constructor Summary
Constructors Constructor and Description RealTimeSettings()Constructs a newly allocated RealTimeSettings object
-
Method Summary
Methods Modifier and Type Method and Description voidbeginAddData(int points, RealTimeAction action)Add points in the real-time chart.voidendAddData(boolean scrollLabels, boolean scrollToEnd)Refreshs the real-time chart after having added the points using BeginAddData.voidendAddData(boolean scrollLabels, boolean scrollToEnd, boolean recalculateScale)Refreshs the real-time chart after having added the points using BeginAddData.intgetBufferSize()Gets or sets the buffer size for real-time charts.LinegetLoopMarker()Allows you to apply the supported Lineclass members to the real-time loop marker.RealTimeModegetMode()Sets or Gets the RealTime Mode.booleanisBufferFull()Gets the status of the Buffer to see if it is full.booleanisFastScroll()Description goes herevoidresetBufferSize()Set the property BufferSize to its default value.voidresetMode()Set the property Mode to its default value.voidsetBufferSize(int value)Gets or sets the buffer size for real-time charts.voidsetFastScroll(boolean value)Description goes herevoidsetMode(RealTimeMode value)Sets or Gets the RealTime Mode.
-
-
-
Constructor Detail
-
RealTimeSettings
public RealTimeSettings()
Constructs a newly allocated RealTimeSettings object
-
-
Method Detail
-
isBufferFull
public boolean isBufferFull()
Gets the status of the Buffer to see if it is full.boolean temp; temp = chart1.getRealTime().getIsBufferFull();
-
getBufferSize
public int getBufferSize()
Gets or sets the buffer size for real-time charts. When setting this property, the data array will be cleared.
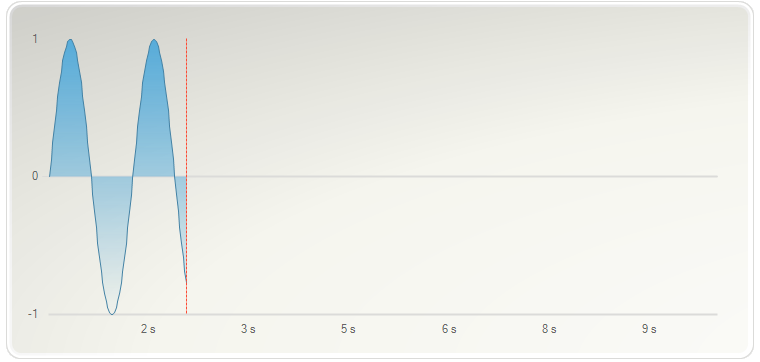
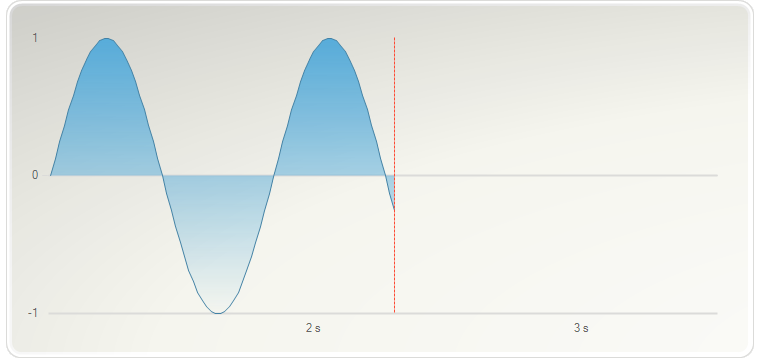
chart1.getRealTime().setBufferSize(400);
- See Also:
resetBufferSize
-
setBufferSize
public void setBufferSize(int value)
Gets or sets the buffer size for real-time charts. When setting this property, the data array will be cleared.
chart1.getRealTime().setBufferSize(400);
- Parameters:
value-- See Also:
resetBufferSize
-
isFastScroll
public boolean isFastScroll()
Description goes here
-
setFastScroll
public void setFastScroll(boolean value)
Description goes here- Parameters:
value-
-
getLoopMarker
public Line getLoopMarker()
Allows you to apply the supported Lineclass members to the real-time loop marker.
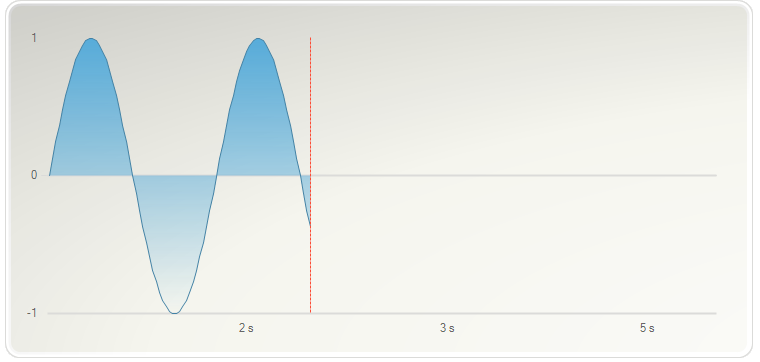
chart1.getRealTime().getLoopMarker().setColor(new java.awt.Color(255,0,0,255));
chart1.getRealTime().getLoopMarker().setStyle(DashStyle.DASH);
-
getMode
public RealTimeMode getMode()
Sets or Gets the RealTime Mode.
Loop Mode should be used if you prefer for a loop marker to move across the chart from left to right updating the values as it passes.
Scroll Mode should be used if you prefer the chart's data line/curve moving across from right to left updating the values on the right-most part of the chart.
To set the mode to scroll:
- See Also:
resetMode
-
setMode
public void setMode(RealTimeMode value)
Sets or Gets the RealTime Mode.
Loop Mode should be used if you prefer for a loop marker to move across the chart from left to right updating the values as it passes.
Scroll Mode should be used if you prefer the chart's data line/curve moving across from right to left updating the values on the right-most part of the chart.
To set the mode to scroll:
- Parameters:
value-- See Also:
resetMode
-
beginAddData
public void beginAddData(int points,
                RealTimeAction action)
Add points in the real-time chart.
This method needs to be called before EndAddData.
To append the data at the end of the chart:
chart1.getRealTime().BeginAddData(1, RealTimeAction.APPEND);
Alternativelly, the following chart inserts the real-time data at the beginning of the chart:
chart1.getRealTime().BeginAddData(1, RealTimeAction.INSERT);
- Parameters:
points- Number of points to add in the real-time chart.action- Append points in the end of the chart. Insert points in the beginning of the chart.
-
endAddData
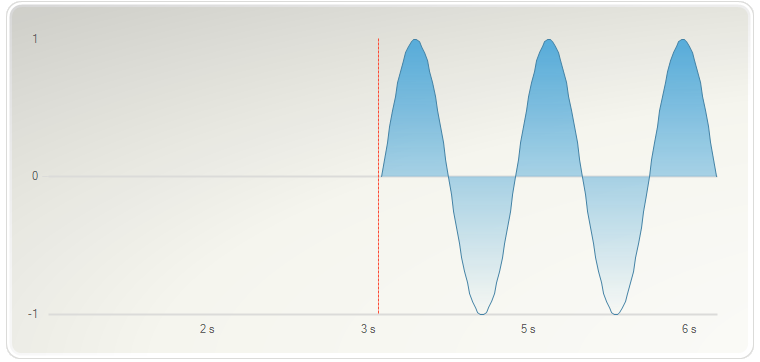
public void endAddData(boolean scrollLabels,
              boolean scrollToEnd)
Refreshs the real-time chart after having added the points using BeginAddData.
Below, scrollLabels is set to true:
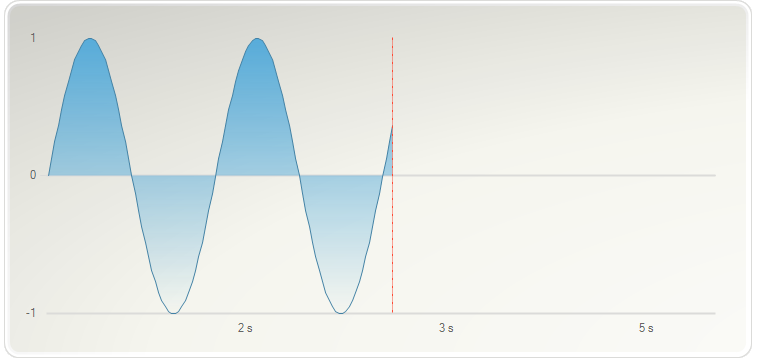
Alternativelly, scrollLabels is here set to false:
In this sample, every time the timer ticks, a new point is appended at the end of the chart. Therefore, a sinusoide is displayed dynamically in the chart.
For more information on how to use this method, please refer to the
beginAddDatamethod.- Parameters:
scrollLabels- If True, allows the scrolling of the temporal axis.scrollToEnd- If True, scroll to the last acquired point.
-
endAddData
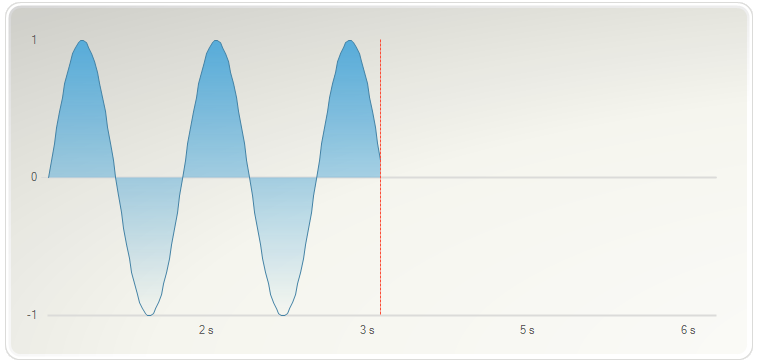
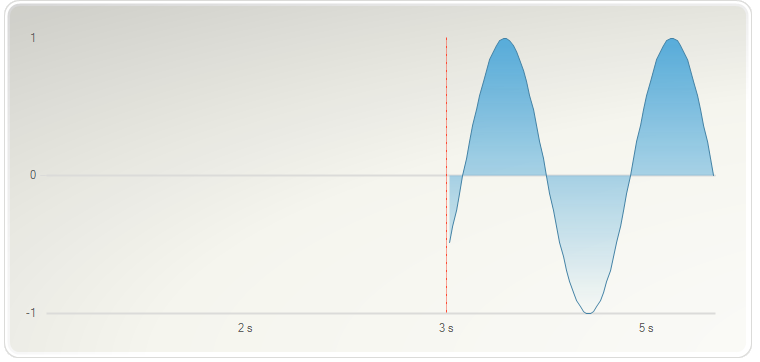
public void endAddData(boolean scrollLabels,
              boolean scrollToEnd,
              boolean recalculateScale)
Refreshs the real-time chart after having added the points using BeginAddData.
Below, scrollLabels is set to true:
Alternativelly, scrollLabels is here set to false:
In this sample, every time the timer ticks, a new point is appended at the end of the chart. Therefore, a sinusoide is displayed dynamically in the chart.
For more information on how to use this method, please refer to the
beginAddDatamethod.- Parameters:
scrollLabels-scrollToEnd-recalculateScale-
-
resetBufferSize
public void resetBufferSize()
Set the property BufferSize to its default value.- See Also:
setBufferSize
-
resetMode
public void resetMode()
Set the property Mode to its default value.- See Also:
setMode
-
-