 com.softwarefx.chartfx.desktop.galleries.Radar
|
Chart FX 7 for Java Desktop | |||||||
| PREV CLASS NEXT CLASS | FRAMES NO FRAMES | |||||||
| SUMMARY: NESTED | FIELD | CONSTR | METHOD | DETAIL: FIELD | CONSTR | METHOD | |||||||
java.lang.Object
public class Radar
Provides access to the Radar gallery object.
The properties of the Radar
Class
allow you to customize the visual attributes of a Radar or Polar chart. In order to make the supported members available, you must first set the gallery of the chart to Radar or Polar, and cast the Chart.setGalleryAttributes(com.softwarefx.chartfx.desktop.IGallery) property of the Chart to the Radar
Class
:
Radar radar = (Radar) chart1.getGalleryAttributes();
The cast will fail if the gallery is not set to Radar or Polar.
Once you have done this, using the newly created object you can assign these special attributes for the Radar or Polar gallery type in your chart.

| Constructor Summary | |
|---|---|
Radar()
|
|
| Method Summary | |
|---|---|
boolean |
isCircular()
Gets the Circular. |
boolean |
isClockwise()
Gets the Clockwise. |
boolean |
isClosed()
Gets the Closed. |
boolean |
isFillArea()
Gets the FillArea. |
boolean |
isShadows()
Gets the Shadows. |
boolean |
isShowLines()
Gets the ShowLines. |
void |
setCircular(boolean value)
Sets a value specifying to draw the Radar chart in a round or polygonal shape. |
void |
setClockwise(boolean value)
Sets a value indicating to plot points in a clockwise or counter-clockwise direction. |
void |
setClosed(boolean value)
Sets a value indicating whether or not to connect the first and last points in a radar chart. |
void |
setFillArea(boolean value)
Fills the inside area of a Radar chart. |
void |
setShadows(boolean value)
Sets a value indicating whether or not shadowing is applied for a 2D radar chart. |
void |
setShowLines(boolean value)
Shows or Hides the lines connecting each point in the radar Chart. |
| Methods inherited from class java.lang.Object |
|---|
equals, getClass, hashCode, notify, notifyAll, toString, wait, wait, wait |
| Constructor Detail |
|---|
public Radar()
| Method Detail |
|---|
public boolean isCircular()
Gets the Circular. For more detail see setCircular(boolean).
public boolean isClockwise()
Gets the Clockwise. For more detail see setClockwise(boolean).
public boolean isClosed()
Gets the Closed. For more detail see setClosed(boolean).
public boolean isFillArea()
Gets the FillArea. For more detail see setFillArea(boolean).
public boolean isShadows()
Gets the Shadows. For more detail see setShadows(boolean).
public boolean isShowLines()
Gets the ShowLines. For more detail see setShowLines(boolean).
public void setCircular(boolean value)
Sets a value specifying to draw the Radar chart in a round or polygonal shape.
When set to false, the radar will contain as many sides as points are present in the chart. The outer boundary of the Radar chart will be a polygon shape.
The setShadows(boolean) property may be used to remove the default shadow applied to 2D Radar charts.
The Chart.setGalleryAttributes(com.softwarefx.chartfx.desktop.IGallery) property of the Chart
Class
is used to access the GalleryAttributes object for a chart. The Radar object is a GalleryAttributes object.
setShadows(boolean),
Chart.setGalleryAttributes(com.softwarefx.chartfx.desktop.IGallery),
Chartpublic void setClockwise(boolean value)
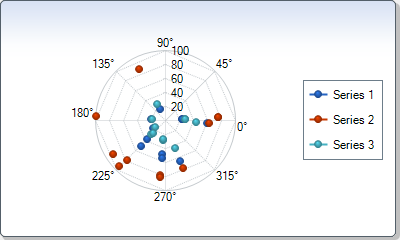
Sets a value indicating to plot points in a clockwise or counter-clockwise direction.
When XValues are configured in a radar chart, the chart is actually converted to a Polar chart that supports XValues between 0 and 360.
The setShowLines(boolean) property allows you to show or hide the connecting lines between the points in a radar chart.
The setCircular(boolean) property is used to set a circular border for the radar chart.
The Chart.setGalleryAttributes(com.softwarefx.chartfx.desktop.IGallery) property of the Chart
Class
is used to access the GalleryAttributes object for a chart. The Radar object is a GalleryAttributes object.
setShowLines(boolean),
setCircular(boolean)public void setClosed(boolean value)
Sets a value indicating whether or not to connect the first and last points in a radar chart.
By default this property is set to true. To create a radar chart with open ended series, set this property to false.
The setShowLines(boolean) property allows you to show or hide the connecting lines between the points in a radar chart.
The setCircular(boolean) property is used to set a circular border for the radar chart.
The Chart.setGalleryAttributes(com.softwarefx.chartfx.desktop.IGallery) property of the Chart
Class
is used to access the GalleryAttributes object for a chart. The Radar object is a GalleryAttributes object.
setShowLines(boolean),
setCircular(boolean)public void setFillArea(boolean value)
Fills the inside area of a Radar chart.
Below, the area of the Radar chart is filled:
The Chart.setGalleryAttributes(com.softwarefx.chartfx.desktop.IGallery) property of the Chart
Class
is used to access the GalleryAttributes object for a chart. The Radar object is a GalleryAttributes object.
setShowLines(boolean),
Chart.setGallery(com.softwarefx.chartfx.desktop.Gallery),
Chart.setGalleryAttributes(com.softwarefx.chartfx.desktop.IGallery),
Chartpublic void setShadows(boolean value)
Sets a value indicating whether or not shadowing is applied for a 2D radar chart.
Shadowing is always applied to 3D radar charts. The Attributes3D.setEnabled(boolean) method of the Attributes3D
Class
may be used to toggle 3D views for a chart.
The setCircular(boolean) property is used to set a circular border for the radar chart.
The setClockwise(boolean) property is used to control the direction of a radar plot.
The Chart.setGalleryAttributes(com.softwarefx.chartfx.desktop.IGallery) property of the Chart
Class
is used to access the GalleryAttributes object for a chart. The Radar object is a GalleryAttributes object.
setCircular(boolean),
setClockwise(boolean),
Chart.setGalleryAttributes(com.softwarefx.chartfx.desktop.IGallery),
Attributes3D,
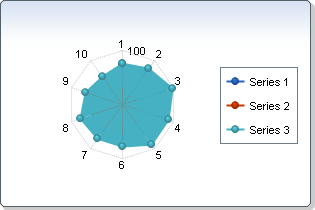
Chartpublic void setShowLines(boolean value)
Shows or Hides the lines connecting each point in the radar Chart.
Below, the lines in the Radar chart are hidden:
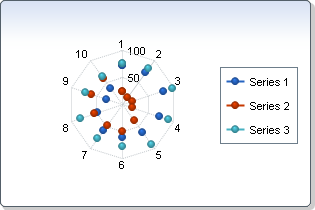
Chart.setGallery(com.softwarefx.chartfx.desktop.Gallery),
Chart.setGalleryAttributes(com.softwarefx.chartfx.desktop.IGallery),
Chart
|
http://www.softwarefx.com | |||||||
| PREV CLASS NEXT CLASS | FRAMES NO FRAMES | |||||||
| SUMMARY: NESTED | FIELD | CONSTR | METHOD | DETAIL: FIELD | CONSTR | METHOD | |||||||