- java.lang.Object
-
- com.softwarefx.chartfx.server.HighlightLegendAttributes
-
- Direct Known Subclasses:
- HighlightDataGridAttributes
public class HighlightLegendAttributes
extends java.lang.Object
Provides access to the HighlightLegendAttributes object, which allows you to customize whether the LegendBox is highlighted or not.
This class is derived from the HighlightAttributes class. The supported members are used specifically when customizing highlighting options for the Legend Box.

-
-
Constructor Summary
Constructors Constructor and Description HighlightLegendAttributes()Constructs a newly allocated HighlightLegendAttributes object
-
Method Summary
Methods Modifier and Type Method and Description booleanisEnabled()Gets or sets a value indicating whether the highlighting feature will be enabled in the selected Chart FX tool.voidresetEnabled()Set the property Enabled to its default value.voidresetFlags()Set the property Flags to its default value.voidsetEnabled(boolean value)Gets or sets a value indicating whether the highlighting feature will be enabled in the selected Chart FX tool.
-
-
-
Constructor Detail
-
HighlightLegendAttributes
public HighlightLegendAttributes()
Constructs a newly allocated HighlightLegendAttributes object
-
-
Method Detail
-
isEnabled
public boolean isEnabled()
Gets or sets a value indicating whether the highlighting feature will be enabled in the selected Chart FX tool.
The
setHighlightmethod of the chart tools (data grid, series legend, values legend, etc.) exposes this method. Setting theisEnabledmethod to false will disable the highlight feature for the specified tool.To disable the highlight feature for the Data Grid:
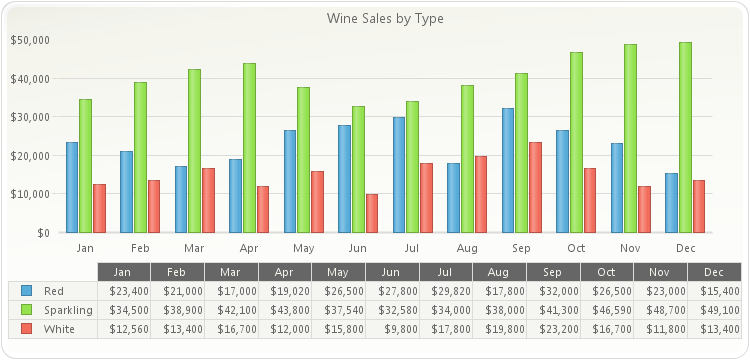
PopulateProductSales(chart1);
chart1.setGallery(Gallery.BAR);
chart1.getDataGrid().getHighlight().setEnabled(false);
chart1.getDataGrid().setVisible(true);
chart1.getLegendBox().setVisible(false);
chart1.getTitles().add(new TitleDockable("Wine Sales by Type"));
chart1.getAxisY().getLabelsFormat().setFormat(AxisFormat.CURRENCY);
public static void PopulateProductSales(Chart chart1) { ProductSales[] data = new ProductSales[]{ new ProductSales("Jan", 12560, 23400, 34500), new ProductSales("Feb", 13400, 21000, 38900), new ProductSales("Mar", 16700, 17000, 42100), new ProductSales("Apr", 12000, 19020, 43800), new ProductSales("May", 15800, 26500, 37540), new ProductSales("Jun", 9800, 27800, 32580), new ProductSales("Jul", 17800, 29820, 34000), new ProductSales("Aug", 19800, 17800, 38000), new ProductSales("Sep", 23200, 32000, 41300), new ProductSales("Oct", 16700, 26500, 46590), new ProductSales("Nov", 11800, 23000, 48700), new ProductSales("Dec", 13400, 15400, 49100) }; ObjectProvider objProvider = new ObjectProvider(data); chart1.getDataSourceSettings().setDataSource(objProvider); }public static class ProductSales { public ProductSales(String month, double white, double red, double sparkling) { this.setMonth(month); this.setWhite(white); this.setRed(red); this.setSparkling(sparkling); } private String privateMonth; public final String getMonth() { return privateMonth; } public final void setMonth(String value) { privateMonth = value; } private double privateWhite; public final double getWhite() { return privateWhite; } public final void setWhite(double value) { privateWhite = value; } private double privateRed; public final double getRed() { return privateRed; } public final void setRed(double value) { privateRed = value; } private double privateSparkling; public final double getSparkling() { return privateSparkling; } public final void setSparkling(double value) { privateSparkling = value; } }
Below, the highlighting is disabled for the Data Grid:
- See Also:
resetEnabled
-
setEnabled
public void setEnabled(boolean value)
Gets or sets a value indicating whether the highlighting feature will be enabled in the selected Chart FX tool.
The
setHighlightmethod of the chart tools (data grid, series legend, values legend, etc.) exposes this method. Setting theisEnabledmethod to false will disable the highlight feature for the specified tool.To disable the highlight feature for the Data Grid:
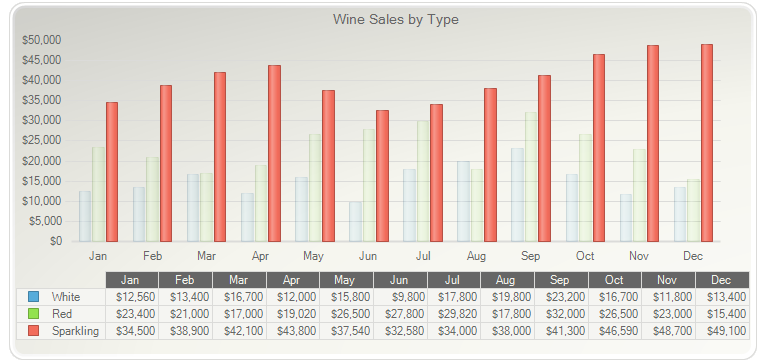
PopulateProductSales(chart1);
chart1.setGallery(Gallery.BAR);
chart1.getDataGrid().getHighlight().setEnabled(false);
chart1.getDataGrid().setVisible(true);
chart1.getLegendBox().setVisible(false);
chart1.getTitles().add(new TitleDockable("Wine Sales by Type"));
chart1.getAxisY().getLabelsFormat().setFormat(AxisFormat.CURRENCY);
public static void PopulateProductSales(Chart chart1) { ProductSales[] data = new ProductSales[]{ new ProductSales("Jan", 12560, 23400, 34500), new ProductSales("Feb", 13400, 21000, 38900), new ProductSales("Mar", 16700, 17000, 42100), new ProductSales("Apr", 12000, 19020, 43800), new ProductSales("May", 15800, 26500, 37540), new ProductSales("Jun", 9800, 27800, 32580), new ProductSales("Jul", 17800, 29820, 34000), new ProductSales("Aug", 19800, 17800, 38000), new ProductSales("Sep", 23200, 32000, 41300), new ProductSales("Oct", 16700, 26500, 46590), new ProductSales("Nov", 11800, 23000, 48700), new ProductSales("Dec", 13400, 15400, 49100) }; ObjectProvider objProvider = new ObjectProvider(data); chart1.getDataSourceSettings().setDataSource(objProvider); }public static class ProductSales { public ProductSales(String month, double white, double red, double sparkling) { this.setMonth(month); this.setWhite(white); this.setRed(red); this.setSparkling(sparkling); } private String privateMonth; public final String getMonth() { return privateMonth; } public final void setMonth(String value) { privateMonth = value; } private double privateWhite; public final double getWhite() { return privateWhite; } public final void setWhite(double value) { privateWhite = value; } private double privateRed; public final double getRed() { return privateRed; } public final void setRed(double value) { privateRed = value; } private double privateSparkling; public final double getSparkling() { return privateSparkling; } public final void setSparkling(double value) { privateSparkling = value; } }
Below, the highlighting is disabled for the Data Grid:
- Parameters:
value-- See Also:
resetEnabled
-
resetEnabled
public void resetEnabled()
Set the property Enabled to its default value.- See Also:
isEnabled
-
resetFlags
public void resetFlags()
Set the property Flags to its default value.
-
-