- java.lang.Object
-
- com.softwarefx.chartfx.server.HighlightLegendAttributes
-
- com.softwarefx.chartfx.server.HighlightDataGridAttributes
-
public final class HighlightDataGridAttributes
extends HighlightLegendAttributes
Provides access to the HighlightDataGridAttributes object, which allows you to customize how the DataGrid is highlighted.
This class is derived from the
HighlightLegendAttributesclass. The supported members are used specifically when customizing highlighting options for theDataGrid.

-
-
Constructor Summary
Constructors Constructor and Description HighlightDataGridAttributes()Constructs a newly allocated HighlightDataGridAttributes object
-
Method Summary
Methods Modifier and Type Method and Description java.awt.ColorgetBorderColor()Gets or sets the BorderColor for the hightlighted point's grid cell in the data grid.java.awt.ColorgetColor()Gets or sets the Color for the hightlighted grid cell in the data grid.DataGridHighlightStylegetDataCells()Gets or sets a value indicating the what will be highlighted in the chart when a cell in the data grid is highlighted.java.util.EnumSet<FontStyle>getFontStyle()Gets or sets additional font attributes to a highlighted cell of the data grid.java.awt.ColorgetTextColor()Gets or sets the color for text of a highlighted cell of the data grid.booleanisDimText()Gets or sets a value indicating whether the text in the non-selected data cells will be dimmed when the other data cells are highlighted.booleanisImmediate()Gets or sets a value indicating that the highlight action will occur immediately.voidresetBorderColor()Set the property BorderColor to its default value.voidresetColor()Set the property Color to its default value.voidresetDataCells()Set the property DataCells to its default value.voidresetDimText()Set the property DimText to its default value.voidresetFontStyle()Set the property FontStyle to its default value.voidresetGridFlags()Set the property GridFlags to its default value.voidresetImmediate()Set the property Immediate to its default value.voidresetTextColor()Set the property TextColor to its default value.voidsetBorderColor(java.awt.Color value)Gets or sets the BorderColor for the hightlighted point's grid cell in the data grid.voidsetColor(java.awt.Color value)Gets or sets the Color for the hightlighted grid cell in the data grid.voidsetDataCells(DataGridHighlightStyle value)Gets or sets a value indicating the what will be highlighted in the chart when a cell in the data grid is highlighted.voidsetDimText(boolean value)Gets or sets a value indicating whether the text in the non-selected data cells will be dimmed when the other data cells are highlighted.voidsetFontStyle(java.util.EnumSet<FontStyle> value)Gets or sets additional font attributes to a highlighted cell of the data grid.voidsetImmediate(boolean value)Gets or sets a value indicating that the highlight action will occur immediately.voidsetTextColor(java.awt.Color value)Gets or sets the color for text of a highlighted cell of the data grid.-
Methods inherited from class com.softwarefx.chartfx.server.HighlightLegendAttributes
isEnabled, resetEnabled, resetFlags, setEnabled
-
-
-
-
Constructor Detail
-
HighlightDataGridAttributes
public HighlightDataGridAttributes()
Constructs a newly allocated HighlightDataGridAttributes object
-
-
Method Detail
-
getBorderColor
public java.awt.Color getBorderColor()
Gets or sets the BorderColor for the hightlighted point's grid cell in the data grid.
In order to use this method, the DataGrid for the chart must be set to visible.
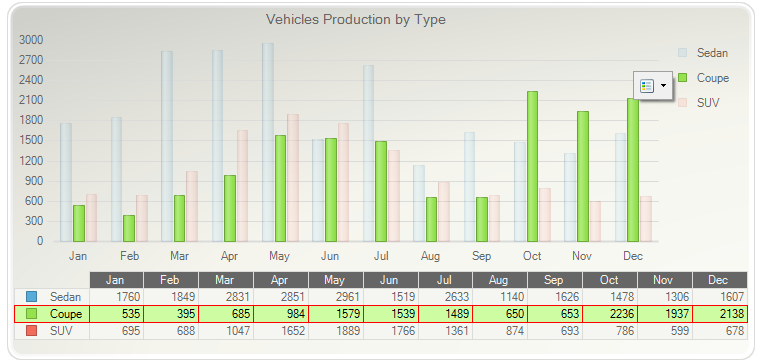
To configure red as the border color for a highlighted grid cell:
PopulateCarProduction(chart1);
chart1.getTitles().add(new TitleDockable("Vehicles Production by Type"));
chart1.setGallery(Gallery.BAR);
chart1.getDataGrid().setVisible(true);
chart1.getDataGrid().getHighlight().setBorderColor(new java.awt.Color(255,0,0,255));
public static void PopulateCarProduction(Chart chart1) { CarProduction[] production = new CarProduction[] { new CarProduction("Jan", 1760, 535, 695 ) , new CarProduction("Feb", 1849, 395, 688 ) , new CarProduction("Mar", 2831, 685, 1047 ) , new CarProduction("Apr", 2851, 984, 1652 ) , new CarProduction("May", 2961, 1579, 1889 ) , new CarProduction("Jun", 1519, 1539, 1766 ) , new CarProduction("Jul", 2633, 1489, 1361 ) , new CarProduction("Aug", 1140, 650, 874 ) , new CarProduction("Sep", 1626, 653, 693 ) , new CarProduction("Oct", 1478, 2236, 786 ) , new CarProduction("Nov", 1306, 1937, 599 ) , new CarProduction("Dec", 1607, 2138, 678 ) }; ObjectProvider objProvider = new ObjectProvider(production); chart1.getDataSourceSettings().setDataSource(objProvider); }public static class CarProduction { private CarProduction(String month, int sedan, int coupe, int SUV) { this.setMonth(month); this.setSedan(sedan); this.setCoupe(coupe); this.setSUV(SUV); } private String privateMonth; public final String getMonth() { return privateMonth; } public final void setMonth(String value) { privateMonth = value; } private int privateSedan; public final int getSedan() { return privateSedan; } public final void setSedan(int value) { privateSedan = value; } private int privateCoupe; public final int getCoupe() { return privateCoupe; } public final void setCoupe(int value) { privateCoupe = value; } private int privateSUV; public final int getSUV() { return privateSUV; } public final void setSUV(int value) { privateSUV = value; } }
Below is a DataGrid which sets the BorderColor to red when the second series is highlighted:
- See Also:
resetBorderColor
-
setBorderColor
public void setBorderColor(java.awt.Color value)
Gets or sets the BorderColor for the hightlighted point's grid cell in the data grid.
In order to use this method, the DataGrid for the chart must be set to visible.
To configure red as the border color for a highlighted grid cell:
PopulateCarProduction(chart1);
chart1.getTitles().add(new TitleDockable("Vehicles Production by Type"));
chart1.setGallery(Gallery.BAR);
chart1.getDataGrid().setVisible(true);
chart1.getDataGrid().getHighlight().setBorderColor(new java.awt.Color(255,0,0,255));
public static void PopulateCarProduction(Chart chart1) { CarProduction[] production = new CarProduction[] { new CarProduction("Jan", 1760, 535, 695 ) , new CarProduction("Feb", 1849, 395, 688 ) , new CarProduction("Mar", 2831, 685, 1047 ) , new CarProduction("Apr", 2851, 984, 1652 ) , new CarProduction("May", 2961, 1579, 1889 ) , new CarProduction("Jun", 1519, 1539, 1766 ) , new CarProduction("Jul", 2633, 1489, 1361 ) , new CarProduction("Aug", 1140, 650, 874 ) , new CarProduction("Sep", 1626, 653, 693 ) , new CarProduction("Oct", 1478, 2236, 786 ) , new CarProduction("Nov", 1306, 1937, 599 ) , new CarProduction("Dec", 1607, 2138, 678 ) }; ObjectProvider objProvider = new ObjectProvider(production); chart1.getDataSourceSettings().setDataSource(objProvider); }public static class CarProduction { private CarProduction(String month, int sedan, int coupe, int SUV) { this.setMonth(month); this.setSedan(sedan); this.setCoupe(coupe); this.setSUV(SUV); } private String privateMonth; public final String getMonth() { return privateMonth; } public final void setMonth(String value) { privateMonth = value; } private int privateSedan; public final int getSedan() { return privateSedan; } public final void setSedan(int value) { privateSedan = value; } private int privateCoupe; public final int getCoupe() { return privateCoupe; } public final void setCoupe(int value) { privateCoupe = value; } private int privateSUV; public final int getSUV() { return privateSUV; } public final void setSUV(int value) { privateSUV = value; } }
Below is a DataGrid which sets the BorderColor to red when the second series is highlighted:
- Parameters:
value-- See Also:
resetBorderColor
-
getColor
public java.awt.Color getColor()
Gets or sets the Color for the hightlighted grid cell in the data grid.
In order to use this method, the DataGrid for the chart must be set to visible.
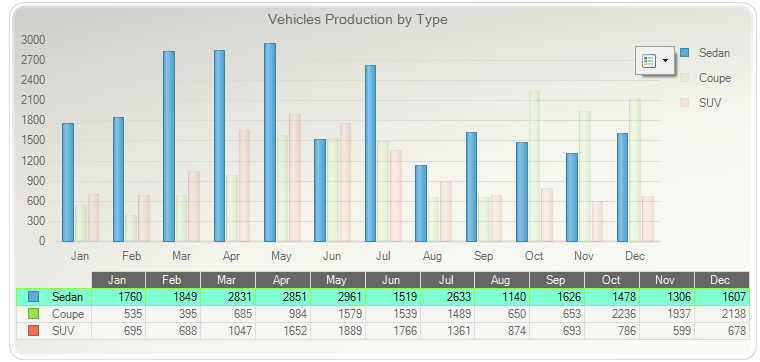
To configure Aquamarine as the Color for a highlighted grid cell:
PopulateCarProduction(chart1);
chart1.getTitles().add(new TitleDockable("Vehicles Production by Type"));
chart1.setGallery(Gallery.BAR);
chart1.getDataGrid().setVisible(true);
chart1.getDataGrid().getHighlight().setColor(new java.awt.Color(127,255,212,255));
public static void PopulateCarProduction(Chart chart1) { CarProduction[] production = new CarProduction[] { new CarProduction("Jan", 1760, 535, 695 ) , new CarProduction("Feb", 1849, 395, 688 ) , new CarProduction("Mar", 2831, 685, 1047 ) , new CarProduction("Apr", 2851, 984, 1652 ) , new CarProduction("May", 2961, 1579, 1889 ) , new CarProduction("Jun", 1519, 1539, 1766 ) , new CarProduction("Jul", 2633, 1489, 1361 ) , new CarProduction("Aug", 1140, 650, 874 ) , new CarProduction("Sep", 1626, 653, 693 ) , new CarProduction("Oct", 1478, 2236, 786 ) , new CarProduction("Nov", 1306, 1937, 599 ) , new CarProduction("Dec", 1607, 2138, 678 ) }; ObjectProvider objProvider = new ObjectProvider(production); chart1.getDataSourceSettings().setDataSource(objProvider); }public static class CarProduction { private CarProduction(String month, int sedan, int coupe, int SUV) { this.setMonth(month); this.setSedan(sedan); this.setCoupe(coupe); this.setSUV(SUV); } private String privateMonth; public final String getMonth() { return privateMonth; } public final void setMonth(String value) { privateMonth = value; } private int privateSedan; public final int getSedan() { return privateSedan; } public final void setSedan(int value) { privateSedan = value; } private int privateCoupe; public final int getCoupe() { return privateCoupe; } public final void setCoupe(int value) { privateCoupe = value; } private int privateSUV; public final int getSUV() { return privateSUV; } public final void setSUV(int value) { privateSUV = value; } }
Below is a DataGrid which sets the color to aquamarine when the first series is highlighted:
- See Also:
resetColor
-
setColor
public void setColor(java.awt.Color value)
Gets or sets the Color for the hightlighted grid cell in the data grid.
In order to use this method, the DataGrid for the chart must be set to visible.
To configure Aquamarine as the Color for a highlighted grid cell:
PopulateCarProduction(chart1);
chart1.getTitles().add(new TitleDockable("Vehicles Production by Type"));
chart1.setGallery(Gallery.BAR);
chart1.getDataGrid().setVisible(true);
chart1.getDataGrid().getHighlight().setColor(new java.awt.Color(127,255,212,255));
public static void PopulateCarProduction(Chart chart1) { CarProduction[] production = new CarProduction[] { new CarProduction("Jan", 1760, 535, 695 ) , new CarProduction("Feb", 1849, 395, 688 ) , new CarProduction("Mar", 2831, 685, 1047 ) , new CarProduction("Apr", 2851, 984, 1652 ) , new CarProduction("May", 2961, 1579, 1889 ) , new CarProduction("Jun", 1519, 1539, 1766 ) , new CarProduction("Jul", 2633, 1489, 1361 ) , new CarProduction("Aug", 1140, 650, 874 ) , new CarProduction("Sep", 1626, 653, 693 ) , new CarProduction("Oct", 1478, 2236, 786 ) , new CarProduction("Nov", 1306, 1937, 599 ) , new CarProduction("Dec", 1607, 2138, 678 ) }; ObjectProvider objProvider = new ObjectProvider(production); chart1.getDataSourceSettings().setDataSource(objProvider); }public static class CarProduction { private CarProduction(String month, int sedan, int coupe, int SUV) { this.setMonth(month); this.setSedan(sedan); this.setCoupe(coupe); this.setSUV(SUV); } private String privateMonth; public final String getMonth() { return privateMonth; } public final void setMonth(String value) { privateMonth = value; } private int privateSedan; public final int getSedan() { return privateSedan; } public final void setSedan(int value) { privateSedan = value; } private int privateCoupe; public final int getCoupe() { return privateCoupe; } public final void setCoupe(int value) { privateCoupe = value; } private int privateSUV; public final int getSUV() { return privateSUV; } public final void setSUV(int value) { privateSUV = value; } }
Below is a DataGrid which sets the color to aquamarine when the first series is highlighted:
- Parameters:
value-- See Also:
resetColor
-
getDataCells
public DataGridHighlightStyle getDataCells()
Gets or sets a value indicating the what will be highlighted in the chart when a cell in the data grid is highlighted.
Not only will the cells in the data grid be highlighted when a series is highlighted in the chart, but if a cell is highlighted in the data grid, the series/point will be highlighted in the chart. This method is used to control which chart elements will display the highlighted status within the chart.
To configure the DataGrid to highlight a marker:
PopulateCarProduction(chart1);
chart1.getTitles().add(new TitleDockable("Vehicles Production by Type"));
chart1.setGallery(Gallery.BAR);
chart1.getLegendBox().setVisible(false);
chart1.getDataGrid().setVisible(true);
chart1.getDataGrid().getHighlight().setDataCells(DataGridHighlightStyle.MARKER);
public static void PopulateCarProduction(Chart chart1) { CarProduction[] production = new CarProduction[] { new CarProduction("Jan", 1760, 535, 695 ) , new CarProduction("Feb", 1849, 395, 688 ) , new CarProduction("Mar", 2831, 685, 1047 ) , new CarProduction("Apr", 2851, 984, 1652 ) , new CarProduction("May", 2961, 1579, 1889 ) , new CarProduction("Jun", 1519, 1539, 1766 ) , new CarProduction("Jul", 2633, 1489, 1361 ) , new CarProduction("Aug", 1140, 650, 874 ) , new CarProduction("Sep", 1626, 653, 693 ) , new CarProduction("Oct", 1478, 2236, 786 ) , new CarProduction("Nov", 1306, 1937, 599 ) , new CarProduction("Dec", 1607, 2138, 678 ) }; ObjectProvider objProvider = new ObjectProvider(production); chart1.getDataSourceSettings().setDataSource(objProvider); }public static class CarProduction { private CarProduction(String month, int sedan, int coupe, int SUV) { this.setMonth(month); this.setSedan(sedan); this.setCoupe(coupe); this.setSUV(SUV); } private String privateMonth; public final String getMonth() { return privateMonth; } public final void setMonth(String value) { privateMonth = value; } private int privateSedan; public final int getSedan() { return privateSedan; } public final void setSedan(int value) { privateSedan = value; } private int privateCoupe; public final int getCoupe() { return privateCoupe; } public final void setCoupe(int value) { privateCoupe = value; } private int privateSUV; public final int getSUV() { return privateSUV; } public final void setSUV(int value) { privateSUV = value; } }
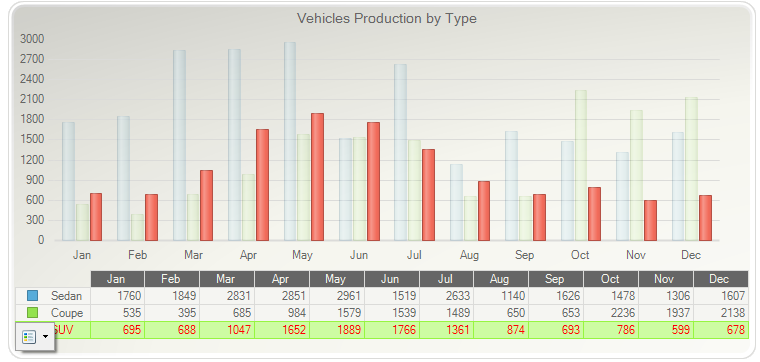
Below is the DataGrid configured to highlight the Point in the chart when a data cell is highlighted:

- See Also:
resetDataCells
-
setDataCells
public void setDataCells(DataGridHighlightStyle value)
Gets or sets a value indicating the what will be highlighted in the chart when a cell in the data grid is highlighted.
Not only will the cells in the data grid be highlighted when a series is highlighted in the chart, but if a cell is highlighted in the data grid, the series/point will be highlighted in the chart. This method is used to control which chart elements will display the highlighted status within the chart.
To configure the DataGrid to highlight a marker:
PopulateCarProduction(chart1);
chart1.getTitles().add(new TitleDockable("Vehicles Production by Type"));
chart1.setGallery(Gallery.BAR);
chart1.getLegendBox().setVisible(false);
chart1.getDataGrid().setVisible(true);
chart1.getDataGrid().getHighlight().setDataCells(DataGridHighlightStyle.MARKER);
public static void PopulateCarProduction(Chart chart1) { CarProduction[] production = new CarProduction[] { new CarProduction("Jan", 1760, 535, 695 ) , new CarProduction("Feb", 1849, 395, 688 ) , new CarProduction("Mar", 2831, 685, 1047 ) , new CarProduction("Apr", 2851, 984, 1652 ) , new CarProduction("May", 2961, 1579, 1889 ) , new CarProduction("Jun", 1519, 1539, 1766 ) , new CarProduction("Jul", 2633, 1489, 1361 ) , new CarProduction("Aug", 1140, 650, 874 ) , new CarProduction("Sep", 1626, 653, 693 ) , new CarProduction("Oct", 1478, 2236, 786 ) , new CarProduction("Nov", 1306, 1937, 599 ) , new CarProduction("Dec", 1607, 2138, 678 ) }; ObjectProvider objProvider = new ObjectProvider(production); chart1.getDataSourceSettings().setDataSource(objProvider); }public static class CarProduction { private CarProduction(String month, int sedan, int coupe, int SUV) { this.setMonth(month); this.setSedan(sedan); this.setCoupe(coupe); this.setSUV(SUV); } private String privateMonth; public final String getMonth() { return privateMonth; } public final void setMonth(String value) { privateMonth = value; } private int privateSedan; public final int getSedan() { return privateSedan; } public final void setSedan(int value) { privateSedan = value; } private int privateCoupe; public final int getCoupe() { return privateCoupe; } public final void setCoupe(int value) { privateCoupe = value; } private int privateSUV; public final int getSUV() { return privateSUV; } public final void setSUV(int value) { privateSUV = value; } }
Below is the DataGrid configured to highlight the Point in the chart when a data cell is highlighted:
- Parameters:
value-- See Also:
resetDataCells
-
isDimText
public boolean isDimText()
Gets or sets a value indicating whether the text in the non-selected data cells will be dimmed when the other data cells are highlighted.
PopulateCarProduction(chart1);
chart1.getTitles().add(new TitleDockable("Vehicles Production by Type"));
chart1.setGallery(Gallery.BAR);
chart1.getLegendBox().setVisible(false);
chart1.getDataGrid().setVisible(true);
chart1.getDataGrid().getHighlight().setDimText(true);
public static void PopulateCarProduction(Chart chart1) { CarProduction[] production = new CarProduction[] { new CarProduction("Jan", 1760, 535, 695 ) , new CarProduction("Feb", 1849, 395, 688 ) , new CarProduction("Mar", 2831, 685, 1047 ) , new CarProduction("Apr", 2851, 984, 1652 ) , new CarProduction("May", 2961, 1579, 1889 ) , new CarProduction("Jun", 1519, 1539, 1766 ) , new CarProduction("Jul", 2633, 1489, 1361 ) , new CarProduction("Aug", 1140, 650, 874 ) , new CarProduction("Sep", 1626, 653, 693 ) , new CarProduction("Oct", 1478, 2236, 786 ) , new CarProduction("Nov", 1306, 1937, 599 ) , new CarProduction("Dec", 1607, 2138, 678 ) }; ObjectProvider objProvider = new ObjectProvider(production); chart1.getDataSourceSettings().setDataSource(objProvider); }public static class CarProduction { private CarProduction(String month, int sedan, int coupe, int SUV) { this.setMonth(month); this.setSedan(sedan); this.setCoupe(coupe); this.setSUV(SUV); } private String privateMonth; public final String getMonth() { return privateMonth; } public final void setMonth(String value) { privateMonth = value; } private int privateSedan; public final int getSedan() { return privateSedan; } public final void setSedan(int value) { privateSedan = value; } private int privateCoupe; public final int getCoupe() { return privateCoupe; } public final void setCoupe(int value) { privateCoupe = value; } private int privateSUV; public final int getSUV() { return privateSUV; } public final void setSUV(int value) { privateSUV = value; } }
- See Also:
resetDimText
-
setDimText
public void setDimText(boolean value)
Gets or sets a value indicating whether the text in the non-selected data cells will be dimmed when the other data cells are highlighted.
PopulateCarProduction(chart1);
chart1.getTitles().add(new TitleDockable("Vehicles Production by Type"));
chart1.setGallery(Gallery.BAR);
chart1.getLegendBox().setVisible(false);
chart1.getDataGrid().setVisible(true);
chart1.getDataGrid().getHighlight().setDimText(true);
public static void PopulateCarProduction(Chart chart1) { CarProduction[] production = new CarProduction[] { new CarProduction("Jan", 1760, 535, 695 ) , new CarProduction("Feb", 1849, 395, 688 ) , new CarProduction("Mar", 2831, 685, 1047 ) , new CarProduction("Apr", 2851, 984, 1652 ) , new CarProduction("May", 2961, 1579, 1889 ) , new CarProduction("Jun", 1519, 1539, 1766 ) , new CarProduction("Jul", 2633, 1489, 1361 ) , new CarProduction("Aug", 1140, 650, 874 ) , new CarProduction("Sep", 1626, 653, 693 ) , new CarProduction("Oct", 1478, 2236, 786 ) , new CarProduction("Nov", 1306, 1937, 599 ) , new CarProduction("Dec", 1607, 2138, 678 ) }; ObjectProvider objProvider = new ObjectProvider(production); chart1.getDataSourceSettings().setDataSource(objProvider); }public static class CarProduction { private CarProduction(String month, int sedan, int coupe, int SUV) { this.setMonth(month); this.setSedan(sedan); this.setCoupe(coupe); this.setSUV(SUV); } private String privateMonth; public final String getMonth() { return privateMonth; } public final void setMonth(String value) { privateMonth = value; } private int privateSedan; public final int getSedan() { return privateSedan; } public final void setSedan(int value) { privateSedan = value; } private int privateCoupe; public final int getCoupe() { return privateCoupe; } public final void setCoupe(int value) { privateCoupe = value; } private int privateSUV; public final int getSUV() { return privateSUV; } public final void setSUV(int value) { privateSUV = value; } }
- Parameters:
value-- See Also:
resetDimText
-
getFontStyle
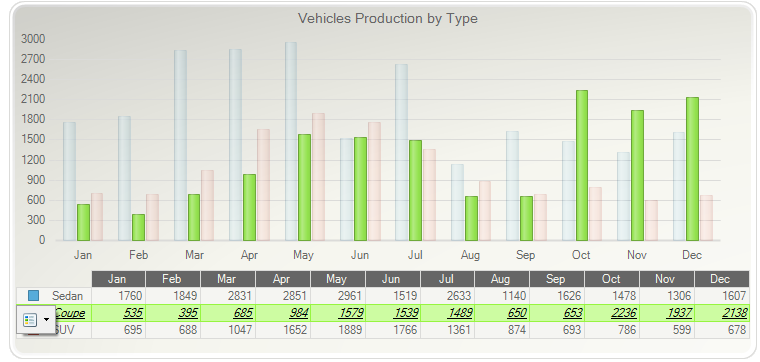
public java.util.EnumSet<FontStyle> getFontStyle()
Gets or sets additional font attributes to a highlighted cell of the data grid.
PopulateCarProduction(chart1);
chart1.getTitles().add(new TitleDockable("Vehicles Production by Type"));
chart1.setGallery(Gallery.BAR);
chart1.getLegendBox().setVisible(false);
chart1.getDataGrid().setVisible(true);
java.util.EnumSet<FontStyle> style = chart1.getDataGrid().getHighlight().getFontStyle();

style.add(FontStyle.UNDERLINE);

chart1.getDataGrid().getHighlight().setFontStyle(style);
public static void PopulateCarProduction(Chart chart1) { CarProduction[] production = new CarProduction[] { new CarProduction("Jan", 1760, 535, 695 ) , new CarProduction("Feb", 1849, 395, 688 ) , new CarProduction("Mar", 2831, 685, 1047 ) , new CarProduction("Apr", 2851, 984, 1652 ) , new CarProduction("May", 2961, 1579, 1889 ) , new CarProduction("Jun", 1519, 1539, 1766 ) , new CarProduction("Jul", 2633, 1489, 1361 ) , new CarProduction("Aug", 1140, 650, 874 ) , new CarProduction("Sep", 1626, 653, 693 ) , new CarProduction("Oct", 1478, 2236, 786 ) , new CarProduction("Nov", 1306, 1937, 599 ) , new CarProduction("Dec", 1607, 2138, 678 ) }; ObjectProvider objProvider = new ObjectProvider(production); chart1.getDataSourceSettings().setDataSource(objProvider); }public static class CarProduction { private CarProduction(String month, int sedan, int coupe, int SUV) { this.setMonth(month); this.setSedan(sedan); this.setCoupe(coupe); this.setSUV(SUV); } private String privateMonth; public final String getMonth() { return privateMonth; } public final void setMonth(String value) { privateMonth = value; } private int privateSedan; public final int getSedan() { return privateSedan; } public final void setSedan(int value) { privateSedan = value; } private int privateCoupe; public final int getCoupe() { return privateCoupe; } public final void setCoupe(int value) { privateCoupe = value; } private int privateSUV; public final int getSUV() { return privateSUV; } public final void setSUV(int value) { privateSUV = value; } }
- See Also:
resetFontStyle
-
setFontStyle
public void setFontStyle(java.util.EnumSet<FontStyle> value)
Gets or sets additional font attributes to a highlighted cell of the data grid.
PopulateCarProduction(chart1);
chart1.getTitles().add(new TitleDockable("Vehicles Production by Type"));
chart1.setGallery(Gallery.BAR);
chart1.getLegendBox().setVisible(false);
chart1.getDataGrid().setVisible(true);
java.util.EnumSet<FontStyle> style = chart1.getDataGrid().getHighlight().getFontStyle();

style.add(FontStyle.UNDERLINE);

chart1.getDataGrid().getHighlight().setFontStyle(style);
public static void PopulateCarProduction(Chart chart1) { CarProduction[] production = new CarProduction[] { new CarProduction("Jan", 1760, 535, 695 ) , new CarProduction("Feb", 1849, 395, 688 ) , new CarProduction("Mar", 2831, 685, 1047 ) , new CarProduction("Apr", 2851, 984, 1652 ) , new CarProduction("May", 2961, 1579, 1889 ) , new CarProduction("Jun", 1519, 1539, 1766 ) , new CarProduction("Jul", 2633, 1489, 1361 ) , new CarProduction("Aug", 1140, 650, 874 ) , new CarProduction("Sep", 1626, 653, 693 ) , new CarProduction("Oct", 1478, 2236, 786 ) , new CarProduction("Nov", 1306, 1937, 599 ) , new CarProduction("Dec", 1607, 2138, 678 ) }; ObjectProvider objProvider = new ObjectProvider(production); chart1.getDataSourceSettings().setDataSource(objProvider); }public static class CarProduction { private CarProduction(String month, int sedan, int coupe, int SUV) { this.setMonth(month); this.setSedan(sedan); this.setCoupe(coupe); this.setSUV(SUV); } private String privateMonth; public final String getMonth() { return privateMonth; } public final void setMonth(String value) { privateMonth = value; } private int privateSedan; public final int getSedan() { return privateSedan; } public final void setSedan(int value) { privateSedan = value; } private int privateCoupe; public final int getCoupe() { return privateCoupe; } public final void setCoupe(int value) { privateCoupe = value; } private int privateSUV; public final int getSUV() { return privateSUV; } public final void setSUV(int value) { privateSUV = value; } }
- Parameters:
value-- See Also:
resetFontStyle
-
isImmediate
public boolean isImmediate()
Gets or sets a value indicating that the highlight action will occur immediately.chart1.getDataGrid().getHighlight().setImmediate(true);
- See Also:
resetImmediate
-
setImmediate
public void setImmediate(boolean value)
Gets or sets a value indicating that the highlight action will occur immediately.chart1.getDataGrid().getHighlight().setImmediate(true);
- Parameters:
value-- See Also:
resetImmediate
-
getTextColor
public java.awt.Color getTextColor()
Gets or sets the color for text of a highlighted cell of the data grid.
In order to use this method, the DataGrid for the chart must be set to visible.
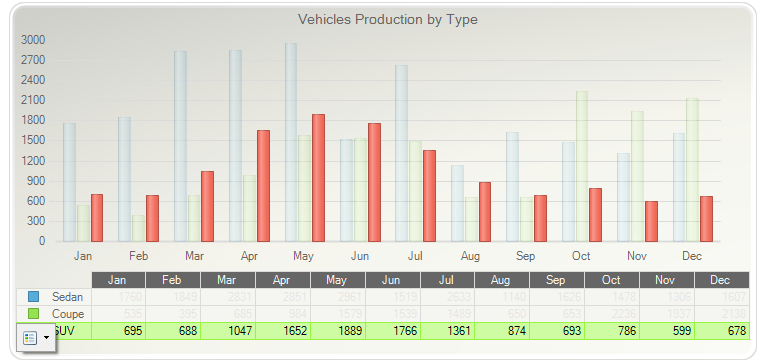
To configure highlighted cells to display red text:
PopulateCarProduction(chart1);
chart1.getTitles().add(new TitleDockable("Vehicles Production by Type"));
chart1.setGallery(Gallery.BAR);
chart1.getLegendBox().setVisible(false);
chart1.getDataGrid().setVisible(true);
chart1.getDataGrid().getHighlight().setTextColor(new java.awt.Color(255,0,0,255));
public static void PopulateCarProduction(Chart chart1) { CarProduction[] production = new CarProduction[] { new CarProduction("Jan", 1760, 535, 695 ) , new CarProduction("Feb", 1849, 395, 688 ) , new CarProduction("Mar", 2831, 685, 1047 ) , new CarProduction("Apr", 2851, 984, 1652 ) , new CarProduction("May", 2961, 1579, 1889 ) , new CarProduction("Jun", 1519, 1539, 1766 ) , new CarProduction("Jul", 2633, 1489, 1361 ) , new CarProduction("Aug", 1140, 650, 874 ) , new CarProduction("Sep", 1626, 653, 693 ) , new CarProduction("Oct", 1478, 2236, 786 ) , new CarProduction("Nov", 1306, 1937, 599 ) , new CarProduction("Dec", 1607, 2138, 678 ) }; ObjectProvider objProvider = new ObjectProvider(production); chart1.getDataSourceSettings().setDataSource(objProvider); }public static class CarProduction { private CarProduction(String month, int sedan, int coupe, int SUV) { this.setMonth(month); this.setSedan(sedan); this.setCoupe(coupe); this.setSUV(SUV); } private String privateMonth; public final String getMonth() { return privateMonth; } public final void setMonth(String value) { privateMonth = value; } private int privateSedan; public final int getSedan() { return privateSedan; } public final void setSedan(int value) { privateSedan = value; } private int privateCoupe; public final int getCoupe() { return privateCoupe; } public final void setCoupe(int value) { privateCoupe = value; } private int privateSUV; public final int getSUV() { return privateSUV; } public final void setSUV(int value) { privateSUV = value; } }
Below is a DataGrid which sets the color of the text in the highlighted cells to red:
- See Also:
resetTextColor
-
setTextColor
public void setTextColor(java.awt.Color value)
Gets or sets the color for text of a highlighted cell of the data grid.
In order to use this method, the DataGrid for the chart must be set to visible.
To configure highlighted cells to display red text:
PopulateCarProduction(chart1);
chart1.getTitles().add(new TitleDockable("Vehicles Production by Type"));
chart1.setGallery(Gallery.BAR);
chart1.getLegendBox().setVisible(false);
chart1.getDataGrid().setVisible(true);
chart1.getDataGrid().getHighlight().setTextColor(new java.awt.Color(255,0,0,255));
public static void PopulateCarProduction(Chart chart1) { CarProduction[] production = new CarProduction[] { new CarProduction("Jan", 1760, 535, 695 ) , new CarProduction("Feb", 1849, 395, 688 ) , new CarProduction("Mar", 2831, 685, 1047 ) , new CarProduction("Apr", 2851, 984, 1652 ) , new CarProduction("May", 2961, 1579, 1889 ) , new CarProduction("Jun", 1519, 1539, 1766 ) , new CarProduction("Jul", 2633, 1489, 1361 ) , new CarProduction("Aug", 1140, 650, 874 ) , new CarProduction("Sep", 1626, 653, 693 ) , new CarProduction("Oct", 1478, 2236, 786 ) , new CarProduction("Nov", 1306, 1937, 599 ) , new CarProduction("Dec", 1607, 2138, 678 ) }; ObjectProvider objProvider = new ObjectProvider(production); chart1.getDataSourceSettings().setDataSource(objProvider); }public static class CarProduction { private CarProduction(String month, int sedan, int coupe, int SUV) { this.setMonth(month); this.setSedan(sedan); this.setCoupe(coupe); this.setSUV(SUV); } private String privateMonth; public final String getMonth() { return privateMonth; } public final void setMonth(String value) { privateMonth = value; } private int privateSedan; public final int getSedan() { return privateSedan; } public final void setSedan(int value) { privateSedan = value; } private int privateCoupe; public final int getCoupe() { return privateCoupe; } public final void setCoupe(int value) { privateCoupe = value; } private int privateSUV; public final int getSUV() { return privateSUV; } public final void setSUV(int value) { privateSUV = value; } }
Below is a DataGrid which sets the color of the text in the highlighted cells to red:
- Parameters:
value-- See Also:
resetTextColor
-
resetBorderColor
public void resetBorderColor()
Set the property BorderColor to its default value.- See Also:
setBorderColor
-
resetColor
public void resetColor()
Set the property Color to its default value.- See Also:
setColor
-
resetDataCells
public void resetDataCells()
Set the property DataCells to its default value.- See Also:
setDataCells
-
resetDimText
public void resetDimText()
Set the property DimText to its default value.- See Also:
isDimText
-
resetFontStyle
public void resetFontStyle()
Set the property FontStyle to its default value.- See Also:
setFontStyle
-
resetGridFlags
public void resetGridFlags()
Set the property GridFlags to its default value.
-
resetImmediate
public void resetImmediate()
Set the property Immediate to its default value.- See Also:
isImmediate
-
resetTextColor
public void resetTextColor()
Set the property TextColor to its default value.- See Also:
setTextColor
-
-