- java.lang.Object
-
- com.softwarefx.chartfx.server.DockableBar
-
- com.softwarefx.chartfx.server.DataGrid
-
public final class DataGrid
extends DockableBar
Provides access to the DataGrid object, which is a component that displays data in a tabular format.
Chart FX provides a spreadsheet called DataGrid, that allows users to see the data contained in the chart in tabular format.
The DataGrid can be controlled separately from the Chart, allowing docking styles and independent visual attributes.

-
-
Constructor Summary
Constructors Constructor and Description DataGrid()Constructs a newly allocated DataGrid object
-
Method Summary
Methods Modifier and Type Method and Description java.awt.ColorgetBackColorData()Sets the background color of the cells on the data grid.java.awt.ColorgetBackColorDataAlternate()Assigns the alternate color for displaying the DataGrid rows or columns.java.awt.ColorgetBackColorHeader()Sets the background color of the header for the data grid.CellAttributesCollectiongetCells()Gets the collection of CellAttributes that belong to the DataGrid.ContentLayoutgetContentLayout()Allows you to align the data grid in the bottom of the chart area.java.awt.FontgetFont()Allows you to set the font used throughout the data grid.HighlightDataGridAttributesgetHighlight()Returns a HighlightDataGridAttributes object for the DataGrid.java.awt.ColorgetHorizontalGridColor()Allows you to set the Horizontal color for the gridlines displayed in the data grid.InterlacedgetInterlaced()Alternates the background color of on the data grid to improve readability.shortgetMaxSizePercentage()Allows you to specify the maximum percentage of the chart area the data grid may occupy.intgetScrollPosition()Scrolls the data horizontally to the specific column in the Grid.intgetScrollSize()Returns the number of scrolls in the data grid based on the scroll view configuration.java.awt.ColorgetTextColorData()Sets the text color of the cells on the data grid.java.awt.ColorgetTextColorDataAlternate()Sets the alternate text color for text in the data grid cells.java.awt.ColorgetTextColorHeader()Gets or sets the text color of the headers on the data grid.java.awt.ColorgetVerticalGridColor()Allows you to select the Vertical line color for the gridline displayed at the data grid box.booleanisHideXValues()Used to hide the XValues in the data grid of an XY plot chart.booleanisReadOnly()Permits values to be changed through the data grid.booleanisShowHeader()Gets or sets a value indicating the header of the columns should be visible or not.booleanisShowHiddenSeries()Gets or sets a value indicating hidden series should be visible in data grid.booleanisShowMarkers()Gets or sets a value indicating whether series markers should be visible in the series headers.booleanisUseRawData()Gets or sets a value indicating whether to use raw data or use calculated values in the data grid.booleanisXValuesAsHeaders()Gets or sets a value instructing that XValues be used as the headers in the data grid.voidresetBackColorData()Set the property BackColorData to its default value.voidresetBackColorDataAlternate()Set the property BackColorDataAlternate to its default value.voidresetBackColorHeader()Set the property BackColorHeader to its default value.voidresetContentLayout()Set the property ContentLayout to its default value.voidresetFont()Set the property Font to its default value.voidresetHideXValues()Set the property HideXValues to its default value.voidresetHorizontalGridColor()Set the property HorizontalGridColor to its default value.voidresetInterlaced()Set the property Interlaced to its default value.voidresetMaxSizePercentage()Set the property MaxSizePercentage to its default value.voidresetReadOnly()Set the property ReadOnly to its default value.voidresetShowHeader()Set the property ShowHeader to its default value.voidresetShowHiddenSeries()Set the property ShowHiddenSeries to its default value.voidresetShowMarkers()Set the property ShowMarkers to its default value.voidresetTextColorData()Set the property TextColorData to its default value.voidresetTextColorDataAlternate()Set the property TextColorDataAlternate to its default value.voidresetTextColorHeader()Set the property TextColorHeader to its default value.voidresetUseRawData()Set the property UseRawData to its default value.voidresetVerticalGridColor()Set the property VerticalGridColor to its default value.voidresetXValuesAsHeaders()Set the property XValuesAsHeaders to its default value.voidsetBackColorData(java.awt.Color value)Sets the background color of the cells on the data grid.voidsetBackColorDataAlternate(java.awt.Color value)Assigns the alternate color for displaying the DataGrid rows or columns.voidsetBackColorHeader(java.awt.Color value)Sets the background color of the header for the data grid.voidsetContentLayout(ContentLayout value)Allows you to align the data grid in the bottom of the chart area.voidsetFont(java.awt.Font value)Allows you to set the font used throughout the data grid.voidsetHideXValues(boolean value)Used to hide the XValues in the data grid of an XY plot chart.voidsetHorizontalGridColor(java.awt.Color value)Allows you to set the Horizontal color for the gridlines displayed in the data grid.voidsetInterlaced(Interlaced value)Alternates the background color of on the data grid to improve readability.voidsetMaxSizePercentage(short value)Allows you to specify the maximum percentage of the chart area the data grid may occupy.voidsetReadOnly(boolean value)Permits values to be changed through the data grid.voidsetScrollPosition(int value)Scrolls the data horizontally to the specific column in the Grid.voidsetShowHeader(boolean value)Gets or sets a value indicating the header of the columns should be visible or not.voidsetShowHiddenSeries(boolean value)Gets or sets a value indicating hidden series should be visible in data grid.voidsetShowMarkers(boolean value)Gets or sets a value indicating whether series markers should be visible in the series headers.voidsetTextColorData(java.awt.Color value)Sets the text color of the cells on the data grid.voidsetTextColorDataAlternate(java.awt.Color value)Sets the alternate text color for text in the data grid cells.voidsetTextColorHeader(java.awt.Color value)Gets or sets the text color of the headers on the data grid.voidsetUseRawData(boolean value)Gets or sets a value indicating whether to use raw data or use calculated values in the data grid.voidsetVerticalGridColor(java.awt.Color value)Allows you to select the Vertical line color for the gridline displayed at the data grid box.voidsetXValuesAsHeaders(boolean value)Gets or sets a value instructing that XValues be used as the headers in the data grid.-
Methods inherited from class com.softwarefx.chartfx.server.DockableBar
addVisibleChangedListener, getBackColor, getBorder, getDock, getHeight, getWidth, getZOrder, isAutoSize, isVisible, removeVisibleChangedListener, resetAutoSize, resetBackColor, resetBorder, resetDock, resetHeight, resetVisible, resetWidth, resetZOrder, setAutoSize, setBackColor, setBorder, setDock, setHeight, setVisible, setWidth, setZOrder
-
-
-
-
Method Detail
-
getBackColorData
public java.awt.Color getBackColorData()
Sets the background color of the cells on the data grid.
You need to have the data grid visible in order to see the changes made with BackColorData method. Use
isVisiblemethod to enable the data grid.For more information regarding the Color type, please refer to the Documentation.
Named color are supported (e.g. Red), to use Hex notation you have to use quotes (e.g. "#FF00FF").
To change the color of data grid cells to LightBlue:
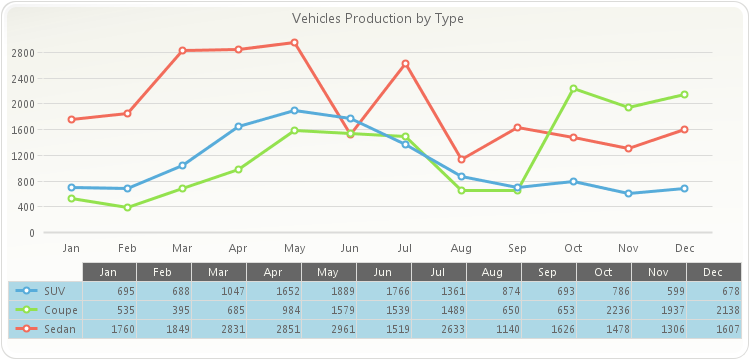
chart1.getDataGrid().setVisible(true);
chart1.getDataGrid().setBackColorData(new java.awt.Color(173,216,230,255));
chart1.getLegendBox().setVisible(false);
PopulateCarProduction(chart1);
chart1.getTitles().add(new TitleDockable("Vehicles Production by Type"));
public static void PopulateCarProduction(Chart chart1) { CarProduction[] production = new CarProduction[] { new CarProduction("Jan", 1760, 535, 695 ) , new CarProduction("Feb", 1849, 395, 688 ) , new CarProduction("Mar", 2831, 685, 1047 ) , new CarProduction("Apr", 2851, 984, 1652 ) , new CarProduction("May", 2961, 1579, 1889 ) , new CarProduction("Jun", 1519, 1539, 1766 ) , new CarProduction("Jul", 2633, 1489, 1361 ) , new CarProduction("Aug", 1140, 650, 874 ) , new CarProduction("Sep", 1626, 653, 693 ) , new CarProduction("Oct", 1478, 2236, 786 ) , new CarProduction("Nov", 1306, 1937, 599 ) , new CarProduction("Dec", 1607, 2138, 678 ) }; ObjectProvider objProvider = new ObjectProvider(production); chart1.getDataSourceSettings().setDataSource(objProvider); }public static class CarProduction { private CarProduction(String month, int sedan, int coupe, int SUV) { this.setMonth(month); this.setSedan(sedan); this.setCoupe(coupe); this.setSUV(SUV); } private String privateMonth; public final String getMonth() { return privateMonth; } public final void setMonth(String value) { privateMonth = value; } private int privateSedan; public final int getSedan() { return privateSedan; } public final void setSedan(int value) { privateSedan = value; } private int privateCoupe; public final int getCoupe() { return privateCoupe; } public final void setCoupe(int value) { privateCoupe = value; } private int privateSUV; public final int getSUV() { return privateSUV; } public final void setSUV(int value) { privateSUV = value; } }
- See Also:
resetBackColorData
-
setBackColorData
public void setBackColorData(java.awt.Color value)
Sets the background color of the cells on the data grid.
You need to have the data grid visible in order to see the changes made with BackColorData method. Use
isVisiblemethod to enable the data grid.For more information regarding the Color type, please refer to the Documentation.
Named color are supported (e.g. Red), to use Hex notation you have to use quotes (e.g. "#FF00FF").
To change the color of data grid cells to LightBlue:
chart1.getDataGrid().setVisible(true);
chart1.getDataGrid().setBackColorData(new java.awt.Color(173,216,230,255));
chart1.getLegendBox().setVisible(false);
PopulateCarProduction(chart1);
chart1.getTitles().add(new TitleDockable("Vehicles Production by Type"));
public static void PopulateCarProduction(Chart chart1) { CarProduction[] production = new CarProduction[] { new CarProduction("Jan", 1760, 535, 695 ) , new CarProduction("Feb", 1849, 395, 688 ) , new CarProduction("Mar", 2831, 685, 1047 ) , new CarProduction("Apr", 2851, 984, 1652 ) , new CarProduction("May", 2961, 1579, 1889 ) , new CarProduction("Jun", 1519, 1539, 1766 ) , new CarProduction("Jul", 2633, 1489, 1361 ) , new CarProduction("Aug", 1140, 650, 874 ) , new CarProduction("Sep", 1626, 653, 693 ) , new CarProduction("Oct", 1478, 2236, 786 ) , new CarProduction("Nov", 1306, 1937, 599 ) , new CarProduction("Dec", 1607, 2138, 678 ) }; ObjectProvider objProvider = new ObjectProvider(production); chart1.getDataSourceSettings().setDataSource(objProvider); }public static class CarProduction { private CarProduction(String month, int sedan, int coupe, int SUV) { this.setMonth(month); this.setSedan(sedan); this.setCoupe(coupe); this.setSUV(SUV); } private String privateMonth; public final String getMonth() { return privateMonth; } public final void setMonth(String value) { privateMonth = value; } private int privateSedan; public final int getSedan() { return privateSedan; } public final void setSedan(int value) { privateSedan = value; } private int privateCoupe; public final int getCoupe() { return privateCoupe; } public final void setCoupe(int value) { privateCoupe = value; } private int privateSUV; public final int getSUV() { return privateSUV; } public final void setSUV(int value) { privateSUV = value; } }
- Parameters:
value-- See Also:
resetBackColorData
-
getBackColorDataAlternate
public java.awt.Color getBackColorDataAlternate()
Assigns the alternate color for displaying the DataGrid rows or columns.
When viewing and interpreting DataGrids with muliple points or series, sometimes it is difficult to distinguish one row from another or one column from the other. With this method you can specify the alternating color for the DataGrid.
You should specify the direction of the alternating colors by using the
setInterlacedmethod.Named color are supported (e.g. Red), to use Hex notation you have to use quotes (e.g. "#FF00FF").
For more information regarding the Color type, please refer to the Documentation.
To set the alternate color for an interlaced data grid.
chart1.getDataGrid().setInterlaced(Interlaced.HORIZONTAL);
chart1.getDataGrid().setBackColorDataAlternate(new java.awt.Color(255,0,0,255));
- See Also:
resetBackColorDataAlternate
-
setBackColorDataAlternate
public void setBackColorDataAlternate(java.awt.Color value)
Assigns the alternate color for displaying the DataGrid rows or columns.
When viewing and interpreting DataGrids with muliple points or series, sometimes it is difficult to distinguish one row from another or one column from the other. With this method you can specify the alternating color for the DataGrid.
You should specify the direction of the alternating colors by using the
setInterlacedmethod.Named color are supported (e.g. Red), to use Hex notation you have to use quotes (e.g. "#FF00FF").
For more information regarding the Color type, please refer to the Documentation.
To set the alternate color for an interlaced data grid.
chart1.getDataGrid().setInterlaced(Interlaced.HORIZONTAL);
chart1.getDataGrid().setBackColorDataAlternate(new java.awt.Color(255,0,0,255));
- Parameters:
value-- See Also:
resetBackColorDataAlternate
-
getBackColorHeader
public java.awt.Color getBackColorHeader()
Sets the background color of the header for the data grid.
You need to have the data grid visible in order to see the changes made with BackColorHeader method. Use
isVisiblemethod to enable the data grid.You can set the data grid background and data grid cells background with
setBackColorandsetBackColorDatamethod, respectively.For more information regarding the Color type, please refer to the Java Documentation.
Named color are supported (e.g. Red), to use Hex notation you have to use quotes (e.g. "#FF00FF").
Below, the data grid BackColorHeader is set to LightBlue:
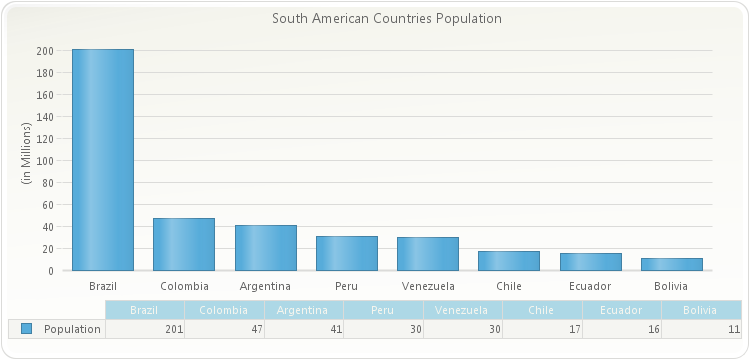
chart1.getDataGrid().setVisible(true);
chart1.getDataGrid().setBackColorHeader(new java.awt.Color(173,216,230,255));
chart1.getLegendBox().setVisible(false);
PopulateSouthAmericaPopulation(chart1);
chart1.setGallery(Gallery.BAR);
chart1.getLegendBox().setVisible(false);
chart1.getTitles().add(new TitleDockable("South American Countries Population"));
chart1.getAxisY().setScaleUnit(1000000);
chart1.getAxisY().getTitle().setText("(in Millions)");
public static void PopulateSouthAmericaPopulation(Chart chart1) { SouthAmericaPopulation[] data = new SouthAmericaPopulation[]{ new SouthAmericaPopulation("Brazil", 201033000), new SouthAmericaPopulation("Colombia", 47130000), new SouthAmericaPopulation("Argentina", 41350000), new SouthAmericaPopulation("Peru", 30476000), new SouthAmericaPopulation("Venezuela", 29760000), new SouthAmericaPopulation("Chile", 16841000), new SouthAmericaPopulation("Ecuador", 15779000), new SouthAmericaPopulation("Bolivia", 10517000) }; ObjectProvider objProvider = new ObjectProvider(data); chart1.getDataSourceSettings().setDataSource(objProvider); }public static class SouthAmericaPopulation { public SouthAmericaPopulation(String country, double population) { this.setCountry(country); this.setPopulation(population); } private String privateCountry; public final String getCountry() { return privateCountry; } public final void setCountry(String value) { privateCountry = value; } private double privatePopulation; public final double getPopulation() { return privatePopulation; } public final void setPopulation(double value) { privatePopulation = value; } }public static class Countries { public Countries(String country, double lei, double gdppc, java.awt.Image flag) { this.setCountry(country); this.setLEI(lei); this.setGDPPC(gdppc); this.setFlag(flag); } private String privateCountry; public final String getCountry() { return privateCountry; } public final void setCountry(String value) { privateCountry = value; } private double privateLEI; public final double getLEI() { return privateLEI; } public final void setLEI(double value) { privateLEI = value; } private double privateGDPPC; public final double getGDPPC() { return privateGDPPC; } public final void setGDPPC(double value) { privateGDPPC = value; } private java.awt.Image privateFlag; public final java.awt.Image getFlag() { return privateFlag; } public final void setFlag(java.awt.Image value) { privateFlag = value; } }
- See Also:
resetBackColorHeader
-
setBackColorHeader
public void setBackColorHeader(java.awt.Color value)
Sets the background color of the header for the data grid.
You need to have the data grid visible in order to see the changes made with BackColorHeader method. Use
isVisiblemethod to enable the data grid.You can set the data grid background and data grid cells background with
setBackColorandsetBackColorDatamethod, respectively.For more information regarding the Color type, please refer to the Java Documentation.
Named color are supported (e.g. Red), to use Hex notation you have to use quotes (e.g. "#FF00FF").
Below, the data grid BackColorHeader is set to LightBlue:
chart1.getDataGrid().setVisible(true);
chart1.getDataGrid().setBackColorHeader(new java.awt.Color(173,216,230,255));
chart1.getLegendBox().setVisible(false);
PopulateSouthAmericaPopulation(chart1);
chart1.setGallery(Gallery.BAR);
chart1.getLegendBox().setVisible(false);
chart1.getTitles().add(new TitleDockable("South American Countries Population"));
chart1.getAxisY().setScaleUnit(1000000);
chart1.getAxisY().getTitle().setText("(in Millions)");
public static void PopulateSouthAmericaPopulation(Chart chart1) { SouthAmericaPopulation[] data = new SouthAmericaPopulation[]{ new SouthAmericaPopulation("Brazil", 201033000), new SouthAmericaPopulation("Colombia", 47130000), new SouthAmericaPopulation("Argentina", 41350000), new SouthAmericaPopulation("Peru", 30476000), new SouthAmericaPopulation("Venezuela", 29760000), new SouthAmericaPopulation("Chile", 16841000), new SouthAmericaPopulation("Ecuador", 15779000), new SouthAmericaPopulation("Bolivia", 10517000) }; ObjectProvider objProvider = new ObjectProvider(data); chart1.getDataSourceSettings().setDataSource(objProvider); }public static class SouthAmericaPopulation { public SouthAmericaPopulation(String country, double population) { this.setCountry(country); this.setPopulation(population); } private String privateCountry; public final String getCountry() { return privateCountry; } public final void setCountry(String value) { privateCountry = value; } private double privatePopulation; public final double getPopulation() { return privatePopulation; } public final void setPopulation(double value) { privatePopulation = value; } }public static class Countries { public Countries(String country, double lei, double gdppc, java.awt.Image flag) { this.setCountry(country); this.setLEI(lei); this.setGDPPC(gdppc); this.setFlag(flag); } private String privateCountry; public final String getCountry() { return privateCountry; } public final void setCountry(String value) { privateCountry = value; } private double privateLEI; public final double getLEI() { return privateLEI; } public final void setLEI(double value) { privateLEI = value; } private double privateGDPPC; public final double getGDPPC() { return privateGDPPC; } public final void setGDPPC(double value) { privateGDPPC = value; } private java.awt.Image privateFlag; public final java.awt.Image getFlag() { return privateFlag; } public final void setFlag(java.awt.Image value) { privateFlag = value; } }
- Parameters:
value-- See Also:
resetBackColorHeader
-
getCells
public CellAttributesCollection getCells()
Gets the collection of CellAttributes that belong to the DataGrid.
-
getContentLayout
public ContentLayout getContentLayout()
Allows you to align the data grid in the bottom of the chart area.
The
isVisiblemethod needs to be true to see the effects of this method.Note, when the Data Grid is docked on the left or right:
Near = Top
Far = Bottom
To center the data grid under the chart:
chart1.getDataGrid().setContentLayout(ContentLayout.CENTER);
- See Also:
resetContentLayout
-
setContentLayout
public void setContentLayout(ContentLayout value)
Allows you to align the data grid in the bottom of the chart area.
The
isVisiblemethod needs to be true to see the effects of this method.Note, when the Data Grid is docked on the left or right:
Near = Top
Far = Bottom
To center the data grid under the chart:
chart1.getDataGrid().setContentLayout(ContentLayout.CENTER);
- Parameters:
value-- See Also:
resetContentLayout
-
getFont
public java.awt.Font getFont()
Allows you to set the font used throughout the data grid.
You can set the font for the entire chart using the
ChartobjectsetChartFontmethod.For more information regarding the Font type, please refer to the Documentation.
Below, the data grid font is set to Arial 10:
chart1.getDataGrid().setVisible(true);
chart1.getDataGrid().setChartFont(new java.awt.Font("Arial",java.awt.Font.PLAIN, 10));
chart1.getLegendBox().setVisible(false);
PopulateCarProduction(chart1);
chart1.getTitles().add(new TitleDockable("Vehicles Production by Type"));
public static void PopulateCarProduction(Chart chart1) { CarProduction[] production = new CarProduction[] { new CarProduction("Jan", 1760, 535, 695 ) , new CarProduction("Feb", 1849, 395, 688 ) , new CarProduction("Mar", 2831, 685, 1047 ) , new CarProduction("Apr", 2851, 984, 1652 ) , new CarProduction("May", 2961, 1579, 1889 ) , new CarProduction("Jun", 1519, 1539, 1766 ) , new CarProduction("Jul", 2633, 1489, 1361 ) , new CarProduction("Aug", 1140, 650, 874 ) , new CarProduction("Sep", 1626, 653, 693 ) , new CarProduction("Oct", 1478, 2236, 786 ) , new CarProduction("Nov", 1306, 1937, 599 ) , new CarProduction("Dec", 1607, 2138, 678 ) }; ObjectProvider objProvider = new ObjectProvider(production); chart1.getDataSourceSettings().setDataSource(objProvider); }public static class CarProduction { private CarProduction(String month, int sedan, int coupe, int SUV) { this.setMonth(month); this.setSedan(sedan); this.setCoupe(coupe); this.setSUV(SUV); } private String privateMonth; public final String getMonth() { return privateMonth; } public final void setMonth(String value) { privateMonth = value; } private int privateSedan; public final int getSedan() { return privateSedan; } public final void setSedan(int value) { privateSedan = value; } private int privateCoupe; public final int getCoupe() { return privateCoupe; } public final void setCoupe(int value) { privateCoupe = value; } private int privateSUV; public final int getSUV() { return privateSUV; } public final void setSUV(int value) { privateSUV = value; } }
- See Also:
resetFont
-
setFont
public void setFont(java.awt.Font value)
Allows you to set the font used throughout the data grid.
You can set the font for the entire chart using the
ChartobjectsetChartFontmethod.For more information regarding the Font type, please refer to the Documentation.
Below, the data grid font is set to Arial 10:
chart1.getDataGrid().setVisible(true);
chart1.getDataGrid().setChartFont(new java.awt.Font("Arial",java.awt.Font.PLAIN, 10));
chart1.getLegendBox().setVisible(false);
PopulateCarProduction(chart1);
chart1.getTitles().add(new TitleDockable("Vehicles Production by Type"));
public static void PopulateCarProduction(Chart chart1) { CarProduction[] production = new CarProduction[] { new CarProduction("Jan", 1760, 535, 695 ) , new CarProduction("Feb", 1849, 395, 688 ) , new CarProduction("Mar", 2831, 685, 1047 ) , new CarProduction("Apr", 2851, 984, 1652 ) , new CarProduction("May", 2961, 1579, 1889 ) , new CarProduction("Jun", 1519, 1539, 1766 ) , new CarProduction("Jul", 2633, 1489, 1361 ) , new CarProduction("Aug", 1140, 650, 874 ) , new CarProduction("Sep", 1626, 653, 693 ) , new CarProduction("Oct", 1478, 2236, 786 ) , new CarProduction("Nov", 1306, 1937, 599 ) , new CarProduction("Dec", 1607, 2138, 678 ) }; ObjectProvider objProvider = new ObjectProvider(production); chart1.getDataSourceSettings().setDataSource(objProvider); }public static class CarProduction { private CarProduction(String month, int sedan, int coupe, int SUV) { this.setMonth(month); this.setSedan(sedan); this.setCoupe(coupe); this.setSUV(SUV); } private String privateMonth; public final String getMonth() { return privateMonth; } public final void setMonth(String value) { privateMonth = value; } private int privateSedan; public final int getSedan() { return privateSedan; } public final void setSedan(int value) { privateSedan = value; } private int privateCoupe; public final int getCoupe() { return privateCoupe; } public final void setCoupe(int value) { privateCoupe = value; } private int privateSUV; public final int getSUV() { return privateSUV; } public final void setSUV(int value) { privateSUV = value; } }
- Parameters:
value-- See Also:
resetFont
-
isHideXValues
public boolean isHideXValues()
Used to hide the XValues in the data grid of an XY plot chart.
Normally when you generate an XY plot, both the X and Y values for each series are displayed in the data grid. This method allows you to hide the XValues displayed by the tool.
To hide the XValues in the data grid of an XY plot:
chart1.getDataGrid().setHideXValues(true);
- See Also:
resetHideXValues
-
setHideXValues
public void setHideXValues(boolean value)
Used to hide the XValues in the data grid of an XY plot chart.
Normally when you generate an XY plot, both the X and Y values for each series are displayed in the data grid. This method allows you to hide the XValues displayed by the tool.
To hide the XValues in the data grid of an XY plot:
chart1.getDataGrid().setHideXValues(true);
- Parameters:
value-- See Also:
resetHideXValues
-
getHighlight
public HighlightDataGridAttributes getHighlight()
Returns a HighlightDataGridAttributes object for the DataGrid.chart1.getDataGrid().getHighlight().setColor(new java.awt.Color(255,0,0,255));
-
getHorizontalGridColor
public java.awt.Color getHorizontalGridColor()
Allows you to set the Horizontal color for the gridlines displayed in the data grid.
The data grid must be
isVisiblein order to see the these changes.You can set the Vertical line color of the data grid gridline with
setVerticalGridColormethod.For more information regarding the Color type, please refer to the Documentation.
Named color are supported (e.g. Red), to use Hex notation you have to use quotes (e.g. "#FF00FF").
Below, the data grid horizontal and vertical grid color is set to Red:
chart1.getDataGrid().setVisible(true);
chart1.getDataGrid().setHorizontalGridColor(new java.awt.Color(255,0,0,255));
chart1.getLegendBox().setVisible(false);
chart1.setGallery(Gallery.BAR);
PopulateBirthVariation(chart1);
chart1.getTitles().add(new TitleDockable("Population Birth Variation"));
public static void PopulateBirthVariation(Chart chart1) { BirthVariation[] variations = new BirthVariation[] { new BirthVariation("2007", 4.5, 4.9 ), new BirthVariation("2008", -1.8, 1.2 ), new BirthVariation("2009", 2.3, -2.6 ), new BirthVariation("2010", 2.0, 3.0), new BirthVariation("2011", -0.5, -1.7 ), new BirthVariation("2012", 3.1, -0.9 ) }; ObjectProvider objProvider = new ObjectProvider(variations); chart1.getDataSourceSettings().setDataSource(objProvider); }public static class BirthVariation { public BirthVariation(String year, double male, double female) { this.setYear(year); this.setMale(male); this.setFemale(female); } private String privateYear; public final String getYear() { return privateYear; } public final void setYear(String value) { privateYear = value; } private double privateMale; public final double getMale() { return privateMale; } public final void setMale(double value) { privateMale = value; } private double privateFemale; public final double getFemale() { return privateFemale; } public final void setFemale(double value) { privateFemale = value; } }
- See Also:
resetHorizontalGridColor
-
setHorizontalGridColor
public void setHorizontalGridColor(java.awt.Color value)
Allows you to set the Horizontal color for the gridlines displayed in the data grid.
The data grid must be
isVisiblein order to see the these changes.You can set the Vertical line color of the data grid gridline with
setVerticalGridColormethod.For more information regarding the Color type, please refer to the Documentation.
Named color are supported (e.g. Red), to use Hex notation you have to use quotes (e.g. "#FF00FF").
Below, the data grid horizontal and vertical grid color is set to Red:
chart1.getDataGrid().setVisible(true);
chart1.getDataGrid().setHorizontalGridColor(new java.awt.Color(255,0,0,255));
chart1.getLegendBox().setVisible(false);
chart1.setGallery(Gallery.BAR);
PopulateBirthVariation(chart1);
chart1.getTitles().add(new TitleDockable("Population Birth Variation"));
public static void PopulateBirthVariation(Chart chart1) { BirthVariation[] variations = new BirthVariation[] { new BirthVariation("2007", 4.5, 4.9 ), new BirthVariation("2008", -1.8, 1.2 ), new BirthVariation("2009", 2.3, -2.6 ), new BirthVariation("2010", 2.0, 3.0), new BirthVariation("2011", -0.5, -1.7 ), new BirthVariation("2012", 3.1, -0.9 ) }; ObjectProvider objProvider = new ObjectProvider(variations); chart1.getDataSourceSettings().setDataSource(objProvider); }public static class BirthVariation { public BirthVariation(String year, double male, double female) { this.setYear(year); this.setMale(male); this.setFemale(female); } private String privateYear; public final String getYear() { return privateYear; } public final void setYear(String value) { privateYear = value; } private double privateMale; public final double getMale() { return privateMale; } public final void setMale(double value) { privateMale = value; } private double privateFemale; public final double getFemale() { return privateFemale; } public final void setFemale(double value) { privateFemale = value; } }
- Parameters:
value-- See Also:
resetHorizontalGridColor
-
getInterlaced
public Interlaced getInterlaced()
Alternates the background color of on the data grid to improve readability.
If you want to alternate the color for every series, then use Interlaced.Horizontal. For alternating the color of the points, use Interlaced.Vertical.
With only a few series and points it is easier to read without Interlaced.
Use the
setBackColorDataandsetBackColorDataAlternatemethods to set the colors for the Interlaced method.Below, the data grid
setInterlacedmethod is set to Interlaced.Horizontal:chart1.getDataGrid().setVisible(true); chart1.getDataGrid().setBackColorDataAlternate(new java.awt.Color(173,216,230,255)); chart1.getDataGrid().setInterlaced(Interlaced.HORIZONTAL); chart1.getLegendBox().setVisible(false); PopulateCarProduction(chart1); chart1.getTitles().add(new TitleDockable("Vehicles Production by Type"));public static void PopulateCarProduction(Chart chart1) { CarProduction[] production = new CarProduction[] { new CarProduction("Jan", 1760, 535, 695 ) , new CarProduction("Feb", 1849, 395, 688 ) , new CarProduction("Mar", 2831, 685, 1047 ) , new CarProduction("Apr", 2851, 984, 1652 ) , new CarProduction("May", 2961, 1579, 1889 ) , new CarProduction("Jun", 1519, 1539, 1766 ) , new CarProduction("Jul", 2633, 1489, 1361 ) , new CarProduction("Aug", 1140, 650, 874 ) , new CarProduction("Sep", 1626, 653, 693 ) , new CarProduction("Oct", 1478, 2236, 786 ) , new CarProduction("Nov", 1306, 1937, 599 ) , new CarProduction("Dec", 1607, 2138, 678 ) }; ObjectProvider objProvider = new ObjectProvider(production); chart1.getDataSourceSettings().setDataSource(objProvider); }public static class CarProduction { private CarProduction(String month, int sedan, int coupe, int SUV) { this.setMonth(month); this.setSedan(sedan); this.setCoupe(coupe); this.setSUV(SUV); } private String privateMonth; public final String getMonth() { return privateMonth; } public final void setMonth(String value) { privateMonth = value; } private int privateSedan; public final int getSedan() { return privateSedan; } public final void setSedan(int value) { privateSedan = value; } private int privateCoupe; public final int getCoupe() { return privateCoupe; } public final void setCoupe(int value) { privateCoupe = value; } private int privateSUV; public final int getSUV() { return privateSUV; } public final void setSUV(int value) { privateSUV = value; } }
- See Also:
resetInterlaced
-
setInterlaced
public void setInterlaced(Interlaced value)
Alternates the background color of on the data grid to improve readability.
If you want to alternate the color for every series, then use Interlaced.Horizontal. For alternating the color of the points, use Interlaced.Vertical.
With only a few series and points it is easier to read without Interlaced.
Use the
setBackColorDataandsetBackColorDataAlternatemethods to set the colors for the Interlaced method.Below, the data grid
setInterlacedmethod is set to Interlaced.Horizontal:chart1.getDataGrid().setVisible(true); chart1.getDataGrid().setBackColorDataAlternate(new java.awt.Color(173,216,230,255)); chart1.getDataGrid().setInterlaced(Interlaced.HORIZONTAL); chart1.getLegendBox().setVisible(false); PopulateCarProduction(chart1); chart1.getTitles().add(new TitleDockable("Vehicles Production by Type"));public static void PopulateCarProduction(Chart chart1) { CarProduction[] production = new CarProduction[] { new CarProduction("Jan", 1760, 535, 695 ) , new CarProduction("Feb", 1849, 395, 688 ) , new CarProduction("Mar", 2831, 685, 1047 ) , new CarProduction("Apr", 2851, 984, 1652 ) , new CarProduction("May", 2961, 1579, 1889 ) , new CarProduction("Jun", 1519, 1539, 1766 ) , new CarProduction("Jul", 2633, 1489, 1361 ) , new CarProduction("Aug", 1140, 650, 874 ) , new CarProduction("Sep", 1626, 653, 693 ) , new CarProduction("Oct", 1478, 2236, 786 ) , new CarProduction("Nov", 1306, 1937, 599 ) , new CarProduction("Dec", 1607, 2138, 678 ) }; ObjectProvider objProvider = new ObjectProvider(production); chart1.getDataSourceSettings().setDataSource(objProvider); }public static class CarProduction { private CarProduction(String month, int sedan, int coupe, int SUV) { this.setMonth(month); this.setSedan(sedan); this.setCoupe(coupe); this.setSUV(SUV); } private String privateMonth; public final String getMonth() { return privateMonth; } public final void setMonth(String value) { privateMonth = value; } private int privateSedan; public final int getSedan() { return privateSedan; } public final void setSedan(int value) { privateSedan = value; } private int privateCoupe; public final int getCoupe() { return privateCoupe; } public final void setCoupe(int value) { privateCoupe = value; } private int privateSUV; public final int getSUV() { return privateSUV; } public final void setSUV(int value) { privateSUV = value; } }
- Parameters:
value-- See Also:
resetInterlaced
-
getMaxSizePercentage
public short getMaxSizePercentage()
Allows you to specify the maximum percentage of the chart area the data grid may occupy.
This method is especially useful when developing with web applications and generating images. Because you cannot scroll the data grid when generating an image, this method allows you to specify the max size so you can make sure to view all values in the data grid.
This method may be configured with values ranging from 0 - 100. Specifying 0 will instruct Chart FX to calculate the size. Specifying 100 will instruct Chart FX that the whole chart may be covered by the data grid if needed.
To set the MaxSizePercentage to 35%:
chart1.getDataGrid().setMaxSizePercentage((short)35);
- See Also:
resetMaxSizePercentage
-
setMaxSizePercentage
public void setMaxSizePercentage(short value)
Allows you to specify the maximum percentage of the chart area the data grid may occupy.
This method is especially useful when developing with web applications and generating images. Because you cannot scroll the data grid when generating an image, this method allows you to specify the max size so you can make sure to view all values in the data grid.
This method may be configured with values ranging from 0 - 100. Specifying 0 will instruct Chart FX to calculate the size. Specifying 100 will instruct Chart FX that the whole chart may be covered by the data grid if needed.
To set the MaxSizePercentage to 35%:
chart1.getDataGrid().setMaxSizePercentage((short)35);
- Parameters:
value-- See Also:
resetMaxSizePercentage
-
isReadOnly
public boolean isReadOnly()
Permits values to be changed through the data grid.chart1.getDataGrid().setReadOnly(true);
- See Also:
resetReadOnly
-
setReadOnly
public void setReadOnly(boolean value)
Permits values to be changed through the data grid.chart1.getDataGrid().setReadOnly(true);
- Parameters:
value-- See Also:
resetReadOnly
-
getScrollPosition
public int getScrollPosition()
Scrolls the data horizontally to the specific column in the Grid.
This applies only when the data grid is docked to the Bottom or Top.
To set the data grid scroll position to 2:
chart1.getDataGrid().setScrollPosition(2);
-
setScrollPosition
public void setScrollPosition(int value)
Scrolls the data horizontally to the specific column in the Grid.
This applies only when the data grid is docked to the Bottom or Top.
To set the data grid scroll position to 2:
chart1.getDataGrid().setScrollPosition(2);
- Parameters:
value-
-
getScrollSize
public int getScrollSize()
Returns the number of scrolls in the data grid based on the scroll view configuration.
int sSize;
sSize = chart1.getDataGrid().getScrollSize();
-
isShowHeader
public boolean isShowHeader()
Gets or sets a value indicating the header of the columns should be visible or not.
The
isShowMarkersmethod shows or hides the series indicator displayed on the side of the data grid.You may modify the color of the header using the
setBackColorHeadermethod.Hide the data grid header:
chart1.getDataGrid().setShowHeader(false);
- See Also:
resetShowHeader
-
setShowHeader
public void setShowHeader(boolean value)
Gets or sets a value indicating the header of the columns should be visible or not.
The
isShowMarkersmethod shows or hides the series indicator displayed on the side of the data grid.You may modify the color of the header using the
setBackColorHeadermethod.Hide the data grid header:
chart1.getDataGrid().setShowHeader(false);
- Parameters:
value-- See Also:
resetShowHeader
-
isShowHiddenSeries
public boolean isShowHiddenSeries()
Gets or sets a value indicating hidden series should be visible in data grid.
A series can be marked hidden by setting the
isVisiblemethod of theDataGridclass, however you may want to still show this series in the data grid using this method.To show hidden series in the data grid:
chart1.getDataGrid().setShowHiddenSeries(true);
- See Also:
resetShowHiddenSeries
-
setShowHiddenSeries
public void setShowHiddenSeries(boolean value)
Gets or sets a value indicating hidden series should be visible in data grid.
A series can be marked hidden by setting the
isVisiblemethod of theDataGridclass, however you may want to still show this series in the data grid using this method.To show hidden series in the data grid:
chart1.getDataGrid().setShowHiddenSeries(true);
- Parameters:
value-- See Also:
resetShowHiddenSeries
-
isShowMarkers
public boolean isShowMarkers()
Gets or sets a value indicating whether series markers should be visible in the series headers.
When the marker is hidden, only text is shown to label the series.
The
isShowHeadermethod may be used to show or hide the data grid header.To remove the markers from the data grid:
chart1.getDataGrid().setShowMarkers(false);
- See Also:
resetShowMarkers
-
setShowMarkers
public void setShowMarkers(boolean value)
Gets or sets a value indicating whether series markers should be visible in the series headers.
When the marker is hidden, only text is shown to label the series.
The
isShowHeadermethod may be used to show or hide the data grid header.To remove the markers from the data grid:
chart1.getDataGrid().setShowMarkers(false);
- Parameters:
value-- See Also:
resetShowMarkers
-
getTextColorData
public java.awt.Color getTextColorData()
Sets the text color of the cells on the data grid.
This method does not change the color of the header text, you can set the header text color of the data grid with
setTextColorHeadermethod.For more information regarding the Color type, please refer to the Java Documentation.
To change the text color of data grid cells to Blue:
chart1.getDataGrid().setTextColorData(new java.awt.Color(0,0,255,255));
- See Also:
resetTextColorData
-
setTextColorData
public void setTextColorData(java.awt.Color value)
Sets the text color of the cells on the data grid.
This method does not change the color of the header text, you can set the header text color of the data grid with
setTextColorHeadermethod.For more information regarding the Color type, please refer to the Java Documentation.
To change the text color of data grid cells to Blue:
chart1.getDataGrid().setTextColorData(new java.awt.Color(0,0,255,255));
- Parameters:
value-- See Also:
resetTextColorData
-
getTextColorDataAlternate
public java.awt.Color getTextColorDataAlternate()
Sets the alternate text color for text in the data grid cells.
This method is useful when the
setInterlacedmethod is used.The initial color of the text in the dataGrid cells can be set using the
setTextColorDatamethod.For more information regarding the Color type, please refer to the Documentation.
Set the alternate text color for the data grid to red:
chart1.getDataGrid().setInterlaced(Interlaced.HORIZONTAL);
chart1.getDataGrid().setTextColorDataAlternate(new java.awt.Color(255,0,0,255));
- See Also:
resetTextColorDataAlternate
-
setTextColorDataAlternate
public void setTextColorDataAlternate(java.awt.Color value)
Sets the alternate text color for text in the data grid cells.
This method is useful when the
setInterlacedmethod is used.The initial color of the text in the dataGrid cells can be set using the
setTextColorDatamethod.For more information regarding the Color type, please refer to the Documentation.
Set the alternate text color for the data grid to red:
chart1.getDataGrid().setInterlaced(Interlaced.HORIZONTAL);
chart1.getDataGrid().setTextColorDataAlternate(new java.awt.Color(255,0,0,255));
- Parameters:
value-- See Also:
resetTextColorDataAlternate
-
getTextColorHeader
public java.awt.Color getTextColorHeader()
Gets or sets the text color of the headers on the data grid.
You need to have the dataGrid visible in order to see the changes. Use
isVisiblemethod to enable the data grid.You can set the other cells text color of the data grid with
setTextColorDatamethod.You can change the color of a specific cell by using
setBackColormethodFor more information regarding the Color type, please refer to the Documentation.
Below, the data grid header text color is set to LightBlue:
chart1.getDataGrid().setVisible(true);
chart1.getDataGrid().setTextColorHeader(new java.awt.Color(173,216,230,255));
chart1.getLegendBox().setVisible(false);
PopulateSouthAmericaPopulation(chart1);
chart1.setGallery(Gallery.BAR);
chart1.getLegendBox().setVisible(false);
chart1.getTitles().add(new TitleDockable("South American Countries Population"));
chart1.getAxisY().setScaleUnit(1000000);
chart1.getAxisY().getTitle().setText("(in Millions)");
public static void PopulateSouthAmericaPopulation(Chart chart1) { SouthAmericaPopulation[] data = new SouthAmericaPopulation[]{ new SouthAmericaPopulation("Brazil", 201033000), new SouthAmericaPopulation("Colombia", 47130000), new SouthAmericaPopulation("Argentina", 41350000), new SouthAmericaPopulation("Peru", 30476000), new SouthAmericaPopulation("Venezuela", 29760000), new SouthAmericaPopulation("Chile", 16841000), new SouthAmericaPopulation("Ecuador", 15779000), new SouthAmericaPopulation("Bolivia", 10517000) }; ObjectProvider objProvider = new ObjectProvider(data); chart1.getDataSourceSettings().setDataSource(objProvider); }public static class SouthAmericaPopulation { public SouthAmericaPopulation(String country, double population) { this.setCountry(country); this.setPopulation(population); } private String privateCountry; public final String getCountry() { return privateCountry; } public final void setCountry(String value) { privateCountry = value; } private double privatePopulation; public final double getPopulation() { return privatePopulation; } public final void setPopulation(double value) { privatePopulation = value; } }public static class Countries { public Countries(String country, double lei, double gdppc, java.awt.Image flag) { this.setCountry(country); this.setLEI(lei); this.setGDPPC(gdppc); this.setFlag(flag); } private String privateCountry; public final String getCountry() { return privateCountry; } public final void setCountry(String value) { privateCountry = value; } private double privateLEI; public final double getLEI() { return privateLEI; } public final void setLEI(double value) { privateLEI = value; } private double privateGDPPC; public final double getGDPPC() { return privateGDPPC; } public final void setGDPPC(double value) { privateGDPPC = value; } private java.awt.Image privateFlag; public final java.awt.Image getFlag() { return privateFlag; } public final void setFlag(java.awt.Image value) { privateFlag = value; } }
- See Also:
resetTextColorHeader
-
setTextColorHeader
public void setTextColorHeader(java.awt.Color value)
Gets or sets the text color of the headers on the data grid.
You need to have the dataGrid visible in order to see the changes. Use
isVisiblemethod to enable the data grid.You can set the other cells text color of the data grid with
setTextColorDatamethod.You can change the color of a specific cell by using
setBackColormethodFor more information regarding the Color type, please refer to the Documentation.
Below, the data grid header text color is set to LightBlue:
chart1.getDataGrid().setVisible(true);
chart1.getDataGrid().setTextColorHeader(new java.awt.Color(173,216,230,255));
chart1.getLegendBox().setVisible(false);
PopulateSouthAmericaPopulation(chart1);
chart1.setGallery(Gallery.BAR);
chart1.getLegendBox().setVisible(false);
chart1.getTitles().add(new TitleDockable("South American Countries Population"));
chart1.getAxisY().setScaleUnit(1000000);
chart1.getAxisY().getTitle().setText("(in Millions)");
public static void PopulateSouthAmericaPopulation(Chart chart1) { SouthAmericaPopulation[] data = new SouthAmericaPopulation[]{ new SouthAmericaPopulation("Brazil", 201033000), new SouthAmericaPopulation("Colombia", 47130000), new SouthAmericaPopulation("Argentina", 41350000), new SouthAmericaPopulation("Peru", 30476000), new SouthAmericaPopulation("Venezuela", 29760000), new SouthAmericaPopulation("Chile", 16841000), new SouthAmericaPopulation("Ecuador", 15779000), new SouthAmericaPopulation("Bolivia", 10517000) }; ObjectProvider objProvider = new ObjectProvider(data); chart1.getDataSourceSettings().setDataSource(objProvider); }public static class SouthAmericaPopulation { public SouthAmericaPopulation(String country, double population) { this.setCountry(country); this.setPopulation(population); } private String privateCountry; public final String getCountry() { return privateCountry; } public final void setCountry(String value) { privateCountry = value; } private double privatePopulation; public final double getPopulation() { return privatePopulation; } public final void setPopulation(double value) { privatePopulation = value; } }public static class Countries { public Countries(String country, double lei, double gdppc, java.awt.Image flag) { this.setCountry(country); this.setLEI(lei); this.setGDPPC(gdppc); this.setFlag(flag); } private String privateCountry; public final String getCountry() { return privateCountry; } public final void setCountry(String value) { privateCountry = value; } private double privateLEI; public final double getLEI() { return privateLEI; } public final void setLEI(double value) { privateLEI = value; } private double privateGDPPC; public final double getGDPPC() { return privateGDPPC; } public final void setGDPPC(double value) { privateGDPPC = value; } private java.awt.Image privateFlag; public final java.awt.Image getFlag() { return privateFlag; } public final void setFlag(java.awt.Image value) { privateFlag = value; } }
- Parameters:
value-- See Also:
resetTextColorHeader
-
isUseRawData
public boolean isUseRawData()
Gets or sets a value indicating whether to use raw data or use calculated values in the data grid.
Some gallery types, such as the BoxPlot and Histogram, manipulate data values displayed in the data grid. If you would like to actually see the data passed to the chart, you can set this method to true. This method will not affect all gallery types.
To configure the data grid to use raw data:
chart1.getDataGrid().setUseRawData(true);
- See Also:
resetUseRawData
-
setUseRawData
public void setUseRawData(boolean value)
Gets or sets a value indicating whether to use raw data or use calculated values in the data grid.
Some gallery types, such as the BoxPlot and Histogram, manipulate data values displayed in the data grid. If you would like to actually see the data passed to the chart, you can set this method to true. This method will not affect all gallery types.
To configure the data grid to use raw data:
chart1.getDataGrid().setUseRawData(true);
- Parameters:
value-- See Also:
resetUseRawData
-
getVerticalGridColor
public java.awt.Color getVerticalGridColor()
Allows you to select the Vertical line color for the gridline displayed at the data grid box.
You need to have the data grid visible in order to see the changes. Use
isVisiblemethod to enable the data grid.You can set the Horizontal line color of the data grid gridline with
setHorizontalGridColormethod.For more information regarding the Color type, please refer to the Java Documentation.
Below, the data grid vertical grid color is set to Red:
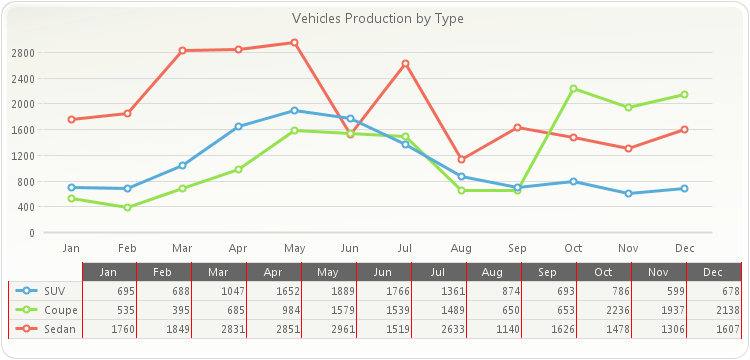
chart1.getDataGrid().setVisible(true);
chart1.getDataGrid().setVerticalGridColor(new java.awt.Color(255,0,0,255));
chart1.getLegendBox().setVisible(false);
PopulateCarProduction(chart1);
chart1.getTitles().add(new TitleDockable("Vehicles Production by Type"));
public static void PopulateCarProduction(Chart chart1) { CarProduction[] production = new CarProduction[] { new CarProduction("Jan", 1760, 535, 695 ) , new CarProduction("Feb", 1849, 395, 688 ) , new CarProduction("Mar", 2831, 685, 1047 ) , new CarProduction("Apr", 2851, 984, 1652 ) , new CarProduction("May", 2961, 1579, 1889 ) , new CarProduction("Jun", 1519, 1539, 1766 ) , new CarProduction("Jul", 2633, 1489, 1361 ) , new CarProduction("Aug", 1140, 650, 874 ) , new CarProduction("Sep", 1626, 653, 693 ) , new CarProduction("Oct", 1478, 2236, 786 ) , new CarProduction("Nov", 1306, 1937, 599 ) , new CarProduction("Dec", 1607, 2138, 678 ) }; ObjectProvider objProvider = new ObjectProvider(production); chart1.getDataSourceSettings().setDataSource(objProvider); }public static class CarProduction { private CarProduction(String month, int sedan, int coupe, int SUV) { this.setMonth(month); this.setSedan(sedan); this.setCoupe(coupe); this.setSUV(SUV); } private String privateMonth; public final String getMonth() { return privateMonth; } public final void setMonth(String value) { privateMonth = value; } private int privateSedan; public final int getSedan() { return privateSedan; } public final void setSedan(int value) { privateSedan = value; } private int privateCoupe; public final int getCoupe() { return privateCoupe; } public final void setCoupe(int value) { privateCoupe = value; } private int privateSUV; public final int getSUV() { return privateSUV; } public final void setSUV(int value) { privateSUV = value; } }
- See Also:
resetVerticalGridColor
-
setVerticalGridColor
public void setVerticalGridColor(java.awt.Color value)
Allows you to select the Vertical line color for the gridline displayed at the data grid box.
You need to have the data grid visible in order to see the changes. Use
isVisiblemethod to enable the data grid.You can set the Horizontal line color of the data grid gridline with
setHorizontalGridColormethod.For more information regarding the Color type, please refer to the Java Documentation.
Below, the data grid vertical grid color is set to Red:
chart1.getDataGrid().setVisible(true);
chart1.getDataGrid().setVerticalGridColor(new java.awt.Color(255,0,0,255));
chart1.getLegendBox().setVisible(false);
PopulateCarProduction(chart1);
chart1.getTitles().add(new TitleDockable("Vehicles Production by Type"));
public static void PopulateCarProduction(Chart chart1) { CarProduction[] production = new CarProduction[] { new CarProduction("Jan", 1760, 535, 695 ) , new CarProduction("Feb", 1849, 395, 688 ) , new CarProduction("Mar", 2831, 685, 1047 ) , new CarProduction("Apr", 2851, 984, 1652 ) , new CarProduction("May", 2961, 1579, 1889 ) , new CarProduction("Jun", 1519, 1539, 1766 ) , new CarProduction("Jul", 2633, 1489, 1361 ) , new CarProduction("Aug", 1140, 650, 874 ) , new CarProduction("Sep", 1626, 653, 693 ) , new CarProduction("Oct", 1478, 2236, 786 ) , new CarProduction("Nov", 1306, 1937, 599 ) , new CarProduction("Dec", 1607, 2138, 678 ) }; ObjectProvider objProvider = new ObjectProvider(production); chart1.getDataSourceSettings().setDataSource(objProvider); }public static class CarProduction { private CarProduction(String month, int sedan, int coupe, int SUV) { this.setMonth(month); this.setSedan(sedan); this.setCoupe(coupe); this.setSUV(SUV); } private String privateMonth; public final String getMonth() { return privateMonth; } public final void setMonth(String value) { privateMonth = value; } private int privateSedan; public final int getSedan() { return privateSedan; } public final void setSedan(int value) { privateSedan = value; } private int privateCoupe; public final int getCoupe() { return privateCoupe; } public final void setCoupe(int value) { privateCoupe = value; } private int privateSUV; public final int getSUV() { return privateSUV; } public final void setSUV(int value) { privateSUV = value; } }
- Parameters:
value-- See Also:
resetVerticalGridColor
-
isXValuesAsHeaders
public boolean isXValuesAsHeaders()
Gets or sets a value instructing that XValues be used as the headers in the data grid.
When set to true, the XValues passed to a chart will be used for the point headers in the data grid.
In order for this method to affect the chart, the chart must include XValues (XY plot).
To use XValues as Headers in the data grid:
chart1.getDataGrid().setXValuesAsHeaders(true);
- See Also:
resetXValuesAsHeaders
-
setXValuesAsHeaders
public void setXValuesAsHeaders(boolean value)
Gets or sets a value instructing that XValues be used as the headers in the data grid.
When set to true, the XValues passed to a chart will be used for the point headers in the data grid.
In order for this method to affect the chart, the chart must include XValues (XY plot).
To use XValues as Headers in the data grid:
chart1.getDataGrid().setXValuesAsHeaders(true);
- Parameters:
value-- See Also:
resetXValuesAsHeaders
-
resetBackColorData
public void resetBackColorData()
Set the property BackColorData to its default value.- See Also:
setBackColorData
-
resetBackColorDataAlternate
public void resetBackColorDataAlternate()
Set the property BackColorDataAlternate to its default value.- See Also:
setBackColorDataAlternate
-
resetBackColorHeader
public void resetBackColorHeader()
Set the property BackColorHeader to its default value.- See Also:
setBackColorHeader
-
resetContentLayout
public void resetContentLayout()
Set the property ContentLayout to its default value.- See Also:
setContentLayout
-
resetFont
public void resetFont()
Set the property Font to its default value.- See Also:
setFont
-
resetHideXValues
public void resetHideXValues()
Set the property HideXValues to its default value.- See Also:
isHideXValues
-
resetHorizontalGridColor
public void resetHorizontalGridColor()
Set the property HorizontalGridColor to its default value.- See Also:
setHorizontalGridColor
-
resetInterlaced
public void resetInterlaced()
Set the property Interlaced to its default value.- See Also:
setInterlaced
-
resetMaxSizePercentage
public void resetMaxSizePercentage()
Set the property MaxSizePercentage to its default value.- See Also:
setMaxSizePercentage
-
resetReadOnly
public void resetReadOnly()
Set the property ReadOnly to its default value.- See Also:
isReadOnly
-
resetShowHeader
public void resetShowHeader()
Set the property ShowHeader to its default value.- See Also:
isShowHeader
-
resetShowHiddenSeries
public void resetShowHiddenSeries()
Set the property ShowHiddenSeries to its default value.- See Also:
isShowHiddenSeries
-
resetShowMarkers
public void resetShowMarkers()
Set the property ShowMarkers to its default value.- See Also:
isShowMarkers
-
resetTextColorData
public void resetTextColorData()
Set the property TextColorData to its default value.- See Also:
setTextColorData
-
resetTextColorDataAlternate
public void resetTextColorDataAlternate()
Set the property TextColorDataAlternate to its default value.- See Also:
setTextColorDataAlternate
-
resetTextColorHeader
public void resetTextColorHeader()
Set the property TextColorHeader to its default value.- See Also:
setTextColorHeader
-
resetUseRawData
public void resetUseRawData()
Set the property UseRawData to its default value.- See Also:
isUseRawData
-
resetVerticalGridColor
public void resetVerticalGridColor()
Set the property VerticalGridColor to its default value.- See Also:
setVerticalGridColor
-
resetXValuesAsHeaders
public void resetXValuesAsHeaders()
Set the property XValuesAsHeaders to its default value.- See Also:
isXValuesAsHeaders
-
-