- java.lang.Object
-
- com.softwarefx.chartfx.server.Chart
-
- Direct Known Subclasses:
- ChartServer
public class Chart
extends java.lang.Object
Provides access to the Chart object. This is the main class of the Chart FX library.
General chart methods are provided to set general attributes in the chart. For example, you may use methods to show or hide tools in the chart window or to apply a specific line style to all lines in a line chart.
The data is passed to the chart using the
setDatamethod. Alternativelly, data binding is also available through thesetChartDataSourceandsetDataSourceSettingsmethods.There may be a case in which a general method is also found in a specific object. For example, you may use a general method called
setGalleryto change the chart type displayed (forsetAllSeriesin the chart), but if you use thesetGallerymethod supported by thesetGalleryobject you will change the chart type for a particular series (thus creating a MultiType chart) instead of all series in the chart. You may even go a step further by assigning methods directly to specific points rather than series using thesetPointsobject.Some methods of the Chart object act as a mechanism for assigning attributes directly to other objects that exist in the chart. Some of these methods include
LegendBox,setToolBar,setMenuBar, andDataGrid. If you want to assign individual methods to elements in the chart, you may refer to the different objects available.The chart can be rendered in 3D.
setView3Dmethod provides access the 3D customization of the chart.PopulateCarProduction(chart1); chart1.getTitles().add(new TitleDockable("Vehicles Production by Type")); chart1.getDataGrid().setVisible(true);public static void PopulateCarProduction(Chart chart1) { CarProduction[] production = new CarProduction[] { new CarProduction("Jan", 1760, 535, 695 ) , new CarProduction("Feb", 1849, 395, 688 ) , new CarProduction("Mar", 2831, 685, 1047 ) , new CarProduction("Apr", 2851, 984, 1652 ) , new CarProduction("May", 2961, 1579, 1889 ) , new CarProduction("Jun", 1519, 1539, 1766 ) , new CarProduction("Jul", 2633, 1489, 1361 ) , new CarProduction("Aug", 1140, 650, 874 ) , new CarProduction("Sep", 1626, 653, 693 ) , new CarProduction("Oct", 1478, 2236, 786 ) , new CarProduction("Nov", 1306, 1937, 599 ) , new CarProduction("Dec", 1607, 2138, 678 ) }; ObjectProvider objProvider = new ObjectProvider(production); chart1.getDataSourceSettings().setDataSource(objProvider); }public static class CarProduction { private CarProduction(String month, int sedan, int coupe, int SUV) { this.setMonth(month); this.setSedan(sedan); this.setCoupe(coupe); this.setSUV(SUV); } private String privateMonth; public final String getMonth() { return privateMonth; } public final void setMonth(String value) { privateMonth = value; } private int privateSedan; public final int getSedan() { return privateSedan; } public final void setSedan(int value) { privateSedan = value; } private int privateCoupe; public final int getCoupe() { return privateCoupe; } public final void setCoupe(int value) { privateCoupe = value; } private int privateSUV; public final int getSUV() { return privateSUV; } public final void setSUV(int value) { privateSUV = value; } }
-
-
Field Summary
Fields Modifier and Type Field and Description java.lang.StringDESIGNERASSEMBLYNAMEGeneral chart methods are provided to set general attributes in the chart.doubleHIDDENGeneral chart methods are provided to set general attributes in the chart.
-
Constructor Summary
Constructors Constructor and Description Chart()Constructs a newly allocated Chart object
-
Method Summary
Methods Modifier and Type Method and Description voidaddChangedByUserListener(ChangedByUserListener value)Adds a ChangedByUserListener to the listener list.voidaddClickListener(HitTestListener value)Adds a ClickListener to the listener list.voidaddConditionalAttributesCallbackListener(ConditionalAttributesListener value)Adds a ConditionalAttributesCallbackListener to the listener list.voidaddDataChangedListener(EventListener value)Adds a DataChangedListener to the listener list.voidaddDataSourceChangedListener(EventListener value)Adds a DataSourceChangedListener to the listener list.voidaddDrillDownListener(DrillDownListener value)Adds a DrillDownListener to the listener list.voidaddGetAxisLabelListener(AxisLabelListener value)Adds a GetAxisLabelListener to the listener list.voidaddGetPointLabelListener(PointLabelListener value)Adds a GetPointLabelListener to the listener list.voidaddInternalCommandListener(CommandUIListener value)Adds a InternalCommandListener to the listener list.voidaddPaintMarkerListener(PaintMarkerListener value)Adds a PaintMarkerListener to the listener list.voidaddPersonalizedListener(PersonalizeListener value)Adds a PersonalizedListener to the listener list.voidaddPostPaintListener(CustomPaintListener value)Adds a PostPaintListener to the listener list.voidaddPrePaintListener(CustomPaintListener value)Adds a PrePaintListener to the listener list.voidaddPrePaintMarkerListener(PaintMarkerListener value)Adds a PrePaintMarkerListener to the listener list.voidaddSelectionChangedListener(EventListener value)Adds a SelectionChangedListener to the listener list.voidaddUserCallbackListener(UserCallbackListener value)Adds a UserCallbackListener to the listener list.voidaddUserCommandListener(CommandUIListener value)Adds a UserCommandListener to the listener list.voidaddUserScrollListener(AxisListener value)Adds a UserScrollListener to the listener list.voidaddUserZoomingListener(UserZoomingListener value)Adds a UserZoomingListener to the listener list.voidaddUserZoomListener(EventListener value)Adds a UserZoomListener to the listener list.voidclearBindings()Clears all the current bindings from the chart object.static doubledateToNumber(java.util.Calendar date)Description goes herestatic doubledateToNumber(java.util.Date date)Description goes herejava.lang.StringexpandMacros(java.lang.String mask, int series, int point, boolean inPoint)Returns the mask string for a selected point or line in a chart .voidexportChart(FileFormat format, java.io.OutputStream stream)Allows you to export the chart to a stream using a specific file format.voidexportChart(FileFormat format, java.lang.String fileName)Allows you to export the chart to a data file using a specific file format.voidexportChart(java.io.OutputStream stream)Allows you to export the chart to a stream.ActionBarSettingsgetActionBars()Enables or prevents the user to use ActionBars at runtime.java.util.EnumSet<AllowChanges>getAllowChanges()Enables or prevents the end user from making certain changes at run time.GlobalAttributesgetAllSeries()Gets the global attributes which are shared across the series of the chart.AxesStylegetAxesStyle()Used to change the style of the axes.java.util.List<AxisX>getAxesX()Returns the collection of the X axes of the chart.java.util.List<AxisY>getAxesY()Returns the collection of the Y axes of the chart.AxisXgetAxisX()Assigns properties specifically to the primary X axis.AxisYgetAxisY()Assigns properties specifically to the primary Y axis of the chart.AxisYgetAxisY2()Assigns properties specifically to the secondary Y axis of the chart.java.awt.ColorgetBackColor()Gets or sets the background color of the chart.ChartBindingSourcesgetBindingSources()Used to bind the data sources between the chart and other controls.java.awt.RectanglegetChartAreaRectangle()Gets the rectangle object for the chart area.IBackgroundAdornmentgetChartBackground()Allows you to assign a background to the chart.IBorderAdornmentgetChartBorder()Allows you to assign a border to the chart.com.softwarefx.server.data.IDataSourceProvidergetChartDataSource()Gets or sets the source containing the values used to populate the chart.java.awt.FontgetChartFont()Gets or sets the font type which will be used by default in the chart.com.softwarefx.server.CommandCollectiongetCommands()Gets the list of commands associated with the chart.IConditionalAttributesCollectiongetConditionalAttributes()Returns the collection of ConditionalAttributes objects.ConfigureChartViewDelegateListenergetConfigureChartViewDelegate()Gets or sets a View Delegate for the current chart.java.lang.StringgetContentUrl()Gets or sets string which contains the URL for the content page when the user wants the chart data rendered to stream.java.util.LocalegetCulture()Allows you to localize charts for a specific language and region.DataValuesgetData()Allows you to set the Y values.DataAnalysisViewCollectiongetDataAnalysisViews()Allows you access the DataAnalysisViews collection.DataGridgetDataGrid()Gets the DataGrid of the chart.java.lang.StringgetDataMember()Gets or sets the data mamber for the chart.java.lang.StringgetDataSourceID()Gets or sets the ID of the data source control the chart should use to retrieve its data source.DataSourceSettingsgetDataSourceSettings()Used to assign data related attributes to your chart applications.DrillDownTypegetDrillDownType()Used to set the DrillDown option in the series context menu.java.awt.DimensiongetExportImageSize()Gets or sets the image dimensions for exported chart images.ExtensionCollectiongetExtensions()Collection used to add, clear and assign Chart FX extension objects.java.util.EnumSet<ChartStyles>getExtraStyle()Allows you to set additional visual attributes in the chart.java.util.EnumSet<FileContents>getFileContents()Gets or sets the attributes to save in chart files (Export method).java.awt.ColorgetForeColor()Gets or sets the default font color of the chart.GallerygetGallery()Sets the gallery type for the whole chart.IGallerygetGalleryAttributes()Used to create a gallery object to assign additional attributes to the selected gallery type of the chart.intgetHeight()Description goes hereHighlightAttributesgetHighlight()Allows you to customized how all the series of the chart are highlighted.ImageSettingsgetImageSettings()Description goes hereLegendBoxgetLegendBox()Allows you to acces the legend box of the chart.PanegetMainPane()Gets the default pane of the chart.DockableBargetMenuBar()Description goes herejava.lang.StringgetMessageText(java.lang.String key)Allows you to obtain default Chart FX stings which are displayed in the chart.java.awt.ColorgetPageColor()Allows you to specify a form background color needed to fill areas around image border shadowing.java.lang.StringgetPalette()Allows you to set a predefined color palette.java.util.List<Pane>getPanes()Returns the collection of the defined panes of the chart.PersonalizeAttributesgetPersonalize()Allows you to set the preferences for saving and loading personalized charts.IBackgroundAdornmentgetPlotAreaBackground()Allows you to assign a background to the inside area of a chart.java.awt.ColorgetPlotAreaColor()Gets and sets the color of the PlotAreaBackground.MarginsgetPlotAreaMargin()Gets and sets the top, bottom, left and right gaps of the chart.PointAttributesCollectiongetPoints()Assigns properties directly to a specific point in the chart.PrintergetPrinter()Allows you to set properties of the printer object.java.lang.StringgetProxyUri()Used to add the Proxy URI of a proxy server.RandomDatagetRandomData()Description goes hereRealTimeSettingsgetRealTime()Allows access to the RealTimeSettings class supported members used to create real-time charts.java.lang.StringgetRenderFormat()Gets or sets the chart format to generate.java.lang.ObjectgetSelectedValue()Gets the DataField value of the selected point.com.softwarefx.server.data.DataFieldgetSelectedValueField()Gets or sets the selected DataField.SelectionAttributesgetSelection()Allows the selection of one or several data in the chart.java.util.List<SeriesAttributes>getSeries()Assigns properties directly to the selected series in the chart.java.lang.StringgetStylePrefix()Description goes herejava.util.EnumSet<FileContents>getTemplateContents()Gets or sets the attributes to save in personalization features and template files (Export method).java.util.List<TitleDockable>getTitles()Returns the collection of titles defined in the chart.DockableToolBargetToolBar()Allows access to the chart's toolbar.java.lang.StringgetToolTip()Description goes herejava.lang.StringgetToolTipFormat()Allows you to control the information to be displayed in the tooltip when the user positions the mouse over a particular data point in the chart.UndoRedogetUndoRedo()Provides the undo and redo capability for the chart.Attributes3DgetView3D()Provides access to the chart's Attributes3D object to enable or disable 3D view of the chart as well as customize the 3D view.intgetWidth()Description goes herevoidimportChart(FileFormat format, java.io.InputStream stream)Allows you to import the chart from a stream using a specific file format.voidimportChart(FileFormat format, java.lang.String fileName)Allows you to import the chart from a file using a specific file format.voidimportChart(java.io.InputStream stream)Allows you to import the chart from a stream.booleanisAllowDrag()Enables or prevents the end user from dragging a marker with the mouse to change its value.booleanisAntialiasing()Gives a smooth visual effect to the chart.booleanisContextMenus()Allows you to enable or disable context sensitive menus when the user right clicks a particular chart element.booleanisCrosshairs()Enables or Disables the cross-hairs marker in the chart.booleanisDirty()Returns a boolean specifying if the chart has been modified by the user.booleanisIgnoreDesignMode()Allows or denies that the end user make changes to the chart.static booleanisLicensed()Description goes herebooleanisMonochrome()Gets or sets some chart attibutes color to MonochromebooleanisToolTips()Allows you to enable or disable tooltips when the user positions the mouse over a particular element in the chart area only.booleanisUseCallbacksForEvents()Allows you to use CallBacks scripts when events are fired.booleanisUseStyles()Description goes herebooleanisVisible()Gets or sets a value specifying to show or hide the chart.booleanisZoom()Allows you to select a section of the chart using the mouse cursor and zoom in that area.java.awt.PointmarkerToPixel(int series, int point)Returns a point storing the position in pixel of a specified chart marker.voidpaint(java.awt.Graphics2D g, java.awt.Rectangle r, java.util.EnumSet<PaintStyles> paintFlags)Allows you to paint the chart in a given device context.voidperformDrillDown(int series, int point)Used to DrillDown for a specific point.voidperformDrillUp()Returns to the parent chart prior to the DrillDown.voidrecalculateScale()Resets and recalculates all scale values.voidremoveChangedByUserListener(ChangedByUserListener value)Removes a ChangedByUserListener from the listener list.voidremoveClickListener(HitTestListener value)Removes a ClickListener from the listener list.voidremoveConditionalAttributesCallbackListener(ConditionalAttributesListener value)Removes a ConditionalAttributesCallbackListener from the listener list.voidremoveDataChangedListener(EventListener value)Removes a DataChangedListener from the listener list.voidremoveDataSourceChangedListener(EventListener value)Removes a DataSourceChangedListener from the listener list.voidremoveDrillDownListener(DrillDownListener value)Removes a DrillDownListener from the listener list.voidremoveGetAxisLabelListener(AxisLabelListener value)Removes a GetAxisLabelListener from the listener list.voidremoveGetPointLabelListener(PointLabelListener value)Removes a GetPointLabelListener from the listener list.voidremoveInternalCommandListener(CommandUIListener value)Removes a InternalCommandListener from the listener list.voidremovePaintMarkerListener(PaintMarkerListener value)Removes a PaintMarkerListener from the listener list.voidremovePersonalizedListener(PersonalizeListener value)Removes a PersonalizedListener from the listener list.voidremovePostPaintListener(CustomPaintListener value)Removes a PostPaintListener from the listener list.voidremovePrePaintListener(CustomPaintListener value)Removes a PrePaintListener from the listener list.voidremovePrePaintMarkerListener(PaintMarkerListener value)Removes a PrePaintMarkerListener from the listener list.voidremoveSelectionChangedListener(EventListener value)Removes a SelectionChangedListener from the listener list.voidremoveUserCallbackListener(UserCallbackListener value)Removes a UserCallbackListener from the listener list.voidremoveUserCommandListener(CommandUIListener value)Removes a UserCommandListener from the listener list.voidremoveUserScrollListener(AxisListener value)Removes a UserScrollListener from the listener list.voidremoveUserZoomingListener(UserZoomingListener value)Removes a UserZoomingListener from the listener list.voidremoveUserZoomListener(EventListener value)Removes a UserZoomListener from the listener list.voidrenderControl()Renders the chart directly to the browser response context.Generates a chart and embeds the required object tag or image and image map tags to the resulting html output for chart display.voidrenderToStream()Used to bit-stream a chart directly to the browser or retrieve the chart image, image map and html tag in one call.voidrenderToStream(java.io.OutputStream content, java.io.Writer imgMap, java.io.Writer htmlTag)Used to bit-stream a chart directly to the browser or retrieve the chart image, image map and html tag in one call.voidreset()Resets the chart to its original state.voidresetAllowChanges()Set the property AllowChanges to its default value.voidresetAllowDrag()Set the property AllowDrag to its default value.voidresetAntialiasing()Set the property Antialiasing to its default value.voidresetAxesStyle()Set the property AxesStyle to its default value.voidresetBackColor()Set the property BackColor to its default value.voidresetBackground()Set the property Background to its default value.voidresetBorder()Set the property Border to its default value.voidresetContextMenus()Set the property ContextMenus to its default value.voidresetCrosshairs()Set the property Crosshairs to its default value.voidresetCulture()Set the property Culture to its default value.voidresetDrillDownType()Set the property DrillDownType to its default value.voidresetExtraStyle()Set the property ExtraStyle to its default value.voidresetFont()Set the property Font to its default value.voidresetForeColor()Set the property ForeColor to its default value.voidresetMonochrome()Set the property Monochrome to its default value.voidresetPageColor()Set the property PageColor to its default value.voidresetPalette()Set the property Palette to its default value.voidresetPlotAreaColor()Set the property PlotAreaColor to its default value.voidresetProxyUri()Set the property ProxyUri to its default value.voidresetRenderFormat()Set the property RenderFormat to its default value.voidresetStylePrefix()Set the property StylePrefix to its default value.voidresetTemplateContents()Set the property TemplateContents to its default value.voidresetToolTipFormat()Set the property ToolTipFormat to its default value.voidresetToolTips()Set the property ToolTips to its default value.voidresetUseCallbacksForEvents()Set the property UseCallbacksForEvents to its default value.voidresetUseStyles()Set the property UseStyles to its default value.voidresetVisible()Set the property Visible to its default value.voidresetZoom()Set the property Zoom to its default value.voidsetAllowChanges(java.util.EnumSet<AllowChanges> value)Enables or prevents the end user from making certain changes at run time.voidsetAllowDrag(boolean value)Enables or prevents the end user from dragging a marker with the mouse to change its value.voidsetAntialiasing(boolean value)Gives a smooth visual effect to the chart.voidsetAxesStyle(AxesStyle value)Used to change the style of the axes.voidsetBackColor(java.awt.Color value)Gets or sets the background color of the chart.voidsetChartBackground(IBackgroundAdornment value)Allows you to assign a background to the chart.voidsetChartBorder(IBorderAdornment value)Allows you to assign a border to the chart.voidsetChartDataSource(com.softwarefx.server.data.IDataSourceProvider value)Gets or sets the source containing the values used to populate the chart.voidsetChartFont(java.awt.Font value)Gets or sets the font type which will be used by default in the chart.static voidsetConfigPath(java.lang.String path)Description goes herevoidsetConfigureChartViewDelegate(ConfigureChartViewDelegateListener value)Gets or sets a View Delegate for the current chart.voidsetContentUrl(java.lang.String value)Gets or sets string which contains the URL for the content page when the user wants the chart data rendered to stream.voidsetContextMenus(boolean value)Allows you to enable or disable context sensitive menus when the user right clicks a particular chart element.voidsetCrosshairs(boolean value)Enables or Disables the cross-hairs marker in the chart.voidsetCulture(java.util.Locale value)Allows you to localize charts for a specific language and region.voidsetDataMember(java.lang.String value)Gets or sets the data mamber for the chart.voidsetDataSourceID(java.lang.String value)Gets or sets the ID of the data source control the chart should use to retrieve its data source.voidsetDirty(boolean value)Returns a boolean specifying if the chart has been modified by the user.voidsetDrillDownType(DrillDownType value)Used to set the DrillDown option in the series context menu.voidsetExportImageSize(java.awt.Dimension value)Gets or sets the image dimensions for exported chart images.voidsetExtraStyle(java.util.EnumSet<ChartStyles> value)Allows you to set additional visual attributes in the chart.voidsetFileContents(java.util.EnumSet<FileContents> value)Gets or sets the attributes to save in chart files (Export method).voidsetForeColor(java.awt.Color value)Gets or sets the default font color of the chart.voidsetGallery(Gallery value)Sets the gallery type for the whole chart.voidsetGalleryAttributes(IGallery value)Used to create a gallery object to assign additional attributes to the selected gallery type of the chart.voidsetHeight(int value)Description goes herevoidsetIgnoreDesignMode(boolean value)Allows or denies that the end user make changes to the chart.static voidsetLicenseString(java.lang.String licenseString)Description goes herevoidsetMessageText(java.lang.String key, java.lang.String message)Allows you to customize default Chart FX strings which are displayed in the chart.voidsetMonochrome(boolean value)Gets or sets some chart attibutes color to MonochromevoidsetPageColor(java.awt.Color value)Allows you to specify a form background color needed to fill areas around image border shadowing.voidsetPalette(java.lang.String value)Allows you to set a predefined color palette.voidsetPlotAreaBackground(IBackgroundAdornment value)Allows you to assign a background to the inside area of a chart.voidsetPlotAreaColor(java.awt.Color value)Gets and Sets the color of the PlotAreaBackground.voidsetProxyUri(java.lang.String value)Used to add the Proxy URI of a proxy server.voidsetRenderFormat(java.lang.String value)Gets or sets the chart format to generate.voidsetSelectedValueField(com.softwarefx.server.data.DataField value)Gets or sets the selected DataField.voidsetStylePrefix(java.lang.String value)Description goes herevoidsetTemplateContents(java.util.EnumSet<FileContents> value)Gets or sets the attributes to save in personalization features and template files (Export method).voidsetToolTip(java.lang.String value)Description goes herevoidsetToolTipFormat(java.lang.String value)Allows you to control the information to be displayed in the tooltip when the user positions the mouse over a particular data point in the chart.voidsetToolTips(boolean value)Allows you to enable or disable tooltips when the user positions the mouse over a particular element in the chart area only.voidsetUseCallbacksForEvents(boolean value)Allows you to use CallBacks scripts when events are fired.voidsetUseStyles(boolean value)Description goes herevoidsetVisible(boolean value)Gets or sets a value specifying to show or hide the chart.voidsetWidth(int value)Description goes herevoidsetZoom(boolean value)Allows you to select a section of the chart using the mouse cursor and zoom in that area.voidupdateSizeNow()Allows you to force a scale calculation before the chart is drawn.voidzoomToPercentage(int percentage)Zooms the chart to center based on configured percentage value.voidzoomToWindow(int x1, int y1, int x2, int y2)Zooms the chart to a rectangular area based on specified x and y coordinates for the rectangle
-
-
-
Field Detail
-
DESIGNERASSEMBLYNAME
public java.lang.String DESIGNERASSEMBLYNAME
General chart methods are provided to set general attributes in the chart. For example, you may use methods to show or hide tools in the chart window or to apply a specific line style to all lines in a line chart.
The data is passed to the chart using the
setDatamethod. Alternativelly, data binding is also available through thesetChartDataSourceandsetDataSourceSettingsmethods.There may be a case in which a general method is also found in a specific object. For example, you may use a general method called
setGalleryto change the chart type displayed (forsetAllSeriesin the chart), but if you use thesetGallerymethod supported by thesetGalleryobject you will change the chart type for a particular series (thus creating a MultiType chart) instead of all series in the chart. You may even go a step further by assigning methods directly to specific points rather than series using thesetPointsobject.Some methods of the Chart object act as a mechanism for assigning attributes directly to other objects that exist in the chart. Some of these methods include
LegendBox,setToolBar,setMenuBar, andDataGrid. If you want to assign individual methods to elements in the chart, you may refer to the different objects available.The chart can be rendered in 3D.
setView3Dmethod provides access the 3D customization of the chart.PopulateCarProduction(chart1); chart1.getTitles().add(new TitleDockable("Vehicles Production by Type")); chart1.getDataGrid().setVisible(true);public static void PopulateCarProduction(Chart chart1) { CarProduction[] production = new CarProduction[] { new CarProduction("Jan", 1760, 535, 695 ) , new CarProduction("Feb", 1849, 395, 688 ) , new CarProduction("Mar", 2831, 685, 1047 ) , new CarProduction("Apr", 2851, 984, 1652 ) , new CarProduction("May", 2961, 1579, 1889 ) , new CarProduction("Jun", 1519, 1539, 1766 ) , new CarProduction("Jul", 2633, 1489, 1361 ) , new CarProduction("Aug", 1140, 650, 874 ) , new CarProduction("Sep", 1626, 653, 693 ) , new CarProduction("Oct", 1478, 2236, 786 ) , new CarProduction("Nov", 1306, 1937, 599 ) , new CarProduction("Dec", 1607, 2138, 678 ) }; ObjectProvider objProvider = new ObjectProvider(production); chart1.getDataSourceSettings().setDataSource(objProvider); }public static class CarProduction { private CarProduction(String month, int sedan, int coupe, int SUV) { this.setMonth(month); this.setSedan(sedan); this.setCoupe(coupe); this.setSUV(SUV); } private String privateMonth; public final String getMonth() { return privateMonth; } public final void setMonth(String value) { privateMonth = value; } private int privateSedan; public final int getSedan() { return privateSedan; } public final void setSedan(int value) { privateSedan = value; } private int privateCoupe; public final int getCoupe() { return privateCoupe; } public final void setCoupe(int value) { privateCoupe = value; } private int privateSUV; public final int getSUV() { return privateSUV; } public final void setSUV(int value) { privateSUV = value; } }
-
HIDDEN
public double HIDDEN
General chart methods are provided to set general attributes in the chart. For example, you may use methods to show or hide tools in the chart window or to apply a specific line style to all lines in a line chart.
The data is passed to the chart using the
setDatamethod. Alternativelly, data binding is also available through thesetChartDataSourceandsetDataSourceSettingsmethods.There may be a case in which a general method is also found in a specific object. For example, you may use a general method called
setGalleryto change the chart type displayed (forsetAllSeriesin the chart), but if you use thesetGallerymethod supported by thesetGalleryobject you will change the chart type for a particular series (thus creating a MultiType chart) instead of all series in the chart. You may even go a step further by assigning methods directly to specific points rather than series using thesetPointsobject.Some methods of the Chart object act as a mechanism for assigning attributes directly to other objects that exist in the chart. Some of these methods include
LegendBox,setToolBar,setMenuBar, andDataGrid. If you want to assign individual methods to elements in the chart, you may refer to the different objects available.The chart can be rendered in 3D.
setView3Dmethod provides access the 3D customization of the chart.PopulateCarProduction(chart1); chart1.getTitles().add(new TitleDockable("Vehicles Production by Type")); chart1.getDataGrid().setVisible(true);public static void PopulateCarProduction(Chart chart1) { CarProduction[] production = new CarProduction[] { new CarProduction("Jan", 1760, 535, 695 ) , new CarProduction("Feb", 1849, 395, 688 ) , new CarProduction("Mar", 2831, 685, 1047 ) , new CarProduction("Apr", 2851, 984, 1652 ) , new CarProduction("May", 2961, 1579, 1889 ) , new CarProduction("Jun", 1519, 1539, 1766 ) , new CarProduction("Jul", 2633, 1489, 1361 ) , new CarProduction("Aug", 1140, 650, 874 ) , new CarProduction("Sep", 1626, 653, 693 ) , new CarProduction("Oct", 1478, 2236, 786 ) , new CarProduction("Nov", 1306, 1937, 599 ) , new CarProduction("Dec", 1607, 2138, 678 ) }; ObjectProvider objProvider = new ObjectProvider(production); chart1.getDataSourceSettings().setDataSource(objProvider); }public static class CarProduction { private CarProduction(String month, int sedan, int coupe, int SUV) { this.setMonth(month); this.setSedan(sedan); this.setCoupe(coupe); this.setSUV(SUV); } private String privateMonth; public final String getMonth() { return privateMonth; } public final void setMonth(String value) { privateMonth = value; } private int privateSedan; public final int getSedan() { return privateSedan; } public final void setSedan(int value) { privateSedan = value; } private int privateCoupe; public final int getCoupe() { return privateCoupe; } public final void setCoupe(int value) { privateCoupe = value; } private int privateSUV; public final int getSUV() { return privateSUV; } public final void setSUV(int value) { privateSUV = value; } }
-
-
Method Detail
-
getActionBars
public ActionBarSettings getActionBars()
Enables or prevents the user to use ActionBars at runtime.
chart1.getActionBars().setEnabled(true);
-
getAllSeries
public GlobalAttributes getAllSeries()
Gets the global attributes which are shared across the series of the chart.
PopulateCarProduction(chart1);
chart1.getTitles().add(new TitleDockable("Vehicles Production First Semester 2012"));
chart1.getAllSeries().getPointLabels().setVisible(true);
chart1.getAllSeries().setGallery(Gallery.PIE);
chart1.getData().setPoints(6);
chart1.getAllSeries().setGallery(Gallery.PIE);
public static void PopulateCarProduction(Chart chart1) { CarProduction[] production = new CarProduction[] { new CarProduction("Jan", 1760, 535, 695 ) , new CarProduction("Feb", 1849, 395, 688 ) , new CarProduction("Mar", 2831, 685, 1047 ) , new CarProduction("Apr", 2851, 984, 1652 ) , new CarProduction("May", 2961, 1579, 1889 ) , new CarProduction("Jun", 1519, 1539, 1766 ) , new CarProduction("Jul", 2633, 1489, 1361 ) , new CarProduction("Aug", 1140, 650, 874 ) , new CarProduction("Sep", 1626, 653, 693 ) , new CarProduction("Oct", 1478, 2236, 786 ) , new CarProduction("Nov", 1306, 1937, 599 ) , new CarProduction("Dec", 1607, 2138, 678 ) }; ObjectProvider objProvider = new ObjectProvider(production); chart1.getDataSourceSettings().setDataSource(objProvider); }public static class CarProduction { private CarProduction(String month, int sedan, int coupe, int SUV) { this.setMonth(month); this.setSedan(sedan); this.setCoupe(coupe); this.setSUV(SUV); } private String privateMonth; public final String getMonth() { return privateMonth; } public final void setMonth(String value) { privateMonth = value; } private int privateSedan; public final int getSedan() { return privateSedan; } public final void setSedan(int value) { privateSedan = value; } private int privateCoupe; public final int getCoupe() { return privateCoupe; } public final void setCoupe(int value) { privateCoupe = value; } private int privateSUV; public final int getSUV() { return privateSUV; } public final void setSUV(int value) { privateSUV = value; } }
PopulateProductSales_White(chart1);
chart1.getTitles().add(new TitleDockable("Monthly White Wine Sales Distribution"));
chart1.getAllSeries().getPointLabels().setVisible(true);
chart1.setGallery(Gallery.PIE);
public static void PopulateProductSales_White(Chart chart1) { ProductSales[] data = new ProductSales[]{ new ProductSales("Jan", 12560, 23400, 34500), new ProductSales("Feb", 13400, 21000, 38900), new ProductSales("Mar", 16700, 17000, 42100), new ProductSales("Apr", 12000, 19020, 43800), new ProductSales("May", 15800, 26500, 37540), new ProductSales("Jun", 9800, 27800, 32580), new ProductSales("Jul", 17800, 29820, 34000), new ProductSales("Aug", 19800, 17800, 38000), new ProductSales("Sep", 23200, 32000, 41300), new ProductSales("Oct", 16700, 26500, 46590), new ProductSales("Nov", 11800, 23000, 48700), new ProductSales("Dec", 13400, 15400, 49100) }; ObjectProvider objProvider = new ObjectProvider(data); chart1.getDataSourceSettings().setDataSource(objProvider); // Since not all the fields in the DataSource are required, we must specify the number // of series that will be contained in the chart and perform the corresponding bindings chart1.getData().setSeries(1); NumericDataField numericFieldWhite = new NumericDataField(); numericFieldWhite.setDataPath("White"); chart1.getDataSourceSettings().getDataFields().add(numericFieldWhite); chart1.getSeries().get(0).getBindings().setY(numericFieldWhite); StringDataField stringFieldMonth = new StringDataField(); stringFieldMonth.setDataPath("Month"); chart1.getDataSourceSettings().getDataFields().add(stringFieldMonth); chart1.getAxisX().getBindings().setLabel(stringFieldMonth); }public static void PopulateProductSales(Chart chart1) { ProductSales[] data = new ProductSales[]{ new ProductSales("Jan", 12560, 23400, 34500), new ProductSales("Feb", 13400, 21000, 38900), new ProductSales("Mar", 16700, 17000, 42100), new ProductSales("Apr", 12000, 19020, 43800), new ProductSales("May", 15800, 26500, 37540), new ProductSales("Jun", 9800, 27800, 32580), new ProductSales("Jul", 17800, 29820, 34000), new ProductSales("Aug", 19800, 17800, 38000), new ProductSales("Sep", 23200, 32000, 41300), new ProductSales("Oct", 16700, 26500, 46590), new ProductSales("Nov", 11800, 23000, 48700), new ProductSales("Dec", 13400, 15400, 49100) }; ObjectProvider objProvider = new ObjectProvider(data); chart1.getDataSourceSettings().setDataSource(objProvider); }public static class ProductSales { public ProductSales(String month, double white, double red, double sparkling) { this.setMonth(month); this.setWhite(white); this.setRed(red); this.setSparkling(sparkling); } private String privateMonth; public final String getMonth() { return privateMonth; } public final void setMonth(String value) { privateMonth = value; } private double privateWhite; public final double getWhite() { return privateWhite; } public final void setWhite(double value) { privateWhite = value; } private double privateRed; public final double getRed() { return privateRed; } public final void setRed(double value) { privateRed = value; } private double privateSparkling; public final double getSparkling() { return privateSparkling; } public final void setSparkling(double value) { privateSparkling = value; } }
-
getAllowChanges
public java.util.EnumSet<AllowChanges> getAllowChanges()
Enables or prevents the end user from making certain changes at run time.
chart1.getToolBar().setVisible(true);
java.util.EnumSet<AllowChanges> style = chart1.getAllowChanges();

style.add(AllowChanges.ROTATE);

chart1.setAllowChanges(style);
java.util.EnumSet<AllowChanges> style = chart1.getAllowChanges();

style.add(AllowChanges.LOGARITHMIC_SCALE);

chart1.setAllowChanges(style);
chart1.setAllowChanges((chart1.getAllowChanges() ^ AllowChanges.PRINT));
- See Also:
resetAllowChanges
-
setAllowChanges
public void setAllowChanges(java.util.EnumSet<AllowChanges> value)
Enables or prevents the end user from making certain changes at run time.
chart1.getToolBar().setVisible(true);
java.util.EnumSet<AllowChanges> style = chart1.getAllowChanges();

style.add(AllowChanges.ROTATE);

chart1.setAllowChanges(style);
java.util.EnumSet<AllowChanges> style = chart1.getAllowChanges();

style.add(AllowChanges.LOGARITHMIC_SCALE);

chart1.setAllowChanges(style);
chart1.setAllowChanges((chart1.getAllowChanges() ^ AllowChanges.PRINT));
- Parameters:
value-- See Also:
resetAllowChanges
-
isAllowDrag
public boolean isAllowDrag()
Enables or prevents the end user from dragging a marker with the mouse to change its value.
Alternativelly, AllowDrag from the
setAllowChangesmethod can be used.When performing a marker drag, the end user will be able to change the data point value and a Tooltip will appear.
To enable the marker dragging feature:
chart1.setAllowDrag(true);
- See Also:
resetAllowDrag
-
setAllowDrag
public void setAllowDrag(boolean value)
Enables or prevents the end user from dragging a marker with the mouse to change its value.
Alternativelly, AllowDrag from the
setAllowChangesmethod can be used.When performing a marker drag, the end user will be able to change the data point value and a Tooltip will appear.
To enable the marker dragging feature:
chart1.setAllowDrag(true);
- Parameters:
value-- See Also:
resetAllowDrag
-
isAntialiasing
public boolean isAntialiasing()
Gives a smooth visual effect to the chart.
PopulateCarProduction(chart1);
chart1.getTitles().add(new TitleDockable("Vehicles Production by Type"));
chart1.setAntialiasing(true);
public static void PopulateCarProduction(Chart chart1) { CarProduction[] production = new CarProduction[] { new CarProduction("Jan", 1760, 535, 695 ) , new CarProduction("Feb", 1849, 395, 688 ) , new CarProduction("Mar", 2831, 685, 1047 ) , new CarProduction("Apr", 2851, 984, 1652 ) , new CarProduction("May", 2961, 1579, 1889 ) , new CarProduction("Jun", 1519, 1539, 1766 ) , new CarProduction("Jul", 2633, 1489, 1361 ) , new CarProduction("Aug", 1140, 650, 874 ) , new CarProduction("Sep", 1626, 653, 693 ) , new CarProduction("Oct", 1478, 2236, 786 ) , new CarProduction("Nov", 1306, 1937, 599 ) , new CarProduction("Dec", 1607, 2138, 678 ) }; ObjectProvider objProvider = new ObjectProvider(production); chart1.getDataSourceSettings().setDataSource(objProvider); }public static class CarProduction { private CarProduction(String month, int sedan, int coupe, int SUV) { this.setMonth(month); this.setSedan(sedan); this.setCoupe(coupe); this.setSUV(SUV); } private String privateMonth; public final String getMonth() { return privateMonth; } public final void setMonth(String value) { privateMonth = value; } private int privateSedan; public final int getSedan() { return privateSedan; } public final void setSedan(int value) { privateSedan = value; } private int privateCoupe; public final int getCoupe() { return privateCoupe; } public final void setCoupe(int value) { privateCoupe = value; } private int privateSUV; public final int getSUV() { return privateSUV; } public final void setSUV(int value) { privateSUV = value; } }
PopulateCarProduction(chart1);
chart1.getTitles().add(new TitleDockable("Vehicles Production by Type"));
chart1.setAntialiasing(false);
public static void PopulateCarProduction(Chart chart1) { CarProduction[] production = new CarProduction[] { new CarProduction("Jan", 1760, 535, 695 ) , new CarProduction("Feb", 1849, 395, 688 ) , new CarProduction("Mar", 2831, 685, 1047 ) , new CarProduction("Apr", 2851, 984, 1652 ) , new CarProduction("May", 2961, 1579, 1889 ) , new CarProduction("Jun", 1519, 1539, 1766 ) , new CarProduction("Jul", 2633, 1489, 1361 ) , new CarProduction("Aug", 1140, 650, 874 ) , new CarProduction("Sep", 1626, 653, 693 ) , new CarProduction("Oct", 1478, 2236, 786 ) , new CarProduction("Nov", 1306, 1937, 599 ) , new CarProduction("Dec", 1607, 2138, 678 ) }; ObjectProvider objProvider = new ObjectProvider(production); chart1.getDataSourceSettings().setDataSource(objProvider); }public static class CarProduction { private CarProduction(String month, int sedan, int coupe, int SUV) { this.setMonth(month); this.setSedan(sedan); this.setCoupe(coupe); this.setSUV(SUV); } private String privateMonth; public final String getMonth() { return privateMonth; } public final void setMonth(String value) { privateMonth = value; } private int privateSedan; public final int getSedan() { return privateSedan; } public final void setSedan(int value) { privateSedan = value; } private int privateCoupe; public final int getCoupe() { return privateCoupe; } public final void setCoupe(int value) { privateCoupe = value; } private int privateSUV; public final int getSUV() { return privateSUV; } public final void setSUV(int value) { privateSUV = value; } }
- See Also:
resetAntialiasing
-
setAntialiasing
public void setAntialiasing(boolean value)
Gives a smooth visual effect to the chart.
PopulateCarProduction(chart1);
chart1.getTitles().add(new TitleDockable("Vehicles Production by Type"));
chart1.setAntialiasing(true);
public static void PopulateCarProduction(Chart chart1) { CarProduction[] production = new CarProduction[] { new CarProduction("Jan", 1760, 535, 695 ) , new CarProduction("Feb", 1849, 395, 688 ) , new CarProduction("Mar", 2831, 685, 1047 ) , new CarProduction("Apr", 2851, 984, 1652 ) , new CarProduction("May", 2961, 1579, 1889 ) , new CarProduction("Jun", 1519, 1539, 1766 ) , new CarProduction("Jul", 2633, 1489, 1361 ) , new CarProduction("Aug", 1140, 650, 874 ) , new CarProduction("Sep", 1626, 653, 693 ) , new CarProduction("Oct", 1478, 2236, 786 ) , new CarProduction("Nov", 1306, 1937, 599 ) , new CarProduction("Dec", 1607, 2138, 678 ) }; ObjectProvider objProvider = new ObjectProvider(production); chart1.getDataSourceSettings().setDataSource(objProvider); }public static class CarProduction { private CarProduction(String month, int sedan, int coupe, int SUV) { this.setMonth(month); this.setSedan(sedan); this.setCoupe(coupe); this.setSUV(SUV); } private String privateMonth; public final String getMonth() { return privateMonth; } public final void setMonth(String value) { privateMonth = value; } private int privateSedan; public final int getSedan() { return privateSedan; } public final void setSedan(int value) { privateSedan = value; } private int privateCoupe; public final int getCoupe() { return privateCoupe; } public final void setCoupe(int value) { privateCoupe = value; } private int privateSUV; public final int getSUV() { return privateSUV; } public final void setSUV(int value) { privateSUV = value; } }
PopulateCarProduction(chart1);
chart1.getTitles().add(new TitleDockable("Vehicles Production by Type"));
chart1.setAntialiasing(false);
public static void PopulateCarProduction(Chart chart1) { CarProduction[] production = new CarProduction[] { new CarProduction("Jan", 1760, 535, 695 ) , new CarProduction("Feb", 1849, 395, 688 ) , new CarProduction("Mar", 2831, 685, 1047 ) , new CarProduction("Apr", 2851, 984, 1652 ) , new CarProduction("May", 2961, 1579, 1889 ) , new CarProduction("Jun", 1519, 1539, 1766 ) , new CarProduction("Jul", 2633, 1489, 1361 ) , new CarProduction("Aug", 1140, 650, 874 ) , new CarProduction("Sep", 1626, 653, 693 ) , new CarProduction("Oct", 1478, 2236, 786 ) , new CarProduction("Nov", 1306, 1937, 599 ) , new CarProduction("Dec", 1607, 2138, 678 ) }; ObjectProvider objProvider = new ObjectProvider(production); chart1.getDataSourceSettings().setDataSource(objProvider); }public static class CarProduction { private CarProduction(String month, int sedan, int coupe, int SUV) { this.setMonth(month); this.setSedan(sedan); this.setCoupe(coupe); this.setSUV(SUV); } private String privateMonth; public final String getMonth() { return privateMonth; } public final void setMonth(String value) { privateMonth = value; } private int privateSedan; public final int getSedan() { return privateSedan; } public final void setSedan(int value) { privateSedan = value; } private int privateCoupe; public final int getCoupe() { return privateCoupe; } public final void setCoupe(int value) { privateCoupe = value; } private int privateSUV; public final int getSUV() { return privateSUV; } public final void setSUV(int value) { privateSUV = value; } }
- Parameters:
value-- See Also:
resetAntialiasing
-
getAxesStyle
public AxesStyle getAxesStyle()
Used to change the style of the axes.
PopulateProductSales(chart1);
chart1.getTitles().add(new TitleDockable("Wine Sales by Type"));
chart1.getAxisY().getLabelsFormat().setFormat(AxisFormat.CURRENCY);
chart1.setAxesStyle(AxesStyle.MATH);
chart1.getAxisX().getLine().setColor(new java.awt.Color(255,0,0,255));
chart1.getAxisY().getLine().setColor(new java.awt.Color(255,0,0,255));
public static void PopulateProductSales(Chart chart1) { ProductSales[] data = new ProductSales[]{ new ProductSales("Jan", 12560, 23400, 34500), new ProductSales("Feb", 13400, 21000, 38900), new ProductSales("Mar", 16700, 17000, 42100), new ProductSales("Apr", 12000, 19020, 43800), new ProductSales("May", 15800, 26500, 37540), new ProductSales("Jun", 9800, 27800, 32580), new ProductSales("Jul", 17800, 29820, 34000), new ProductSales("Aug", 19800, 17800, 38000), new ProductSales("Sep", 23200, 32000, 41300), new ProductSales("Oct", 16700, 26500, 46590), new ProductSales("Nov", 11800, 23000, 48700), new ProductSales("Dec", 13400, 15400, 49100) }; ObjectProvider objProvider = new ObjectProvider(data); chart1.getDataSourceSettings().setDataSource(objProvider); }public static class ProductSales { public ProductSales(String month, double white, double red, double sparkling) { this.setMonth(month); this.setWhite(white); this.setRed(red); this.setSparkling(sparkling); } private String privateMonth; public final String getMonth() { return privateMonth; } public final void setMonth(String value) { privateMonth = value; } private double privateWhite; public final double getWhite() { return privateWhite; } public final void setWhite(double value) { privateWhite = value; } private double privateRed; public final double getRed() { return privateRed; } public final void setRed(double value) { privateRed = value; } private double privateSparkling; public final double getSparkling() { return privateSparkling; } public final void setSparkling(double value) { privateSparkling = value; } }
- See Also:
resetAxesStyle
-
setAxesStyle
public void setAxesStyle(AxesStyle value)
Used to change the style of the axes.
PopulateProductSales(chart1);
chart1.getTitles().add(new TitleDockable("Wine Sales by Type"));
chart1.getAxisY().getLabelsFormat().setFormat(AxisFormat.CURRENCY);
chart1.setAxesStyle(AxesStyle.MATH);
chart1.getAxisX().getLine().setColor(new java.awt.Color(255,0,0,255));
chart1.getAxisY().getLine().setColor(new java.awt.Color(255,0,0,255));
public static void PopulateProductSales(Chart chart1) { ProductSales[] data = new ProductSales[]{ new ProductSales("Jan", 12560, 23400, 34500), new ProductSales("Feb", 13400, 21000, 38900), new ProductSales("Mar", 16700, 17000, 42100), new ProductSales("Apr", 12000, 19020, 43800), new ProductSales("May", 15800, 26500, 37540), new ProductSales("Jun", 9800, 27800, 32580), new ProductSales("Jul", 17800, 29820, 34000), new ProductSales("Aug", 19800, 17800, 38000), new ProductSales("Sep", 23200, 32000, 41300), new ProductSales("Oct", 16700, 26500, 46590), new ProductSales("Nov", 11800, 23000, 48700), new ProductSales("Dec", 13400, 15400, 49100) }; ObjectProvider objProvider = new ObjectProvider(data); chart1.getDataSourceSettings().setDataSource(objProvider); }public static class ProductSales { public ProductSales(String month, double white, double red, double sparkling) { this.setMonth(month); this.setWhite(white); this.setRed(red); this.setSparkling(sparkling); } private String privateMonth; public final String getMonth() { return privateMonth; } public final void setMonth(String value) { privateMonth = value; } private double privateWhite; public final double getWhite() { return privateWhite; } public final void setWhite(double value) { privateWhite = value; } private double privateRed; public final double getRed() { return privateRed; } public final void setRed(double value) { privateRed = value; } private double privateSparkling; public final double getSparkling() { return privateSparkling; } public final void setSparkling(double value) { privateSparkling = value; } }
- Parameters:
value-- See Also:
resetAxesStyle
-
getAxesX
public java.util.List<AxisX> getAxesX()
Returns the collection of the X axes of the chart.AxisX axisX; axisX = new AxisX(); axisX.setTextColor(new java.awt.Color(0,0,255,255)); chart1.getAxesX().add(axisX);
-
getAxesY
public java.util.List<AxisY> getAxesY()
Returns the collection of the Y axes of the chart.AxisY axisY; axisY = new AxisY(); axisY.setTextColor(new java.awt.Color(0,0,255,255)); chart1.getAxesY().add(axisY); chart1.getSeries().get(0).setAxisY(chart1.getAxesY().get(1));
-
getAxisX
public AxisX getAxisX()
Assigns properties specifically to the primary X axis.
PopulateCarProduction_SUV(chart1);
chart1.setGallery(Gallery.BAR);
chart1.getLegendBox().setVisible(false);
chart1.getTitles().add(new TitleDockable("SUV Production by Month"));
chart1.getTitles().add(new TitleDockable("Jan-Dec 2013"));
chart1.getAxisX().setVisible(false);
public static void PopulateCarProduction_SUV(Chart chart1) { CarProduction[] production = new CarProduction[] { new CarProduction("Jan", 1760, 535, 695 ) , new CarProduction("Feb", 1849, 395, 688 ) , new CarProduction("Mar", 2831, 685, 1047 ) , new CarProduction("Apr", 2851, 984, 1652 ) , new CarProduction("May", 2961, 1579, 1889 ) , new CarProduction("Jun", 1519, 1539, 1766 ) , new CarProduction("Jul", 2633, 1489, 1361 ) , new CarProduction("Aug", 1140, 650, 874 ) , new CarProduction("Sep", 1626, 653, 693 ) , new CarProduction("Oct", 1478, 2236, 786 ) , new CarProduction("Nov", 1306, 1937, 599 ) , new CarProduction("Dec", 1607, 2138, 678 ) }; ObjectProvider objProvider = new ObjectProvider(production); chart1.getDataSourceSettings().setDataSource(objProvider); // Since not all the fields in the DataSource are required, we must specify the number // of series that will be contained in the chart and perform the corresponding bindings chart1.getData().setSeries(1); NumericDataField numericFieldSUV = new NumericDataField(); numericFieldSUV.setDataPath("SUV"); chart1.getDataSourceSettings().getDataFields().add(numericFieldSUV); chart1.getSeries().get(0).getBindings().setY(numericFieldSUV); StringDataField stringField = new StringDataField(); stringField.setDataPath("Month"); chart1.getDataSourceSettings().getDataFields().add(stringField); chart1.getAxisX().getBindings().setLabel(stringField); }public static void PopulateCarProduction(Chart chart1) { CarProduction[] production = new CarProduction[] { new CarProduction("Jan", 1760, 535, 695 ) , new CarProduction("Feb", 1849, 395, 688 ) , new CarProduction("Mar", 2831, 685, 1047 ) , new CarProduction("Apr", 2851, 984, 1652 ) , new CarProduction("May", 2961, 1579, 1889 ) , new CarProduction("Jun", 1519, 1539, 1766 ) , new CarProduction("Jul", 2633, 1489, 1361 ) , new CarProduction("Aug", 1140, 650, 874 ) , new CarProduction("Sep", 1626, 653, 693 ) , new CarProduction("Oct", 1478, 2236, 786 ) , new CarProduction("Nov", 1306, 1937, 599 ) , new CarProduction("Dec", 1607, 2138, 678 ) }; ObjectProvider objProvider = new ObjectProvider(production); chart1.getDataSourceSettings().setDataSource(objProvider); }public static class CarProduction { private CarProduction(String month, int sedan, int coupe, int SUV) { this.setMonth(month); this.setSedan(sedan); this.setCoupe(coupe); this.setSUV(SUV); } private String privateMonth; public final String getMonth() { return privateMonth; } public final void setMonth(String value) { privateMonth = value; } private int privateSedan; public final int getSedan() { return privateSedan; } public final void setSedan(int value) { privateSedan = value; } private int privateCoupe; public final int getCoupe() { return privateCoupe; } public final void setCoupe(int value) { privateCoupe = value; } private int privateSUV; public final int getSUV() { return privateSUV; } public final void setSUV(int value) { privateSUV = value; } }
PopulateGasMeasurements(chart1);
NumericDataField psi;
psi = new NumericDataField();
psi.setDataPath("Psi");
chart1.getDataSourceSettings().getDataFields().add(((DataField)psi));
NumericDataField temperature;
temperature = new NumericDataField();
temperature.setDataPath("F");
chart1.getDataSourceSettings().getDataFields().add(((DataField)temperature));
chart1.getData().setSeries(1);
chart1.getSeries().get(0).getBindings().setX(psi);
chart1.getSeries().get(0).getBindings().setY(temperature);
chart1.getTitles().add(new TitleDockable("Vapor Pressure vs Temperature for Dichloromethane (Methylene Chloride)"));
chart1.getAxisY().getTitle().setText("Temperature (Fahrenheit)");
chart1.getAxisX().getTitle().setText("Pressure (PSI)");
chart1.getLegendBox().setVisible(false);
chart1.getAxisX().getLabelsFormat().setDecimals(2);
public static void PopulateGasMeasurements(Chart chart1) { GasMeasurements[] data = new GasMeasurements[] { new GasMeasurements(200, -73.2, -99.7, 0.1, 0.001, 0.015, 0.75), new GasMeasurements(203.2, -70, -94, 0.13, 0.0013, 0.019, 1), new GasMeasurements(205, -68.2, -90.7, 0.2, 0.002, 0.029, 1.5), new GasMeasurements(210, -63.2, -81.7, 0.3, 0.003, 0.044, 2.3), new GasMeasurements(215, -58.2, -72.7, 0.4, 0.0039, 0.058, 3), new GasMeasurements(220, -53.2, -63.7, 0.6, 0.0059, 0.087, 4.5), new GasMeasurements(225, -48.2, -54.7, 0.9, 0.0089, 0.13, 6.8), new GasMeasurements(229.9, -43.3, -45.9, 1.33, 0.0132, 0.193, 10), new GasMeasurements(230, -43.2, -45.7, 1.4, 0.0138, 0.203, 10.5), new GasMeasurements(235, -38.2, -36.7, 2, 0.0197, 0.29, 15), new GasMeasurements(240, -33.2, -27.7, 2.8, 0.0276, 0.406, 21), new GasMeasurements(245, -28.2, -18.7, 3.8, 0.0375, 0.551, 28.5), new GasMeasurements(250, -23.2, -9.67, 5.3, 0.0523, 0.769, 39.8), new GasMeasurements(250.9, -22.3, -8.14, 5.33, 0.0526, 0.773, 40), new GasMeasurements(255, -18.2, -0.67, 7.1, 0.0701, 1.03, 53.3), new GasMeasurements(260, -13.2, 8.33, 9.5, 0.0938, 1.38, 71.3), new GasMeasurements(265, -8.15, 17.3, 12.4, 0.1224, 1.798, 93.01), new GasMeasurements(266.9, -6.3, 20.7, 13.33, 0.1316, 1.934, 100), new GasMeasurements(270, -3.15, 26.3, 16.1, 0.1589, 2.335, 120.8), new GasMeasurements(275, 1.85, 35.3, 20.7, 0.2043, 3.002, 155.3), new GasMeasurements(280, 6.85, 44.3, 26.3, 0.2596, 3.815, 197.3), new GasMeasurements(285, 11.9, 53.3, 33, 0.3257, 4.786, 247.5), new GasMeasurements(290, 16.9, 62.3, 41.1, 0.4056, 5.961, 308.3), new GasMeasurements(295, 21.9, 71.3, 50.8, 0.5014, 7.368, 381), new GasMeasurements(297.3, 24.1, 75.4, 53.33, 0.5263, 7.735, 400), new GasMeasurements(300, 26.9, 80.3, 62.1, 0.6129, 9.007, 465.8), new GasMeasurements(313.9, 40.7, 105, 101.3, 1, 14.7, 760) }; ObjectProvider objProvider = new ObjectProvider(data); chart1.getDataSourceSettings().setDataSource(objProvider); }public static class GasMeasurements { public GasMeasurements(double k, double c, double f, double kPa, double atm, double psi, double torr){ this.setK(k); this.setC(c); this.setF(f); this.setKPa(kPa); this.setAtm(atm); this.setPsi(psi); this.setTorr(torr); } private double privateK; public final double getK() { return privateK; } public final void setK(double value) { privateK = value; } private double privateC; public final double getC() { return privateC; } public final void setC(double value) { privateC = value; } private double privateF; public final double getF() { return privateF; } public final void setF(double value) { privateF = value; } private double privateKPa; public final double getKPa() { return privateKPa; } public final void setKPa(double value) { privateKPa = value; } private double privateAtm; public final double getAtm() { return privateAtm; } public final void setAtm(double value) { privateAtm = value; } private double privatePsi; public final double getPsi() { return privatePsi; } public final void setPsi(double value) { privatePsi = value; } private double privateTorr; public final double getTorr() { return privateTorr; } public final void setTorr(double value) { privateTorr = value; } }
-
getAxisY
public AxisY getAxisY()
Assigns properties specifically to the primary Y axis of the chart.
PopulateGasMeasurements(chart1);
NumericDataField psi;
psi = new NumericDataField();
psi.setDataPath("Psi");
chart1.getDataSourceSettings().getDataFields().add(((DataField)psi));
NumericDataField temperature;
temperature = new NumericDataField();
temperature.setDataPath("F");
chart1.getDataSourceSettings().getDataFields().add(((DataField)temperature));
chart1.getData().setSeries(1);
chart1.getSeries().get(0).getBindings().setY(psi);
chart1.getSeries().get(0).getBindings().setX(temperature);
chart1.getTitles().add(new TitleDockable("Vapor Pressure vs Temperature for Dichloromethane (Methylene Chloride)"));
chart1.getAxisX().getTitle().setText("Temperature (Fahrenheit)");
chart1.getAxisY().getTitle().setText("Pressure (PSI)");
chart1.getLegendBox().setVisible(false);
chart1.getAxisY().getLabelsFormat().setDecimals(3);
chart1.getAxisY().setTextColor(new java.awt.Color(0,0,255,255));
public static void PopulateGasMeasurements(Chart chart1) { GasMeasurements[] data = new GasMeasurements[] { new GasMeasurements(200, -73.2, -99.7, 0.1, 0.001, 0.015, 0.75), new GasMeasurements(203.2, -70, -94, 0.13, 0.0013, 0.019, 1), new GasMeasurements(205, -68.2, -90.7, 0.2, 0.002, 0.029, 1.5), new GasMeasurements(210, -63.2, -81.7, 0.3, 0.003, 0.044, 2.3), new GasMeasurements(215, -58.2, -72.7, 0.4, 0.0039, 0.058, 3), new GasMeasurements(220, -53.2, -63.7, 0.6, 0.0059, 0.087, 4.5), new GasMeasurements(225, -48.2, -54.7, 0.9, 0.0089, 0.13, 6.8), new GasMeasurements(229.9, -43.3, -45.9, 1.33, 0.0132, 0.193, 10), new GasMeasurements(230, -43.2, -45.7, 1.4, 0.0138, 0.203, 10.5), new GasMeasurements(235, -38.2, -36.7, 2, 0.0197, 0.29, 15), new GasMeasurements(240, -33.2, -27.7, 2.8, 0.0276, 0.406, 21), new GasMeasurements(245, -28.2, -18.7, 3.8, 0.0375, 0.551, 28.5), new GasMeasurements(250, -23.2, -9.67, 5.3, 0.0523, 0.769, 39.8), new GasMeasurements(250.9, -22.3, -8.14, 5.33, 0.0526, 0.773, 40), new GasMeasurements(255, -18.2, -0.67, 7.1, 0.0701, 1.03, 53.3), new GasMeasurements(260, -13.2, 8.33, 9.5, 0.0938, 1.38, 71.3), new GasMeasurements(265, -8.15, 17.3, 12.4, 0.1224, 1.798, 93.01), new GasMeasurements(266.9, -6.3, 20.7, 13.33, 0.1316, 1.934, 100), new GasMeasurements(270, -3.15, 26.3, 16.1, 0.1589, 2.335, 120.8), new GasMeasurements(275, 1.85, 35.3, 20.7, 0.2043, 3.002, 155.3), new GasMeasurements(280, 6.85, 44.3, 26.3, 0.2596, 3.815, 197.3), new GasMeasurements(285, 11.9, 53.3, 33, 0.3257, 4.786, 247.5), new GasMeasurements(290, 16.9, 62.3, 41.1, 0.4056, 5.961, 308.3), new GasMeasurements(295, 21.9, 71.3, 50.8, 0.5014, 7.368, 381), new GasMeasurements(297.3, 24.1, 75.4, 53.33, 0.5263, 7.735, 400), new GasMeasurements(300, 26.9, 80.3, 62.1, 0.6129, 9.007, 465.8), new GasMeasurements(313.9, 40.7, 105, 101.3, 1, 14.7, 760) }; ObjectProvider objProvider = new ObjectProvider(data); chart1.getDataSourceSettings().setDataSource(objProvider); }public static class GasMeasurements { public GasMeasurements(double k, double c, double f, double kPa, double atm, double psi, double torr){ this.setK(k); this.setC(c); this.setF(f); this.setKPa(kPa); this.setAtm(atm); this.setPsi(psi); this.setTorr(torr); } private double privateK; public final double getK() { return privateK; } public final void setK(double value) { privateK = value; } private double privateC; public final double getC() { return privateC; } public final void setC(double value) { privateC = value; } private double privateF; public final double getF() { return privateF; } public final void setF(double value) { privateF = value; } private double privateKPa; public final double getKPa() { return privateKPa; } public final void setKPa(double value) { privateKPa = value; } private double privateAtm; public final double getAtm() { return privateAtm; } public final void setAtm(double value) { privateAtm = value; } private double privatePsi; public final double getPsi() { return privatePsi; } public final void setPsi(double value) { privatePsi = value; } private double privateTorr; public final double getTorr() { return privateTorr; } public final void setTorr(double value) { privateTorr = value; } }
-
getAxisY2
public AxisY getAxisY2()
Assigns properties specifically to the secondary Y axis of the chart.
PopulateCompanyDataBubble_Strength_PE(chart1);
chart1.getTitles().add(new TitleDockable("Companies Fundamentals"));
chart1.getAxisY().getLabelsFormat().setDecimals(2);
chart1.getData().setSeries(2);
SeriesAttributes series1;
series1 = chart1.getSeries().get(1);
series1.setAxisY(chart1.getAxisY2());
series1.setGallery(Gallery.BAR);
chart1.getAxisY2().getGrids().getMajor().setTickMark(TickMark.NONE);
chart1.getAxisY2().setTextColor(series1.getColor());
public static void PopulateCompanyDataBubble_Strength_PE(Chart chart1) { CompanyDataBubble[] companyData = new CompanyDataBubble[]{ new CompanyDataBubble("DODC", 0.97, 85, 39), new CompanyDataBubble("HPLA", 0.75, 74, 54), new CompanyDataBubble("FSTW", 0.73, 74, 23), new CompanyDataBubble("HYSL", 0.83, 72, 55), new CompanyDataBubble("COOG", 0.82, 68, 52), new CompanyDataBubble("JDEC", 0.64, 68, 37), new CompanyDataBubble("OTEX", 0.65, 65, 22), new CompanyDataBubble("NTIQ", 0.52, 60, 24), new CompanyDataBubble("OOGN", 0.59, 58, 39), new CompanyDataBubble("ORCL", 0.54, 58, 65), new CompanyDataBubble("SY", 0.71, 58, 7), new CompanyDataBubble("PRGS", 0.69, 57, 19), new CompanyDataBubble("TALX", 0.34, 54, 16), new CompanyDataBubble("TTS", 0.38, 54, 4), new CompanyDataBubble("PRSE", 0.44, 50, 6), new CompanyDataBubble("BCBJ", 0.37, 48, 0), new CompanyDataBubble("DCTM", 0.53, 46, 67), new CompanyDataBubble("ULCM", 0.31, 44, 71), new CompanyDataBubble("MERQ", 0.56, 43, 38), new CompanyDataBubble("ATRS", 0.78, 42, 0), new CompanyDataBubble("JDAS", 0.34, 41, 32), new CompanyDataBubble("SAP", 0.48, 40, 11), new CompanyDataBubble("VRTY", 0.49, 39, 80), new CompanyDataBubble("PSFT", 0.38, 38, 42), new CompanyDataBubble("SRNA", 0.35, 36, 39), new CompanyDataBubble("SPSS", 0.58, 36, 18), new CompanyDataBubble("QSFT", 0.32, 35, 68), new CompanyDataBubble("PTEC", 0.51, 34, 10), new CompanyDataBubble("BMC", 0.58, 32, 37), new CompanyDataBubble("CTXS", 0.16, 32, 9), new CompanyDataBubble("PDFS", 0.22, 31, 18), new CompanyDataBubble("MRCL", 0.3, 30, 22), new CompanyDataBubble("CA", 0.24, 30, 33), new CompanyDataBubble("VRTS", 0.36, 29, 12), new CompanyDataBubble("TIBX", 0.31, 28, 6), new CompanyDataBubble("LTBG", 0.47, 23, 18), new CompanyDataBubble("RATL", 0.26, 23, 23), new CompanyDataBubble("SEBL", 0.23, 19, 15), new CompanyDataBubble("LWSN", 0.27, 16, 13) }; ObjectProvider objProvider = new ObjectProvider(companyData); chart1.getDataSourceSettings().setDataSource(objProvider); // Since not all the fields in the DataSource are required, we must specify the number // of series that will be contained in the chart and perform the corresponding bindings chart1.getData().setSeries(2); NumericDataField numericFieldStrength = new NumericDataField(); numericFieldStrength.setDataPath("Strength"); chart1.getDataSourceSettings().getDataFields().add(numericFieldStrength); chart1.getSeries().get(0).getBindings().setY(numericFieldStrength); NumericDataField numericFieldPE = new NumericDataField(); numericFieldPE.setDataPath("PE"); chart1.getDataSourceSettings().getDataFields().add(numericFieldPE); chart1.getSeries().get(1).getBindings().setY(numericFieldPE); StringDataField stringFieldMonth = new StringDataField(); stringFieldMonth.setDataPath("Symbol"); chart1.getDataSourceSettings().getDataFields().add(stringFieldMonth); chart1.getAxisX().getBindings().setLabel(stringFieldMonth); }public static void PopulateCompanyDataBubble(Chart chart1) { CompanyDataBubble[] companyData = new CompanyDataBubble[]{ new CompanyDataBubble("DODC", 0.97, 85, 39), new CompanyDataBubble("HPLA", 0.75, 74, 54), new CompanyDataBubble("FSTW", 0.73, 74, 23), new CompanyDataBubble("HYSL", 0.83, 72, 55), new CompanyDataBubble("COOG", 0.82, 68, 52), new CompanyDataBubble("JDEC", 0.64, 68, 37), new CompanyDataBubble("OTEX", 0.65, 65, 22), new CompanyDataBubble("NTIQ", 0.52, 60, 24), new CompanyDataBubble("OOGN", 0.59, 58, 39), new CompanyDataBubble("ORCL", 0.54, 58, 65), new CompanyDataBubble("SY", 0.71, 58, 7), new CompanyDataBubble("PRGS", 0.69, 57, 19), new CompanyDataBubble("TALX", 0.34, 54, 16), new CompanyDataBubble("TTS", 0.38, 54, 4), new CompanyDataBubble("PRSE", 0.44, 50, 6), new CompanyDataBubble("BCBJ", 0.37, 48, 0), new CompanyDataBubble("DCTM", 0.53, 46, 67), new CompanyDataBubble("ULCM", 0.31, 44, 71), new CompanyDataBubble("MERQ", 0.56, 43, 38), new CompanyDataBubble("ATRS", 0.78, 42, 0), new CompanyDataBubble("JDAS", 0.34, 41, 32), new CompanyDataBubble("SAP", 0.48, 40, 11), new CompanyDataBubble("VRTY", 0.49, 39, 80), new CompanyDataBubble("PSFT", 0.38, 38, 42), new CompanyDataBubble("SRNA", 0.35, 36, 39), new CompanyDataBubble("SPSS", 0.58, 36, 18), new CompanyDataBubble("QSFT", 0.32, 35, 68), new CompanyDataBubble("PTEC", 0.51, 34, 10), new CompanyDataBubble("BMC", 0.58, 32, 37), new CompanyDataBubble("CTXS", 0.16, 32, 9), new CompanyDataBubble("PDFS", 0.22, 31, 18), new CompanyDataBubble("MRCL", 0.3, 30, 22), new CompanyDataBubble("CA", 0.24, 30, 33), new CompanyDataBubble("VRTS", 0.36, 29, 12), new CompanyDataBubble("TIBX", 0.31, 28, 6), new CompanyDataBubble("LTBG", 0.47, 23, 18), new CompanyDataBubble("RATL", 0.26, 23, 23), new CompanyDataBubble("SEBL", 0.23, 19, 15), new CompanyDataBubble("LWSN", 0.27, 16, 13) }; ObjectProvider objProvider = new ObjectProvider(companyData); chart1.getDataSourceSettings().setDataSource(objProvider); DataFieldCollection dataFieldCollection = chart1.getDataSourceSettings().getDataFields(); StringDataField dfSymbol = new StringDataField(); dfSymbol.setDataPath("Symbol"); NumericDataField dfStrength = new NumericDataField(); dfStrength.setDataPath("Strength"); NumericDataField dfRank = new NumericDataField(); dfRank.setDataPath("Rank"); NumericDataField dfPE = new NumericDataField(); dfPE.setDataPath("PE"); dataFieldCollection.add(dfSymbol); dataFieldCollection.add(dfStrength); dataFieldCollection.add(dfRank); dataFieldCollection.add(dfPE); chart1.getData().setSeries(2); SeriesBindings series0Bindings = chart1.getSeries().get(0).getBindings(); SeriesBindings series1Bindings = chart1.getSeries().get(1).getBindings(); series0Bindings.setX(dfStrength); series1Bindings.setX(dfStrength); series0Bindings.setY(dfRank); series1Bindings.setY(dfPE); chart1.getDataSourceSettings().readData(); }public static class CompanyDataBubble { public CompanyDataBubble(String symbol, double strengh, double rank, double pe) { this.setSymbol(symbol); this.setStrength(strengh); this.setRank(rank); this.setPE(pe); } private String privateSymbol; public final String getSymbol() { return privateSymbol; } public final void setSymbol(String value) { privateSymbol = value; } private double privateStrength; public final double getStrength() { return privateStrength; } public final void setStrength(double value) { privateStrength = value; } private double privateRank; public final double getRank() { return privateRank; } public final void setRank(double value) { privateRank = value; } private double privatePE; public final double getPE() { return privatePE; } public final void setPE(double value) { privatePE = value; } }
-
getBackColor
public java.awt.Color getBackColor()
Gets or sets the background color of the chart.
You can customize the color of the inside charting area by using the
setPlotAreaColormethod.Setting the BackColor to transparent is only supported when generating PNG images using the Chart FX web control. The
setBackColormethod cannot be set to transparent when developing Chart FX desktop applications.A gradient may be assigned to the background using the
setChartBackgroundmethod.For more information regarding the Color type, please refer to the Java Documentation.
Here the BackColor of the Chart has been set to Yellow:
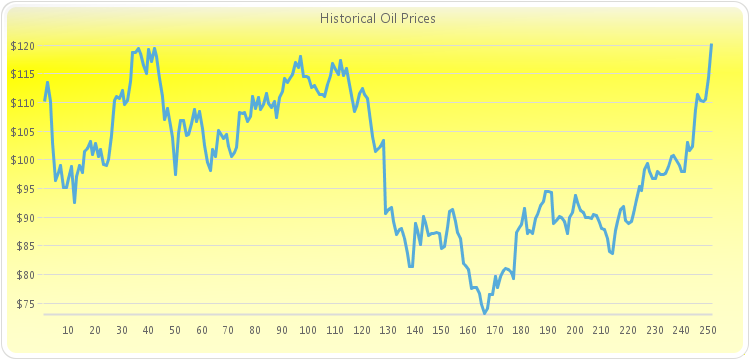
PopulateOilPriceandEuroRate(chart1,"Price");
chart1.getTitles().add(new TitleDockable("Historical Oil Prices"));
chart1.getAxisY().setForceZero(false);
chart1.getAxisY().getLabelsFormat().setFormat(AxisFormat.CURRENCY);
chart1.getAllSeries().setMarkerShape(MarkerShape.NONE);
chart1.getLegendBox().setVisible(false);
chart1.setBackColor(new java.awt.Color(255,255,0,255));
public static void PopulateOilPriceandEuroRate(Chart chart1, String fieldNames) { OilPriceandEuroRate[] data = new OilPriceandEuroRate[] { new OilPriceandEuroRate(new java.util.GregorianCalendar(2011, 8, 19).getTime(), 110.12, 1.3636), new OilPriceandEuroRate(new java.util.GregorianCalendar(2011, 8, 20).getTime(), 113.45, 1.3697), new OilPriceandEuroRate(new java.util.GregorianCalendar(2011, 8, 21).getTime(), 110.21, 1.3724), new OilPriceandEuroRate(new java.util.GregorianCalendar(2011, 8, 22).getTime(), 102.94, 1.3446), new OilPriceandEuroRate(new java.util.GregorianCalendar(2011, 8, 23).getTime(), 96.42, 1.3518), new OilPriceandEuroRate(new java.util.GregorianCalendar(2011, 8, 26).getTime(), 97.84, 1.3516), new OilPriceandEuroRate(new java.util.GregorianCalendar(2011, 8, 27).getTime(), 99.09, 1.3606), new OilPriceandEuroRate(new java.util.GregorianCalendar(2011, 8, 28).getTime(), 95.21, 1.3628), new OilPriceandEuroRate(new java.util.GregorianCalendar(2011, 8, 29).getTime(), 95.17, 1.3639), new OilPriceandEuroRate(new java.util.GregorianCalendar(2011, 8, 30).getTime(), 96.72, 1.3449), new OilPriceandEuroRate(new java.util.GregorianCalendar(2011, 9, 3).getTime(), 98.85, 1.3281), new OilPriceandEuroRate(new java.util.GregorianCalendar(2011, 9, 4).getTime(), 92.61, 1.3294), new OilPriceandEuroRate(new java.util.GregorianCalendar(2011, 9, 5).getTime(), 97.1, 1.3328), new OilPriceandEuroRate(new java.util.GregorianCalendar(2011, 9, 6).getTime(), 98.95, 1.3408), new OilPriceandEuroRate(new java.util.GregorianCalendar(2011, 9, 7).getTime(), 97.71, 1.3512), new OilPriceandEuroRate(new java.util.GregorianCalendar(2011, 9, 10).getTime(), 101.37, 1.3584), new OilPriceandEuroRate(new java.util.GregorianCalendar(2011, 9, 11).getTime(), 102, 1.3657), new OilPriceandEuroRate(new java.util.GregorianCalendar(2011, 9, 12).getTime(), 103.21, 1.3805), new OilPriceandEuroRate(new java.util.GregorianCalendar(2011, 9, 13).getTime(), 100.86, 1.373), new OilPriceandEuroRate(new java.util.GregorianCalendar(2011, 9, 14).getTime(), 102.85, 1.3861), new OilPriceandEuroRate(new java.util.GregorianCalendar(2011, 9, 17).getTime(), 100.66, 1.377), new OilPriceandEuroRate(new java.util.GregorianCalendar(2011, 9, 18).getTime(), 101.73, 1.3719), new OilPriceandEuroRate(new java.util.GregorianCalendar(2011, 9, 19).getTime(), 99.25, 1.3775), new OilPriceandEuroRate(new java.util.GregorianCalendar(2011, 9, 20).getTime(), 99.02, 1.3672), new OilPriceandEuroRate(new java.util.GregorianCalendar(2011, 9, 21).getTime(), 100.04, 1.3873), new OilPriceandEuroRate(new java.util.GregorianCalendar(2011, 9, 24).getTime(), 104.31, 1.3932), new OilPriceandEuroRate(new java.util.GregorianCalendar(2011, 9, 25).getTime(), 110.38, 1.3911), new OilPriceandEuroRate(new java.util.GregorianCalendar(2011, 9, 26).getTime(), 111.04, 1.3838), new OilPriceandEuroRate(new java.util.GregorianCalendar(2011, 9, 27).getTime(), 110.72, 1.4172), new OilPriceandEuroRate(new java.util.GregorianCalendar(2011, 9, 28).getTime(), 112.14, 1.4164), new OilPriceandEuroRate(new java.util.GregorianCalendar(2011, 9, 31).getTime(), 109.57, 1.3947), new OilPriceandEuroRate(new java.util.GregorianCalendar(2011, 10, 1).getTime(), 110.28, 1.3676), new OilPriceandEuroRate(new java.util.GregorianCalendar(2011, 10, 2).getTime(), 113.72, 1.3803), new OilPriceandEuroRate(new java.util.GregorianCalendar(2011, 10, 3).getTime(), 118.74, 1.3744), new OilPriceandEuroRate(new java.util.GregorianCalendar(2011, 10, 4).getTime(), 118.66, 1.3761), new OilPriceandEuroRate(new java.util.GregorianCalendar(2011, 10, 7).getTime(), 119.41, 1.3744), new OilPriceandEuroRate(new java.util.GregorianCalendar(2011, 10, 8).getTime(), 118.57, 1.3785), new OilPriceandEuroRate(new java.util.GregorianCalendar(2011, 10, 9).getTime(), 116.46, 1.3596), new OilPriceandEuroRate(new java.util.GregorianCalendar(2011, 10, 10).getTime(), 115.07, 1.36), new OilPriceandEuroRate(new java.util.GregorianCalendar(2011, 10, 11).getTime(), 119.29, 1.3612), new OilPriceandEuroRate(new java.util.GregorianCalendar(2011, 10, 14).getTime(), 117.1, 1.3625), new OilPriceandEuroRate(new java.util.GregorianCalendar(2011, 10, 15).getTime(), 119.44, 1.3524), new OilPriceandEuroRate(new java.util.GregorianCalendar(2011, 10, 16).getTime(), 117.97, 1.3505), new OilPriceandEuroRate(new java.util.GregorianCalendar(2011, 10, 17).getTime(), 114.19, 1.3522), new OilPriceandEuroRate(new java.util.GregorianCalendar(2011, 10, 18).getTime(), 111.01, 1.3521), new OilPriceandEuroRate(new java.util.GregorianCalendar(2011, 10, 21).getTime(), 107.04, 1.3525), new OilPriceandEuroRate(new java.util.GregorianCalendar(2011, 10, 22).getTime(), 109.04, 1.35), new OilPriceandEuroRate(new java.util.GregorianCalendar(2011, 10, 23).getTime(), 105.93, 1.3347), new OilPriceandEuroRate(new java.util.GregorianCalendar(2011, 10, 25).getTime(), 103.88, 1.3244), new OilPriceandEuroRate(new java.util.GregorianCalendar(2011, 10, 28).getTime(), 97.46, 1.3334), new OilPriceandEuroRate(new java.util.GregorianCalendar(2011, 10, 29).getTime(), 104.51, 1.3343), new OilPriceandEuroRate(new java.util.GregorianCalendar(2011, 10, 30).getTime(), 106.91, 1.3453), new OilPriceandEuroRate(new java.util.GregorianCalendar(2011, 11, 1).getTime(), 106.83, 1.3487), new OilPriceandEuroRate(new java.util.GregorianCalendar(2011, 11, 2).getTime(), 104.26, 1.3386), new OilPriceandEuroRate(new java.util.GregorianCalendar(2011, 11, 5).getTime(), 104.38, 1.3463), new OilPriceandEuroRate(new java.util.GregorianCalendar(2011, 11, 6).getTime(), 106.38, 1.3397), new OilPriceandEuroRate(new java.util.GregorianCalendar(2011, 11, 7).getTime(), 108.8, 1.3386), new OilPriceandEuroRate(new java.util.GregorianCalendar(2011, 11, 8).getTime(), 106.65, 1.3324), new OilPriceandEuroRate(new java.util.GregorianCalendar(2011, 11, 9).getTime(), 108.51, 1.3368), new OilPriceandEuroRate(new java.util.GregorianCalendar(2011, 11, 12).getTime(), 105.47, 1.3188), new OilPriceandEuroRate(new java.util.GregorianCalendar(2011, 11, 13).getTime(), 102.53, 1.3094), new OilPriceandEuroRate(new java.util.GregorianCalendar(2011, 11, 14).getTime(), 99.57, 1.2972), new OilPriceandEuroRate(new java.util.GregorianCalendar(2011, 11, 15).getTime(), 98.21, 1.3013), new OilPriceandEuroRate(new java.util.GregorianCalendar(2011, 11, 16).getTime(), 101.8, 1.3025), new OilPriceandEuroRate(new java.util.GregorianCalendar(2011, 11, 19).getTime(), 100.62, 1.3017), new OilPriceandEuroRate(new java.util.GregorianCalendar(2011, 11, 20).getTime(), 105.12, 1.3076), new OilPriceandEuroRate(new java.util.GregorianCalendar(2011, 11, 21).getTime(), 104.64, 1.304), new OilPriceandEuroRate(new java.util.GregorianCalendar(2011, 11, 22).getTime(), 103.74, 1.3045), new OilPriceandEuroRate(new java.util.GregorianCalendar(2011, 11, 23).getTime(), 104.35, 1.304), new OilPriceandEuroRate(new java.util.GregorianCalendar(2011, 11, 27).getTime(), 102.38, 1.3074), new OilPriceandEuroRate(new java.util.GregorianCalendar(2011, 11, 28).getTime(), 100.51, 1.2926), new OilPriceandEuroRate(new java.util.GregorianCalendar(2011, 11, 29).getTime(), 101.22, 1.2952), new OilPriceandEuroRate(new java.util.GregorianCalendar(2011, 11, 30).getTime(), 102.1, 1.2973), new OilPriceandEuroRate(new java.util.GregorianCalendar(2012, 0, 3).getTime(), 108.29, 1.3061), new OilPriceandEuroRate(new java.util.GregorianCalendar(2012, 0, 4).getTime(), 108.14, 1.293), new OilPriceandEuroRate(new java.util.GregorianCalendar(2012, 0, 5).getTime(), 108.27, 1.2783), new OilPriceandEuroRate(new java.util.GregorianCalendar(2012, 0, 6).getTime(), 106.74, 1.2723), new OilPriceandEuroRate(new java.util.GregorianCalendar(2012, 0, 9).getTime(), 107.62, 1.2745), new OilPriceandEuroRate(new java.util.GregorianCalendar(2012, 0, 10).getTime(), 110.97, 1.2782), new OilPriceandEuroRate(new java.util.GregorianCalendar(2012, 0, 11).getTime(), 108.89, 1.2686), new OilPriceandEuroRate(new java.util.GregorianCalendar(2012, 0, 12).getTime(), 110.86, 1.2818), new OilPriceandEuroRate(new java.util.GregorianCalendar(2012, 0, 13).getTime(), 108.83, 1.2682), new OilPriceandEuroRate(new java.util.GregorianCalendar(2012, 0, 17).getTime(), 109.64, 1.274), new OilPriceandEuroRate(new java.util.GregorianCalendar(2012, 0, 18).getTime(), 111.54, 1.2825), new OilPriceandEuroRate(new java.util.GregorianCalendar(2012, 0, 19).getTime(), 109.85, 1.2937), new OilPriceandEuroRate(new java.util.GregorianCalendar(2012, 0, 20).getTime(), 109.13, 1.2948), new OilPriceandEuroRate(new java.util.GregorianCalendar(2012, 0, 23).getTime(), 110.11, 1.3035), new OilPriceandEuroRate(new java.util.GregorianCalendar(2012, 0, 24).getTime(), 107.3, 1.3004), new OilPriceandEuroRate(new java.util.GregorianCalendar(2012, 0, 25).getTime(), 110.82, 1.2978), new OilPriceandEuroRate(new java.util.GregorianCalendar(2012, 0, 26).getTime(), 111.94, 1.3152), new OilPriceandEuroRate(new java.util.GregorianCalendar(2012, 0, 27).getTime(), 114.24, 1.3192), new OilPriceandEuroRate(new java.util.GregorianCalendar(2012, 0, 30).getTime(), 113.42, 1.3123), new OilPriceandEuroRate(new java.util.GregorianCalendar(2012, 0, 31).getTime(), 114.41, 1.3053), new OilPriceandEuroRate(new java.util.GregorianCalendar(2012, 1, 1).getTime(), 114.84, 1.3179), new OilPriceandEuroRate(new java.util.GregorianCalendar(2012, 1, 2).getTime(), 116.97, 1.3167), new OilPriceandEuroRate(new java.util.GregorianCalendar(2012, 1, 3).getTime(), 116.17, 1.3106), new OilPriceandEuroRate(new java.util.GregorianCalendar(2012, 1, 6).getTime(), 118.01, 1.313), new OilPriceandEuroRate(new java.util.GregorianCalendar(2012, 1, 7).getTime(), 114.6, 1.3244), new OilPriceandEuroRate(new java.util.GregorianCalendar(2012, 1, 8).getTime(), 114.56, 1.3253), new OilPriceandEuroRate(new java.util.GregorianCalendar(2012, 1, 9).getTime(), 114.45, 1.3297), new OilPriceandEuroRate(new java.util.GregorianCalendar(2012, 1, 10).getTime(), 112.56, 1.3187), new OilPriceandEuroRate(new java.util.GregorianCalendar(2012, 1, 13).getTime(), 112.92, 1.3211), new OilPriceandEuroRate(new java.util.GregorianCalendar(2012, 1, 14).getTime(), 112.27, 1.3149), new OilPriceandEuroRate(new java.util.GregorianCalendar(2012, 1, 15).getTime(), 111.36, 1.3087), new OilPriceandEuroRate(new java.util.GregorianCalendar(2012, 1, 16).getTime(), 111.38, 1.311), new OilPriceandEuroRate(new java.util.GregorianCalendar(2012, 1, 17).getTime(), 111.05, 1.3149), new OilPriceandEuroRate(new java.util.GregorianCalendar(2012, 1, 21).getTime(), 113.06, 1.3255), new OilPriceandEuroRate(new java.util.GregorianCalendar(2012, 1, 22).getTime(), 114.74, 1.3251), new OilPriceandEuroRate(new java.util.GregorianCalendar(2012, 1, 23).getTime(), 116.88, 1.3308), new OilPriceandEuroRate(new java.util.GregorianCalendar(2012, 1, 24).getTime(), 115.73, 1.3463), new OilPriceandEuroRate(new java.util.GregorianCalendar(2012, 1, 27).getTime(), 114.86, 1.341), new OilPriceandEuroRate(new java.util.GregorianCalendar(2012, 1, 28).getTime(), 117.41, 1.3452), new OilPriceandEuroRate(new java.util.GregorianCalendar(2012, 1, 29).getTime(), 114.73, 1.3359), new OilPriceandEuroRate(new java.util.GregorianCalendar(2012, 2, 1).getTime(), 115.98, 1.332), new OilPriceandEuroRate(new java.util.GregorianCalendar(2012, 2, 2).getTime(), 114.02, 1.3202), new OilPriceandEuroRate(new java.util.GregorianCalendar(2012, 2, 5).getTime(), 111.17, 1.3226), new OilPriceandEuroRate(new java.util.GregorianCalendar(2012, 2, 6).getTime(), 108.48, 1.3114), new OilPriceandEuroRate(new java.util.GregorianCalendar(2012, 2, 7).getTime(), 109.3, 1.3149), new OilPriceandEuroRate(new java.util.GregorianCalendar(2012, 2, 8).getTime(), 111.66, 1.3256), new OilPriceandEuroRate(new java.util.GregorianCalendar(2012, 2, 9).getTime(), 112.41, 1.3108), new OilPriceandEuroRate(new java.util.GregorianCalendar(2012, 2, 12).getTime(), 111.38, 1.3141), new OilPriceandEuroRate(new java.util.GregorianCalendar(2012, 2, 13).getTime(), 110.62, 1.3109), new OilPriceandEuroRate(new java.util.GregorianCalendar(2012, 2, 14).getTime(), 106.67, 1.3025), new OilPriceandEuroRate(new java.util.GregorianCalendar(2012, 2, 15).getTime(), 104.01, 1.307), new OilPriceandEuroRate(new java.util.GregorianCalendar(2012, 2, 16).getTime(), 101.49, 1.3171), new OilPriceandEuroRate(new java.util.GregorianCalendar(2012, 2, 19).getTime(), 101.97, 1.3242), new OilPriceandEuroRate(new java.util.GregorianCalendar(2012, 2, 20).getTime(), 102.35, 1.3222), new OilPriceandEuroRate(new java.util.GregorianCalendar(2012, 2, 21).getTime(), 103.4, 1.319), new OilPriceandEuroRate(new java.util.GregorianCalendar(2012, 2, 22).getTime(), 90.6, 1.3194), new OilPriceandEuroRate(new java.util.GregorianCalendar(2012, 2, 23).getTime(), 91.32, 1.3263), new OilPriceandEuroRate(new java.util.GregorianCalendar(2012, 2, 26).getTime(), 91.62, 1.3328), new OilPriceandEuroRate(new java.util.GregorianCalendar(2012, 2, 27).getTime(), 89.26, 1.3336), new OilPriceandEuroRate(new java.util.GregorianCalendar(2012, 2, 28).getTime(), 86.96, 1.33), new OilPriceandEuroRate(new java.util.GregorianCalendar(2012, 2, 29).getTime(), 87.84, 1.3265), new OilPriceandEuroRate(new java.util.GregorianCalendar(2012, 2, 30).getTime(), 87.98, 1.3334), new OilPriceandEuroRate(new java.util.GregorianCalendar(2012, 3, 2).getTime(), 86.33, 1.3325), new OilPriceandEuroRate(new java.util.GregorianCalendar(2012, 3, 3).getTime(), 83.61, 1.3337), new OilPriceandEuroRate(new java.util.GregorianCalendar(2012, 3, 4).getTime(), 81.31, 1.3126), new OilPriceandEuroRate(new java.util.GregorianCalendar(2012, 3, 5).getTime(), 81.44, 1.3064), new OilPriceandEuroRate(new java.util.GregorianCalendar(2012, 3, 9).getTime(), 88.9, 1.3087), new OilPriceandEuroRate(new java.util.GregorianCalendar(2012, 3, 10).getTime(), 87.74, 1.3068), new OilPriceandEuroRate(new java.util.GregorianCalendar(2012, 3, 11).getTime(), 85.29, 1.3104), new OilPriceandEuroRate(new java.util.GregorianCalendar(2012, 3, 12).getTime(), 90.11, 1.3171), new OilPriceandEuroRate(new java.util.GregorianCalendar(2012, 3, 13).getTime(), 89.04, 1.3082), new OilPriceandEuroRate(new java.util.GregorianCalendar(2012, 3, 16).getTime(), 86.79, 1.3067), new OilPriceandEuroRate(new java.util.GregorianCalendar(2012, 3, 17).getTime(), 87.09, 1.3123), new OilPriceandEuroRate(new java.util.GregorianCalendar(2012, 3, 18).getTime(), 87.2, 1.3122), new OilPriceandEuroRate(new java.util.GregorianCalendar(2012, 3, 19).getTime(), 87.27, 1.3132), new OilPriceandEuroRate(new java.util.GregorianCalendar(2012, 3, 20).getTime(), 87.13, 1.3212), new OilPriceandEuroRate(new java.util.GregorianCalendar(2012, 3, 23).getTime(), 84.53, 1.3129), new OilPriceandEuroRate(new java.util.GregorianCalendar(2012, 3, 24).getTime(), 84.86, 1.3207), new OilPriceandEuroRate(new java.util.GregorianCalendar(2012, 3, 25).getTime(), 88.21, 1.321), new OilPriceandEuroRate(new java.util.GregorianCalendar(2012, 3, 26).getTime(), 91.01, 1.3232), new OilPriceandEuroRate(new java.util.GregorianCalendar(2012, 3, 27).getTime(), 91.4, 1.3248), new OilPriceandEuroRate(new java.util.GregorianCalendar(2012, 3, 30).getTime(), 89.15, 1.3229), new OilPriceandEuroRate(new java.util.GregorianCalendar(2012, 4, 1).getTime(), 87.35, 1.3226), new OilPriceandEuroRate(new java.util.GregorianCalendar(2012, 4, 2).getTime(), 86.32, 1.3154), new OilPriceandEuroRate(new java.util.GregorianCalendar(2012, 4, 3).getTime(), 81.89, 1.3147), new OilPriceandEuroRate(new java.util.GregorianCalendar(2012, 4, 4).getTime(), 81.62, 1.3091), new OilPriceandEuroRate(new java.util.GregorianCalendar(2012, 4, 7).getTime(), 80.92, 1.3052), new OilPriceandEuroRate(new java.util.GregorianCalendar(2012, 4, 8).getTime(), 77.61, 1.3015), new OilPriceandEuroRate(new java.util.GregorianCalendar(2012, 4, 9).getTime(), 77.7, 1.2954), new OilPriceandEuroRate(new java.util.GregorianCalendar(2012, 4, 10).getTime(), 77.67, 1.2959), new OilPriceandEuroRate(new java.util.GregorianCalendar(2012, 4, 11).getTime(), 76.72, 1.2937), new OilPriceandEuroRate(new java.util.GregorianCalendar(2012, 4, 14).getTime(), 74.68, 1.2847), new OilPriceandEuroRate(new java.util.GregorianCalendar(2012, 4, 15).getTime(), 73.13, 1.2769), new OilPriceandEuroRate(new java.util.GregorianCalendar(2012, 4, 16).getTime(), 74.03, 1.273), new OilPriceandEuroRate(new java.util.GregorianCalendar(2012, 4, 17).getTime(), 76.55, 1.2709), new OilPriceandEuroRate(new java.util.GregorianCalendar(2012, 4, 18).getTime(), 76.45, 1.2721), new OilPriceandEuroRate(new java.util.GregorianCalendar(2012, 4, 21).getTime(), 79.63, 1.2769), new OilPriceandEuroRate(new java.util.GregorianCalendar(2012, 4, 22).getTime(), 77.65, 1.2735), new OilPriceandEuroRate(new java.util.GregorianCalendar(2012, 4, 23).getTime(), 79.7, 1.2569), new OilPriceandEuroRate(new java.util.GregorianCalendar(2012, 4, 24).getTime(), 80.75, 1.2583), new OilPriceandEuroRate(new java.util.GregorianCalendar(2012, 4, 25).getTime(), 80.96, 1.2518), new OilPriceandEuroRate(new java.util.GregorianCalendar(2012, 4, 29).getTime(), 80.8, 1.2488), new OilPriceandEuroRate(new java.util.GregorianCalendar(2012, 4, 30).getTime(), 80.41, 1.2405), new OilPriceandEuroRate(new java.util.GregorianCalendar(2012, 4, 31).getTime(), 79.35, 1.2364), new OilPriceandEuroRate(new java.util.GregorianCalendar(2012, 5, 1).getTime(), 87.26, 1.242), new OilPriceandEuroRate(new java.util.GregorianCalendar(2012, 5, 4).getTime(), 88.13, 1.2495), new OilPriceandEuroRate(new java.util.GregorianCalendar(2012, 5, 5).getTime(), 88.63, 1.2437), new OilPriceandEuroRate(new java.util.GregorianCalendar(2012, 5, 6).getTime(), 91.52, 1.2535), new OilPriceandEuroRate(new java.util.GregorianCalendar(2012, 5, 7).getTime(), 87.11, 1.2568), new OilPriceandEuroRate(new java.util.GregorianCalendar(2012, 5, 8).getTime(), 87.59, 1.2482), new OilPriceandEuroRate(new java.util.GregorianCalendar(2012, 5, 11).getTime(), 87.18, 1.2504), new OilPriceandEuroRate(new java.util.GregorianCalendar(2012, 5, 12).getTime(), 89.78, 1.2477), new OilPriceandEuroRate(new java.util.GregorianCalendar(2012, 5, 13).getTime(), 90.54, 1.2596), new OilPriceandEuroRate(new java.util.GregorianCalendar(2012, 5, 14).getTime(), 91.99, 1.2608), new OilPriceandEuroRate(new java.util.GregorianCalendar(2012, 5, 15).getTime(), 92.7, 1.2633), new OilPriceandEuroRate(new java.util.GregorianCalendar(2012, 5, 18).getTime(), 94.41, 1.2578), new OilPriceandEuroRate(new java.util.GregorianCalendar(2012, 5, 19).getTime(), 94.43, 1.2692), new OilPriceandEuroRate(new java.util.GregorianCalendar(2012, 5, 20).getTime(), 94.27, 1.2703), new OilPriceandEuroRate(new java.util.GregorianCalendar(2012, 5, 21).getTime(), 88.91, 1.2586), new OilPriceandEuroRate(new java.util.GregorianCalendar(2012, 5, 22).getTime(), 89.44, 1.2545), new OilPriceandEuroRate(new java.util.GregorianCalendar(2012, 5, 25).getTime(), 90.14, 1.248), new OilPriceandEuroRate(new java.util.GregorianCalendar(2012, 5, 26).getTime(), 89.89, 1.2471), new OilPriceandEuroRate(new java.util.GregorianCalendar(2012, 5, 27).getTime(), 89.27, 1.2457), new OilPriceandEuroRate(new java.util.GregorianCalendar(2012, 5, 28).getTime(), 87.15, 1.2433), new OilPriceandEuroRate(new java.util.GregorianCalendar(2012, 5, 29).getTime(), 90.01, 1.2668), new OilPriceandEuroRate(new java.util.GregorianCalendar(2012, 6, 2).getTime(), 90.83, 1.2584), new OilPriceandEuroRate(new java.util.GregorianCalendar(2012, 6, 3).getTime(), 93.7, 1.262), new OilPriceandEuroRate(new java.util.GregorianCalendar(2012, 6, 5).getTime(), 92.59, 1.2384), new OilPriceandEuroRate(new java.util.GregorianCalendar(2012, 6, 6).getTime(), 91.21, 1.2283), new OilPriceandEuroRate(new java.util.GregorianCalendar(2012, 6, 9).getTime(), 90.86, 1.2299), new OilPriceandEuroRate(new java.util.GregorianCalendar(2012, 6, 10).getTime(), 89.89, 1.2255), new OilPriceandEuroRate(new java.util.GregorianCalendar(2012, 6, 11).getTime(), 89.89, 1.2244), new OilPriceandEuroRate(new java.util.GregorianCalendar(2012, 6, 12).getTime(), 89.67, 1.2199), new OilPriceandEuroRate(new java.util.GregorianCalendar(2012, 6, 13).getTime(), 90.41, 1.2232), new OilPriceandEuroRate(new java.util.GregorianCalendar(2012, 6, 16).getTime(), 90.31, 1.2267), new OilPriceandEuroRate(new java.util.GregorianCalendar(2012, 6, 17).getTime(), 89.03, 1.2234), new OilPriceandEuroRate(new java.util.GregorianCalendar(2012, 6, 18).getTime(), 88.04, 1.2261), new OilPriceandEuroRate(new java.util.GregorianCalendar(2012, 6, 19).getTime(), 87.82, 1.2257), new OilPriceandEuroRate(new java.util.GregorianCalendar(2012, 6, 20).getTime(), 86.19, 1.2176), new OilPriceandEuroRate(new java.util.GregorianCalendar(2012, 6, 23).getTime(), 83.96, 1.2126), new OilPriceandEuroRate(new java.util.GregorianCalendar(2012, 6, 24).getTime(), 83.73, 1.2062), new OilPriceandEuroRate(new java.util.GregorianCalendar(2012, 6, 25).getTime(), 87.69, 1.2132), new OilPriceandEuroRate(new java.util.GregorianCalendar(2012, 6, 26).getTime(), 89.24, 1.228), new OilPriceandEuroRate(new java.util.GregorianCalendar(2012, 6, 27).getTime(), 91.35, 1.237), new OilPriceandEuroRate(new java.util.GregorianCalendar(2012, 6, 30).getTime(), 91.9, 1.225), new OilPriceandEuroRate(new java.util.GregorianCalendar(2012, 6, 31).getTime(), 89.48, 1.2315), new OilPriceandEuroRate(new java.util.GregorianCalendar(2012, 7, 1).getTime(), 88.84, 1.2299), new OilPriceandEuroRate(new java.util.GregorianCalendar(2012, 7, 2).getTime(), 89.3, 1.2149), new OilPriceandEuroRate(new java.util.GregorianCalendar(2012, 7, 3).getTime(), 90.63, 1.239), new OilPriceandEuroRate(new java.util.GregorianCalendar(2012, 7, 6).getTime(), 93.03, 1.2422), new OilPriceandEuroRate(new java.util.GregorianCalendar(2012, 7, 7).getTime(), 95.3, 1.2422), new OilPriceandEuroRate(new java.util.GregorianCalendar(2012, 7, 8).getTime(), 94.72, 1.2364), new OilPriceandEuroRate(new java.util.GregorianCalendar(2012, 7, 9).getTime(), 98.28, 1.2278), new OilPriceandEuroRate(new java.util.GregorianCalendar(2012, 7, 10).getTime(), 99.41, 1.2298), new OilPriceandEuroRate(new java.util.GregorianCalendar(2012, 7, 13).getTime(), 97.89, 1.2339), new OilPriceandEuroRate(new java.util.GregorianCalendar(2012, 7, 14).getTime(), 96.8, 1.2329), new OilPriceandEuroRate(new java.util.GregorianCalendar(2012, 7, 15).getTime(), 96.69, 1.2288), new OilPriceandEuroRate(new java.util.GregorianCalendar(2012, 7, 16).getTime(), 98.04, 1.2356), new OilPriceandEuroRate(new java.util.GregorianCalendar(2012, 7, 17).getTime(), 97.5, 1.2315), new OilPriceandEuroRate(new java.util.GregorianCalendar(2012, 7, 20).getTime(), 97.37, 1.2343), new OilPriceandEuroRate(new java.util.GregorianCalendar(2012, 7, 21).getTime(), 97.53, 1.2472), new OilPriceandEuroRate(new java.util.GregorianCalendar(2012, 7, 22).getTime(), 98.82, 1.2472), new OilPriceandEuroRate(new java.util.GregorianCalendar(2012, 7, 23).getTime(), 100.53, 1.2583), new OilPriceandEuroRate(new java.util.GregorianCalendar(2012, 7, 24).getTime(), 100.71, 1.2533), new OilPriceandEuroRate(new java.util.GregorianCalendar(2012, 7, 27).getTime(), 99.82, 1.2514), new OilPriceandEuroRate(new java.util.GregorianCalendar(2012, 7, 28).getTime(), 98.98, 1.2564), new OilPriceandEuroRate(new java.util.GregorianCalendar(2012, 7, 29).getTime(), 97.93, 1.2538), new OilPriceandEuroRate(new java.util.GregorianCalendar(2012, 7, 30).getTime(), 97.96, 1.2497), new OilPriceandEuroRate(new java.util.GregorianCalendar(2012, 7, 31).getTime(), 102.97, 1.2578), new OilPriceandEuroRate(new java.util.GregorianCalendar(2012, 8, 4).getTime(), 101.66, 1.2566), new OilPriceandEuroRate(new java.util.GregorianCalendar(2012, 8, 5).getTime(), 102.39, 1.2603), new OilPriceandEuroRate(new java.util.GregorianCalendar(2012, 8, 6).getTime(), 108.7, 1.2626), new OilPriceandEuroRate(new java.util.GregorianCalendar(2012, 8, 7).getTime(), 111.47, 1.2796), new OilPriceandEuroRate(new java.util.GregorianCalendar(2012, 8, 10).getTime(), 110.42, 1.2795), new OilPriceandEuroRate(new java.util.GregorianCalendar(2012, 8, 11).getTime(), 110.23, 1.2858), new OilPriceandEuroRate(new java.util.GregorianCalendar(2012, 8, 12).getTime(), 110.59, 1.2894), new OilPriceandEuroRate(new java.util.GregorianCalendar(2012, 8, 13).getTime(), 114.35, 1.2912), new OilPriceandEuroRate(new java.util.GregorianCalendar(2012, 8, 14).getTime(), 120.34, 1.3142) }; ObjectProvider objProvider = new ObjectProvider(data); chart1.getDataSourceSettings().setDataSource(objProvider); if (fieldNames != "") { List<DataField> removeFields = new ArrayList<DataField>(); List<String> includeFields = Arrays.asList(fieldNames.split(",")); chart1.getDataSourceSettings().fillFromSchema(); for (DataField dataField : chart1.getDataSourceSettings().getDataFields()) { if (dataField.isMeasure() && !includeFields.contains(dataField.getDataPath())) { removeFields.add(dataField); } } for (DataField dataField : removeFields) { chart1.getDataSourceSettings().getDataFields().remove(dataField); } } } public static void PopulateOilPriceandEuroRate(Chart chart1) { PopulateOilPriceandEuroRate(chart1, ""); }public static class OilPriceandEuroRate { private java.util.Date privateTransDate = new java.util.Date(0); public final java.util.Date getTransDate() { return privateTransDate; } public final void setTransDate(java.util.Date value) { privateTransDate = value; } private double privatePrice; public final double getPrice() { return privatePrice; } public final void setPrice(double value) { privatePrice = value; } private double privateEuro; public final double getEuro() { return privateEuro; } public final void setEuro(double value) { privateEuro = value; } public OilPriceandEuroRate(java.util.Date transDate, double price, double euro){ this.setTransDate(transDate); this.setPrice(price); this.setEuro(euro); } }
Change the color of the background to Black using the
SolidBackgroundclass.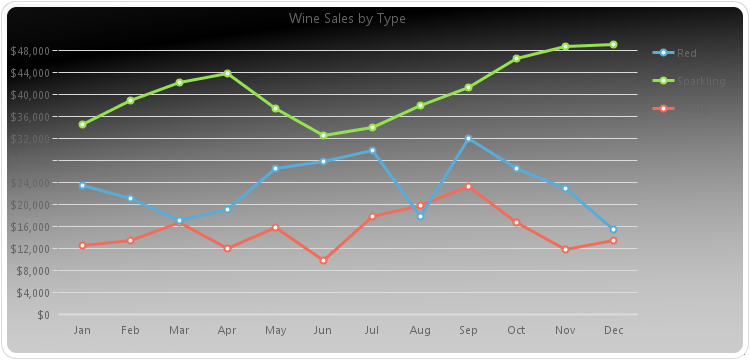
PopulateProductSales(chart1);
chart1.getTitles().add(new TitleDockable("Wine Sales by Type"));
chart1.getAxisY().getLabelsFormat().setFormat(AxisFormat.CURRENCY);
SolidBackground b;
b = new SolidBackground();
b.setColor(new java.awt.Color(0,0,0,255));
chart1.setChartBackground(b);
public static void PopulateProductSales(Chart chart1) { ProductSales[] data = new ProductSales[]{ new ProductSales("Jan", 12560, 23400, 34500), new ProductSales("Feb", 13400, 21000, 38900), new ProductSales("Mar", 16700, 17000, 42100), new ProductSales("Apr", 12000, 19020, 43800), new ProductSales("May", 15800, 26500, 37540), new ProductSales("Jun", 9800, 27800, 32580), new ProductSales("Jul", 17800, 29820, 34000), new ProductSales("Aug", 19800, 17800, 38000), new ProductSales("Sep", 23200, 32000, 41300), new ProductSales("Oct", 16700, 26500, 46590), new ProductSales("Nov", 11800, 23000, 48700), new ProductSales("Dec", 13400, 15400, 49100) }; ObjectProvider objProvider = new ObjectProvider(data); chart1.getDataSourceSettings().setDataSource(objProvider); }public static class ProductSales { public ProductSales(String month, double white, double red, double sparkling) { this.setMonth(month); this.setWhite(white); this.setRed(red); this.setSparkling(sparkling); } private String privateMonth; public final String getMonth() { return privateMonth; } public final void setMonth(String value) { privateMonth = value; } private double privateWhite; public final double getWhite() { return privateWhite; } public final void setWhite(double value) { privateWhite = value; } private double privateRed; public final double getRed() { return privateRed; } public final void setRed(double value) { privateRed = value; } private double privateSparkling; public final double getSparkling() { return privateSparkling; } public final void setSparkling(double value) { privateSparkling = value; } }
Note: Some vector borders may add visual effects on top of the chart, giving the false impression that the background has a gradient.- See Also:
resetBackColor
-
setBackColor
public void setBackColor(java.awt.Color value)
Gets or sets the background color of the chart.
You can customize the color of the inside charting area by using the
setPlotAreaColormethod.Setting the BackColor to transparent is only supported when generating PNG images using the Chart FX web control. The
setBackColormethod cannot be set to transparent when developing Chart FX desktop applications.A gradient may be assigned to the background using the
setChartBackgroundmethod.For more information regarding the Color type, please refer to the Java Documentation.
Here the BackColor of the Chart has been set to Yellow:
PopulateOilPriceandEuroRate(chart1,"Price");
chart1.getTitles().add(new TitleDockable("Historical Oil Prices"));
chart1.getAxisY().setForceZero(false);
chart1.getAxisY().getLabelsFormat().setFormat(AxisFormat.CURRENCY);
chart1.getAllSeries().setMarkerShape(MarkerShape.NONE);
chart1.getLegendBox().setVisible(false);
chart1.setBackColor(new java.awt.Color(255,255,0,255));
public static void PopulateOilPriceandEuroRate(Chart chart1, String fieldNames) { OilPriceandEuroRate[] data = new OilPriceandEuroRate[] { new OilPriceandEuroRate(new java.util.GregorianCalendar(2011, 8, 19).getTime(), 110.12, 1.3636), new OilPriceandEuroRate(new java.util.GregorianCalendar(2011, 8, 20).getTime(), 113.45, 1.3697), new OilPriceandEuroRate(new java.util.GregorianCalendar(2011, 8, 21).getTime(), 110.21, 1.3724), new OilPriceandEuroRate(new java.util.GregorianCalendar(2011, 8, 22).getTime(), 102.94, 1.3446), new OilPriceandEuroRate(new java.util.GregorianCalendar(2011, 8, 23).getTime(), 96.42, 1.3518), new OilPriceandEuroRate(new java.util.GregorianCalendar(2011, 8, 26).getTime(), 97.84, 1.3516), new OilPriceandEuroRate(new java.util.GregorianCalendar(2011, 8, 27).getTime(), 99.09, 1.3606), new OilPriceandEuroRate(new java.util.GregorianCalendar(2011, 8, 28).getTime(), 95.21, 1.3628), new OilPriceandEuroRate(new java.util.GregorianCalendar(2011, 8, 29).getTime(), 95.17, 1.3639), new OilPriceandEuroRate(new java.util.GregorianCalendar(2011, 8, 30).getTime(), 96.72, 1.3449), new OilPriceandEuroRate(new java.util.GregorianCalendar(2011, 9, 3).getTime(), 98.85, 1.3281), new OilPriceandEuroRate(new java.util.GregorianCalendar(2011, 9, 4).getTime(), 92.61, 1.3294), new OilPriceandEuroRate(new java.util.GregorianCalendar(2011, 9, 5).getTime(), 97.1, 1.3328), new OilPriceandEuroRate(new java.util.GregorianCalendar(2011, 9, 6).getTime(), 98.95, 1.3408), new OilPriceandEuroRate(new java.util.GregorianCalendar(2011, 9, 7).getTime(), 97.71, 1.3512), new OilPriceandEuroRate(new java.util.GregorianCalendar(2011, 9, 10).getTime(), 101.37, 1.3584), new OilPriceandEuroRate(new java.util.GregorianCalendar(2011, 9, 11).getTime(), 102, 1.3657), new OilPriceandEuroRate(new java.util.GregorianCalendar(2011, 9, 12).getTime(), 103.21, 1.3805), new OilPriceandEuroRate(new java.util.GregorianCalendar(2011, 9, 13).getTime(), 100.86, 1.373), new OilPriceandEuroRate(new java.util.GregorianCalendar(2011, 9, 14).getTime(), 102.85, 1.3861), new OilPriceandEuroRate(new java.util.GregorianCalendar(2011, 9, 17).getTime(), 100.66, 1.377), new OilPriceandEuroRate(new java.util.GregorianCalendar(2011, 9, 18).getTime(), 101.73, 1.3719), new OilPriceandEuroRate(new java.util.GregorianCalendar(2011, 9, 19).getTime(), 99.25, 1.3775), new OilPriceandEuroRate(new java.util.GregorianCalendar(2011, 9, 20).getTime(), 99.02, 1.3672), new OilPriceandEuroRate(new java.util.GregorianCalendar(2011, 9, 21).getTime(), 100.04, 1.3873), new OilPriceandEuroRate(new java.util.GregorianCalendar(2011, 9, 24).getTime(), 104.31, 1.3932), new OilPriceandEuroRate(new java.util.GregorianCalendar(2011, 9, 25).getTime(), 110.38, 1.3911), new OilPriceandEuroRate(new java.util.GregorianCalendar(2011, 9, 26).getTime(), 111.04, 1.3838), new OilPriceandEuroRate(new java.util.GregorianCalendar(2011, 9, 27).getTime(), 110.72, 1.4172), new OilPriceandEuroRate(new java.util.GregorianCalendar(2011, 9, 28).getTime(), 112.14, 1.4164), new OilPriceandEuroRate(new java.util.GregorianCalendar(2011, 9, 31).getTime(), 109.57, 1.3947), new OilPriceandEuroRate(new java.util.GregorianCalendar(2011, 10, 1).getTime(), 110.28, 1.3676), new OilPriceandEuroRate(new java.util.GregorianCalendar(2011, 10, 2).getTime(), 113.72, 1.3803), new OilPriceandEuroRate(new java.util.GregorianCalendar(2011, 10, 3).getTime(), 118.74, 1.3744), new OilPriceandEuroRate(new java.util.GregorianCalendar(2011, 10, 4).getTime(), 118.66, 1.3761), new OilPriceandEuroRate(new java.util.GregorianCalendar(2011, 10, 7).getTime(), 119.41, 1.3744), new OilPriceandEuroRate(new java.util.GregorianCalendar(2011, 10, 8).getTime(), 118.57, 1.3785), new OilPriceandEuroRate(new java.util.GregorianCalendar(2011, 10, 9).getTime(), 116.46, 1.3596), new OilPriceandEuroRate(new java.util.GregorianCalendar(2011, 10, 10).getTime(), 115.07, 1.36), new OilPriceandEuroRate(new java.util.GregorianCalendar(2011, 10, 11).getTime(), 119.29, 1.3612), new OilPriceandEuroRate(new java.util.GregorianCalendar(2011, 10, 14).getTime(), 117.1, 1.3625), new OilPriceandEuroRate(new java.util.GregorianCalendar(2011, 10, 15).getTime(), 119.44, 1.3524), new OilPriceandEuroRate(new java.util.GregorianCalendar(2011, 10, 16).getTime(), 117.97, 1.3505), new OilPriceandEuroRate(new java.util.GregorianCalendar(2011, 10, 17).getTime(), 114.19, 1.3522), new OilPriceandEuroRate(new java.util.GregorianCalendar(2011, 10, 18).getTime(), 111.01, 1.3521), new OilPriceandEuroRate(new java.util.GregorianCalendar(2011, 10, 21).getTime(), 107.04, 1.3525), new OilPriceandEuroRate(new java.util.GregorianCalendar(2011, 10, 22).getTime(), 109.04, 1.35), new OilPriceandEuroRate(new java.util.GregorianCalendar(2011, 10, 23).getTime(), 105.93, 1.3347), new OilPriceandEuroRate(new java.util.GregorianCalendar(2011, 10, 25).getTime(), 103.88, 1.3244), new OilPriceandEuroRate(new java.util.GregorianCalendar(2011, 10, 28).getTime(), 97.46, 1.3334), new OilPriceandEuroRate(new java.util.GregorianCalendar(2011, 10, 29).getTime(), 104.51, 1.3343), new OilPriceandEuroRate(new java.util.GregorianCalendar(2011, 10, 30).getTime(), 106.91, 1.3453), new OilPriceandEuroRate(new java.util.GregorianCalendar(2011, 11, 1).getTime(), 106.83, 1.3487), new OilPriceandEuroRate(new java.util.GregorianCalendar(2011, 11, 2).getTime(), 104.26, 1.3386), new OilPriceandEuroRate(new java.util.GregorianCalendar(2011, 11, 5).getTime(), 104.38, 1.3463), new OilPriceandEuroRate(new java.util.GregorianCalendar(2011, 11, 6).getTime(), 106.38, 1.3397), new OilPriceandEuroRate(new java.util.GregorianCalendar(2011, 11, 7).getTime(), 108.8, 1.3386), new OilPriceandEuroRate(new java.util.GregorianCalendar(2011, 11, 8).getTime(), 106.65, 1.3324), new OilPriceandEuroRate(new java.util.GregorianCalendar(2011, 11, 9).getTime(), 108.51, 1.3368), new OilPriceandEuroRate(new java.util.GregorianCalendar(2011, 11, 12).getTime(), 105.47, 1.3188), new OilPriceandEuroRate(new java.util.GregorianCalendar(2011, 11, 13).getTime(), 102.53, 1.3094), new OilPriceandEuroRate(new java.util.GregorianCalendar(2011, 11, 14).getTime(), 99.57, 1.2972), new OilPriceandEuroRate(new java.util.GregorianCalendar(2011, 11, 15).getTime(), 98.21, 1.3013), new OilPriceandEuroRate(new java.util.GregorianCalendar(2011, 11, 16).getTime(), 101.8, 1.3025), new OilPriceandEuroRate(new java.util.GregorianCalendar(2011, 11, 19).getTime(), 100.62, 1.3017), new OilPriceandEuroRate(new java.util.GregorianCalendar(2011, 11, 20).getTime(), 105.12, 1.3076), new OilPriceandEuroRate(new java.util.GregorianCalendar(2011, 11, 21).getTime(), 104.64, 1.304), new OilPriceandEuroRate(new java.util.GregorianCalendar(2011, 11, 22).getTime(), 103.74, 1.3045), new OilPriceandEuroRate(new java.util.GregorianCalendar(2011, 11, 23).getTime(), 104.35, 1.304), new OilPriceandEuroRate(new java.util.GregorianCalendar(2011, 11, 27).getTime(), 102.38, 1.3074), new OilPriceandEuroRate(new java.util.GregorianCalendar(2011, 11, 28).getTime(), 100.51, 1.2926), new OilPriceandEuroRate(new java.util.GregorianCalendar(2011, 11, 29).getTime(), 101.22, 1.2952), new OilPriceandEuroRate(new java.util.GregorianCalendar(2011, 11, 30).getTime(), 102.1, 1.2973), new OilPriceandEuroRate(new java.util.GregorianCalendar(2012, 0, 3).getTime(), 108.29, 1.3061), new OilPriceandEuroRate(new java.util.GregorianCalendar(2012, 0, 4).getTime(), 108.14, 1.293), new OilPriceandEuroRate(new java.util.GregorianCalendar(2012, 0, 5).getTime(), 108.27, 1.2783), new OilPriceandEuroRate(new java.util.GregorianCalendar(2012, 0, 6).getTime(), 106.74, 1.2723), new OilPriceandEuroRate(new java.util.GregorianCalendar(2012, 0, 9).getTime(), 107.62, 1.2745), new OilPriceandEuroRate(new java.util.GregorianCalendar(2012, 0, 10).getTime(), 110.97, 1.2782), new OilPriceandEuroRate(new java.util.GregorianCalendar(2012, 0, 11).getTime(), 108.89, 1.2686), new OilPriceandEuroRate(new java.util.GregorianCalendar(2012, 0, 12).getTime(), 110.86, 1.2818), new OilPriceandEuroRate(new java.util.GregorianCalendar(2012, 0, 13).getTime(), 108.83, 1.2682), new OilPriceandEuroRate(new java.util.GregorianCalendar(2012, 0, 17).getTime(), 109.64, 1.274), new OilPriceandEuroRate(new java.util.GregorianCalendar(2012, 0, 18).getTime(), 111.54, 1.2825), new OilPriceandEuroRate(new java.util.GregorianCalendar(2012, 0, 19).getTime(), 109.85, 1.2937), new OilPriceandEuroRate(new java.util.GregorianCalendar(2012, 0, 20).getTime(), 109.13, 1.2948), new OilPriceandEuroRate(new java.util.GregorianCalendar(2012, 0, 23).getTime(), 110.11, 1.3035), new OilPriceandEuroRate(new java.util.GregorianCalendar(2012, 0, 24).getTime(), 107.3, 1.3004), new OilPriceandEuroRate(new java.util.GregorianCalendar(2012, 0, 25).getTime(), 110.82, 1.2978), new OilPriceandEuroRate(new java.util.GregorianCalendar(2012, 0, 26).getTime(), 111.94, 1.3152), new OilPriceandEuroRate(new java.util.GregorianCalendar(2012, 0, 27).getTime(), 114.24, 1.3192), new OilPriceandEuroRate(new java.util.GregorianCalendar(2012, 0, 30).getTime(), 113.42, 1.3123), new OilPriceandEuroRate(new java.util.GregorianCalendar(2012, 0, 31).getTime(), 114.41, 1.3053), new OilPriceandEuroRate(new java.util.GregorianCalendar(2012, 1, 1).getTime(), 114.84, 1.3179), new OilPriceandEuroRate(new java.util.GregorianCalendar(2012, 1, 2).getTime(), 116.97, 1.3167), new OilPriceandEuroRate(new java.util.GregorianCalendar(2012, 1, 3).getTime(), 116.17, 1.3106), new OilPriceandEuroRate(new java.util.GregorianCalendar(2012, 1, 6).getTime(), 118.01, 1.313), new OilPriceandEuroRate(new java.util.GregorianCalendar(2012, 1, 7).getTime(), 114.6, 1.3244), new OilPriceandEuroRate(new java.util.GregorianCalendar(2012, 1, 8).getTime(), 114.56, 1.3253), new OilPriceandEuroRate(new java.util.GregorianCalendar(2012, 1, 9).getTime(), 114.45, 1.3297), new OilPriceandEuroRate(new java.util.GregorianCalendar(2012, 1, 10).getTime(), 112.56, 1.3187), new OilPriceandEuroRate(new java.util.GregorianCalendar(2012, 1, 13).getTime(), 112.92, 1.3211), new OilPriceandEuroRate(new java.util.GregorianCalendar(2012, 1, 14).getTime(), 112.27, 1.3149), new OilPriceandEuroRate(new java.util.GregorianCalendar(2012, 1, 15).getTime(), 111.36, 1.3087), new OilPriceandEuroRate(new java.util.GregorianCalendar(2012, 1, 16).getTime(), 111.38, 1.311), new OilPriceandEuroRate(new java.util.GregorianCalendar(2012, 1, 17).getTime(), 111.05, 1.3149), new OilPriceandEuroRate(new java.util.GregorianCalendar(2012, 1, 21).getTime(), 113.06, 1.3255), new OilPriceandEuroRate(new java.util.GregorianCalendar(2012, 1, 22).getTime(), 114.74, 1.3251), new OilPriceandEuroRate(new java.util.GregorianCalendar(2012, 1, 23).getTime(), 116.88, 1.3308), new OilPriceandEuroRate(new java.util.GregorianCalendar(2012, 1, 24).getTime(), 115.73, 1.3463), new OilPriceandEuroRate(new java.util.GregorianCalendar(2012, 1, 27).getTime(), 114.86, 1.341), new OilPriceandEuroRate(new java.util.GregorianCalendar(2012, 1, 28).getTime(), 117.41, 1.3452), new OilPriceandEuroRate(new java.util.GregorianCalendar(2012, 1, 29).getTime(), 114.73, 1.3359), new OilPriceandEuroRate(new java.util.GregorianCalendar(2012, 2, 1).getTime(), 115.98, 1.332), new OilPriceandEuroRate(new java.util.GregorianCalendar(2012, 2, 2).getTime(), 114.02, 1.3202), new OilPriceandEuroRate(new java.util.GregorianCalendar(2012, 2, 5).getTime(), 111.17, 1.3226), new OilPriceandEuroRate(new java.util.GregorianCalendar(2012, 2, 6).getTime(), 108.48, 1.3114), new OilPriceandEuroRate(new java.util.GregorianCalendar(2012, 2, 7).getTime(), 109.3, 1.3149), new OilPriceandEuroRate(new java.util.GregorianCalendar(2012, 2, 8).getTime(), 111.66, 1.3256), new OilPriceandEuroRate(new java.util.GregorianCalendar(2012, 2, 9).getTime(), 112.41, 1.3108), new OilPriceandEuroRate(new java.util.GregorianCalendar(2012, 2, 12).getTime(), 111.38, 1.3141), new OilPriceandEuroRate(new java.util.GregorianCalendar(2012, 2, 13).getTime(), 110.62, 1.3109), new OilPriceandEuroRate(new java.util.GregorianCalendar(2012, 2, 14).getTime(), 106.67, 1.3025), new OilPriceandEuroRate(new java.util.GregorianCalendar(2012, 2, 15).getTime(), 104.01, 1.307), new OilPriceandEuroRate(new java.util.GregorianCalendar(2012, 2, 16).getTime(), 101.49, 1.3171), new OilPriceandEuroRate(new java.util.GregorianCalendar(2012, 2, 19).getTime(), 101.97, 1.3242), new OilPriceandEuroRate(new java.util.GregorianCalendar(2012, 2, 20).getTime(), 102.35, 1.3222), new OilPriceandEuroRate(new java.util.GregorianCalendar(2012, 2, 21).getTime(), 103.4, 1.319), new OilPriceandEuroRate(new java.util.GregorianCalendar(2012, 2, 22).getTime(), 90.6, 1.3194), new OilPriceandEuroRate(new java.util.GregorianCalendar(2012, 2, 23).getTime(), 91.32, 1.3263), new OilPriceandEuroRate(new java.util.GregorianCalendar(2012, 2, 26).getTime(), 91.62, 1.3328), new OilPriceandEuroRate(new java.util.GregorianCalendar(2012, 2, 27).getTime(), 89.26, 1.3336), new OilPriceandEuroRate(new java.util.GregorianCalendar(2012, 2, 28).getTime(), 86.96, 1.33), new OilPriceandEuroRate(new java.util.GregorianCalendar(2012, 2, 29).getTime(), 87.84, 1.3265), new OilPriceandEuroRate(new java.util.GregorianCalendar(2012, 2, 30).getTime(), 87.98, 1.3334), new OilPriceandEuroRate(new java.util.GregorianCalendar(2012, 3, 2).getTime(), 86.33, 1.3325), new OilPriceandEuroRate(new java.util.GregorianCalendar(2012, 3, 3).getTime(), 83.61, 1.3337), new OilPriceandEuroRate(new java.util.GregorianCalendar(2012, 3, 4).getTime(), 81.31, 1.3126), new OilPriceandEuroRate(new java.util.GregorianCalendar(2012, 3, 5).getTime(), 81.44, 1.3064), new OilPriceandEuroRate(new java.util.GregorianCalendar(2012, 3, 9).getTime(), 88.9, 1.3087), new OilPriceandEuroRate(new java.util.GregorianCalendar(2012, 3, 10).getTime(), 87.74, 1.3068), new OilPriceandEuroRate(new java.util.GregorianCalendar(2012, 3, 11).getTime(), 85.29, 1.3104), new OilPriceandEuroRate(new java.util.GregorianCalendar(2012, 3, 12).getTime(), 90.11, 1.3171), new OilPriceandEuroRate(new java.util.GregorianCalendar(2012, 3, 13).getTime(), 89.04, 1.3082), new OilPriceandEuroRate(new java.util.GregorianCalendar(2012, 3, 16).getTime(), 86.79, 1.3067), new OilPriceandEuroRate(new java.util.GregorianCalendar(2012, 3, 17).getTime(), 87.09, 1.3123), new OilPriceandEuroRate(new java.util.GregorianCalendar(2012, 3, 18).getTime(), 87.2, 1.3122), new OilPriceandEuroRate(new java.util.GregorianCalendar(2012, 3, 19).getTime(), 87.27, 1.3132), new OilPriceandEuroRate(new java.util.GregorianCalendar(2012, 3, 20).getTime(), 87.13, 1.3212), new OilPriceandEuroRate(new java.util.GregorianCalendar(2012, 3, 23).getTime(), 84.53, 1.3129), new OilPriceandEuroRate(new java.util.GregorianCalendar(2012, 3, 24).getTime(), 84.86, 1.3207), new OilPriceandEuroRate(new java.util.GregorianCalendar(2012, 3, 25).getTime(), 88.21, 1.321), new OilPriceandEuroRate(new java.util.GregorianCalendar(2012, 3, 26).getTime(), 91.01, 1.3232), new OilPriceandEuroRate(new java.util.GregorianCalendar(2012, 3, 27).getTime(), 91.4, 1.3248), new OilPriceandEuroRate(new java.util.GregorianCalendar(2012, 3, 30).getTime(), 89.15, 1.3229), new OilPriceandEuroRate(new java.util.GregorianCalendar(2012, 4, 1).getTime(), 87.35, 1.3226), new OilPriceandEuroRate(new java.util.GregorianCalendar(2012, 4, 2).getTime(), 86.32, 1.3154), new OilPriceandEuroRate(new java.util.GregorianCalendar(2012, 4, 3).getTime(), 81.89, 1.3147), new OilPriceandEuroRate(new java.util.GregorianCalendar(2012, 4, 4).getTime(), 81.62, 1.3091), new OilPriceandEuroRate(new java.util.GregorianCalendar(2012, 4, 7).getTime(), 80.92, 1.3052), new OilPriceandEuroRate(new java.util.GregorianCalendar(2012, 4, 8).getTime(), 77.61, 1.3015), new OilPriceandEuroRate(new java.util.GregorianCalendar(2012, 4, 9).getTime(), 77.7, 1.2954), new OilPriceandEuroRate(new java.util.GregorianCalendar(2012, 4, 10).getTime(), 77.67, 1.2959), new OilPriceandEuroRate(new java.util.GregorianCalendar(2012, 4, 11).getTime(), 76.72, 1.2937), new OilPriceandEuroRate(new java.util.GregorianCalendar(2012, 4, 14).getTime(), 74.68, 1.2847), new OilPriceandEuroRate(new java.util.GregorianCalendar(2012, 4, 15).getTime(), 73.13, 1.2769), new OilPriceandEuroRate(new java.util.GregorianCalendar(2012, 4, 16).getTime(), 74.03, 1.273), new OilPriceandEuroRate(new java.util.GregorianCalendar(2012, 4, 17).getTime(), 76.55, 1.2709), new OilPriceandEuroRate(new java.util.GregorianCalendar(2012, 4, 18).getTime(), 76.45, 1.2721), new OilPriceandEuroRate(new java.util.GregorianCalendar(2012, 4, 21).getTime(), 79.63, 1.2769), new OilPriceandEuroRate(new java.util.GregorianCalendar(2012, 4, 22).getTime(), 77.65, 1.2735), new OilPriceandEuroRate(new java.util.GregorianCalendar(2012, 4, 23).getTime(), 79.7, 1.2569), new OilPriceandEuroRate(new java.util.GregorianCalendar(2012, 4, 24).getTime(), 80.75, 1.2583), new OilPriceandEuroRate(new java.util.GregorianCalendar(2012, 4, 25).getTime(), 80.96, 1.2518), new OilPriceandEuroRate(new java.util.GregorianCalendar(2012, 4, 29).getTime(), 80.8, 1.2488), new OilPriceandEuroRate(new java.util.GregorianCalendar(2012, 4, 30).getTime(), 80.41, 1.2405), new OilPriceandEuroRate(new java.util.GregorianCalendar(2012, 4, 31).getTime(), 79.35, 1.2364), new OilPriceandEuroRate(new java.util.GregorianCalendar(2012, 5, 1).getTime(), 87.26, 1.242), new OilPriceandEuroRate(new java.util.GregorianCalendar(2012, 5, 4).getTime(), 88.13, 1.2495), new OilPriceandEuroRate(new java.util.GregorianCalendar(2012, 5, 5).getTime(), 88.63, 1.2437), new OilPriceandEuroRate(new java.util.GregorianCalendar(2012, 5, 6).getTime(), 91.52, 1.2535), new OilPriceandEuroRate(new java.util.GregorianCalendar(2012, 5, 7).getTime(), 87.11, 1.2568), new OilPriceandEuroRate(new java.util.GregorianCalendar(2012, 5, 8).getTime(), 87.59, 1.2482), new OilPriceandEuroRate(new java.util.GregorianCalendar(2012, 5, 11).getTime(), 87.18, 1.2504), new OilPriceandEuroRate(new java.util.GregorianCalendar(2012, 5, 12).getTime(), 89.78, 1.2477), new OilPriceandEuroRate(new java.util.GregorianCalendar(2012, 5, 13).getTime(), 90.54, 1.2596), new OilPriceandEuroRate(new java.util.GregorianCalendar(2012, 5, 14).getTime(), 91.99, 1.2608), new OilPriceandEuroRate(new java.util.GregorianCalendar(2012, 5, 15).getTime(), 92.7, 1.2633), new OilPriceandEuroRate(new java.util.GregorianCalendar(2012, 5, 18).getTime(), 94.41, 1.2578), new OilPriceandEuroRate(new java.util.GregorianCalendar(2012, 5, 19).getTime(), 94.43, 1.2692), new OilPriceandEuroRate(new java.util.GregorianCalendar(2012, 5, 20).getTime(), 94.27, 1.2703), new OilPriceandEuroRate(new java.util.GregorianCalendar(2012, 5, 21).getTime(), 88.91, 1.2586), new OilPriceandEuroRate(new java.util.GregorianCalendar(2012, 5, 22).getTime(), 89.44, 1.2545), new OilPriceandEuroRate(new java.util.GregorianCalendar(2012, 5, 25).getTime(), 90.14, 1.248), new OilPriceandEuroRate(new java.util.GregorianCalendar(2012, 5, 26).getTime(), 89.89, 1.2471), new OilPriceandEuroRate(new java.util.GregorianCalendar(2012, 5, 27).getTime(), 89.27, 1.2457), new OilPriceandEuroRate(new java.util.GregorianCalendar(2012, 5, 28).getTime(), 87.15, 1.2433), new OilPriceandEuroRate(new java.util.GregorianCalendar(2012, 5, 29).getTime(), 90.01, 1.2668), new OilPriceandEuroRate(new java.util.GregorianCalendar(2012, 6, 2).getTime(), 90.83, 1.2584), new OilPriceandEuroRate(new java.util.GregorianCalendar(2012, 6, 3).getTime(), 93.7, 1.262), new OilPriceandEuroRate(new java.util.GregorianCalendar(2012, 6, 5).getTime(), 92.59, 1.2384), new OilPriceandEuroRate(new java.util.GregorianCalendar(2012, 6, 6).getTime(), 91.21, 1.2283), new OilPriceandEuroRate(new java.util.GregorianCalendar(2012, 6, 9).getTime(), 90.86, 1.2299), new OilPriceandEuroRate(new java.util.GregorianCalendar(2012, 6, 10).getTime(), 89.89, 1.2255), new OilPriceandEuroRate(new java.util.GregorianCalendar(2012, 6, 11).getTime(), 89.89, 1.2244), new OilPriceandEuroRate(new java.util.GregorianCalendar(2012, 6, 12).getTime(), 89.67, 1.2199), new OilPriceandEuroRate(new java.util.GregorianCalendar(2012, 6, 13).getTime(), 90.41, 1.2232), new OilPriceandEuroRate(new java.util.GregorianCalendar(2012, 6, 16).getTime(), 90.31, 1.2267), new OilPriceandEuroRate(new java.util.GregorianCalendar(2012, 6, 17).getTime(), 89.03, 1.2234), new OilPriceandEuroRate(new java.util.GregorianCalendar(2012, 6, 18).getTime(), 88.04, 1.2261), new OilPriceandEuroRate(new java.util.GregorianCalendar(2012, 6, 19).getTime(), 87.82, 1.2257), new OilPriceandEuroRate(new java.util.GregorianCalendar(2012, 6, 20).getTime(), 86.19, 1.2176), new OilPriceandEuroRate(new java.util.GregorianCalendar(2012, 6, 23).getTime(), 83.96, 1.2126), new OilPriceandEuroRate(new java.util.GregorianCalendar(2012, 6, 24).getTime(), 83.73, 1.2062), new OilPriceandEuroRate(new java.util.GregorianCalendar(2012, 6, 25).getTime(), 87.69, 1.2132), new OilPriceandEuroRate(new java.util.GregorianCalendar(2012, 6, 26).getTime(), 89.24, 1.228), new OilPriceandEuroRate(new java.util.GregorianCalendar(2012, 6, 27).getTime(), 91.35, 1.237), new OilPriceandEuroRate(new java.util.GregorianCalendar(2012, 6, 30).getTime(), 91.9, 1.225), new OilPriceandEuroRate(new java.util.GregorianCalendar(2012, 6, 31).getTime(), 89.48, 1.2315), new OilPriceandEuroRate(new java.util.GregorianCalendar(2012, 7, 1).getTime(), 88.84, 1.2299), new OilPriceandEuroRate(new java.util.GregorianCalendar(2012, 7, 2).getTime(), 89.3, 1.2149), new OilPriceandEuroRate(new java.util.GregorianCalendar(2012, 7, 3).getTime(), 90.63, 1.239), new OilPriceandEuroRate(new java.util.GregorianCalendar(2012, 7, 6).getTime(), 93.03, 1.2422), new OilPriceandEuroRate(new java.util.GregorianCalendar(2012, 7, 7).getTime(), 95.3, 1.2422), new OilPriceandEuroRate(new java.util.GregorianCalendar(2012, 7, 8).getTime(), 94.72, 1.2364), new OilPriceandEuroRate(new java.util.GregorianCalendar(2012, 7, 9).getTime(), 98.28, 1.2278), new OilPriceandEuroRate(new java.util.GregorianCalendar(2012, 7, 10).getTime(), 99.41, 1.2298), new OilPriceandEuroRate(new java.util.GregorianCalendar(2012, 7, 13).getTime(), 97.89, 1.2339), new OilPriceandEuroRate(new java.util.GregorianCalendar(2012, 7, 14).getTime(), 96.8, 1.2329), new OilPriceandEuroRate(new java.util.GregorianCalendar(2012, 7, 15).getTime(), 96.69, 1.2288), new OilPriceandEuroRate(new java.util.GregorianCalendar(2012, 7, 16).getTime(), 98.04, 1.2356), new OilPriceandEuroRate(new java.util.GregorianCalendar(2012, 7, 17).getTime(), 97.5, 1.2315), new OilPriceandEuroRate(new java.util.GregorianCalendar(2012, 7, 20).getTime(), 97.37, 1.2343), new OilPriceandEuroRate(new java.util.GregorianCalendar(2012, 7, 21).getTime(), 97.53, 1.2472), new OilPriceandEuroRate(new java.util.GregorianCalendar(2012, 7, 22).getTime(), 98.82, 1.2472), new OilPriceandEuroRate(new java.util.GregorianCalendar(2012, 7, 23).getTime(), 100.53, 1.2583), new OilPriceandEuroRate(new java.util.GregorianCalendar(2012, 7, 24).getTime(), 100.71, 1.2533), new OilPriceandEuroRate(new java.util.GregorianCalendar(2012, 7, 27).getTime(), 99.82, 1.2514), new OilPriceandEuroRate(new java.util.GregorianCalendar(2012, 7, 28).getTime(), 98.98, 1.2564), new OilPriceandEuroRate(new java.util.GregorianCalendar(2012, 7, 29).getTime(), 97.93, 1.2538), new OilPriceandEuroRate(new java.util.GregorianCalendar(2012, 7, 30).getTime(), 97.96, 1.2497), new OilPriceandEuroRate(new java.util.GregorianCalendar(2012, 7, 31).getTime(), 102.97, 1.2578), new OilPriceandEuroRate(new java.util.GregorianCalendar(2012, 8, 4).getTime(), 101.66, 1.2566), new OilPriceandEuroRate(new java.util.GregorianCalendar(2012, 8, 5).getTime(), 102.39, 1.2603), new OilPriceandEuroRate(new java.util.GregorianCalendar(2012, 8, 6).getTime(), 108.7, 1.2626), new OilPriceandEuroRate(new java.util.GregorianCalendar(2012, 8, 7).getTime(), 111.47, 1.2796), new OilPriceandEuroRate(new java.util.GregorianCalendar(2012, 8, 10).getTime(), 110.42, 1.2795), new OilPriceandEuroRate(new java.util.GregorianCalendar(2012, 8, 11).getTime(), 110.23, 1.2858), new OilPriceandEuroRate(new java.util.GregorianCalendar(2012, 8, 12).getTime(), 110.59, 1.2894), new OilPriceandEuroRate(new java.util.GregorianCalendar(2012, 8, 13).getTime(), 114.35, 1.2912), new OilPriceandEuroRate(new java.util.GregorianCalendar(2012, 8, 14).getTime(), 120.34, 1.3142) }; ObjectProvider objProvider = new ObjectProvider(data); chart1.getDataSourceSettings().setDataSource(objProvider); if (fieldNames != "") { List<DataField> removeFields = new ArrayList<DataField>(); List<String> includeFields = Arrays.asList(fieldNames.split(",")); chart1.getDataSourceSettings().fillFromSchema(); for (DataField dataField : chart1.getDataSourceSettings().getDataFields()) { if (dataField.isMeasure() && !includeFields.contains(dataField.getDataPath())) { removeFields.add(dataField); } } for (DataField dataField : removeFields) { chart1.getDataSourceSettings().getDataFields().remove(dataField); } } } public static void PopulateOilPriceandEuroRate(Chart chart1) { PopulateOilPriceandEuroRate(chart1, ""); }public static class OilPriceandEuroRate { private java.util.Date privateTransDate = new java.util.Date(0); public final java.util.Date getTransDate() { return privateTransDate; } public final void setTransDate(java.util.Date value) { privateTransDate = value; } private double privatePrice; public final double getPrice() { return privatePrice; } public final void setPrice(double value) { privatePrice = value; } private double privateEuro; public final double getEuro() { return privateEuro; } public final void setEuro(double value) { privateEuro = value; } public OilPriceandEuroRate(java.util.Date transDate, double price, double euro){ this.setTransDate(transDate); this.setPrice(price); this.setEuro(euro); } }
Change the color of the background to Black using the
SolidBackgroundclass.PopulateProductSales(chart1); chart1.getTitles().add(new TitleDockable("Wine Sales by Type")); chart1.getAxisY().getLabelsFormat().setFormat(AxisFormat.CURRENCY); SolidBackground b; b = new SolidBackground(); b.setColor(new java.awt.Color(0,0,0,255)); chart1.setChartBackground(b);public static void PopulateProductSales(Chart chart1) { ProductSales[] data = new ProductSales[]{ new ProductSales("Jan", 12560, 23400, 34500), new ProductSales("Feb", 13400, 21000, 38900), new ProductSales("Mar", 16700, 17000, 42100), new ProductSales("Apr", 12000, 19020, 43800), new ProductSales("May", 15800, 26500, 37540), new ProductSales("Jun", 9800, 27800, 32580), new ProductSales("Jul", 17800, 29820, 34000), new ProductSales("Aug", 19800, 17800, 38000), new ProductSales("Sep", 23200, 32000, 41300), new ProductSales("Oct", 16700, 26500, 46590), new ProductSales("Nov", 11800, 23000, 48700), new ProductSales("Dec", 13400, 15400, 49100) }; ObjectProvider objProvider = new ObjectProvider(data); chart1.getDataSourceSettings().setDataSource(objProvider); }public static class ProductSales { public ProductSales(String month, double white, double red, double sparkling) { this.setMonth(month); this.setWhite(white); this.setRed(red); this.setSparkling(sparkling); } private String privateMonth; public final String getMonth() { return privateMonth; } public final void setMonth(String value) { privateMonth = value; } private double privateWhite; public final double getWhite() { return privateWhite; } public final void setWhite(double value) { privateWhite = value; } private double privateRed; public final double getRed() { return privateRed; } public final void setRed(double value) { privateRed = value; } private double privateSparkling; public final double getSparkling() { return privateSparkling; } public final void setSparkling(double value) { privateSparkling = value; } }
Note: Some vector borders may add visual effects on top of the chart, giving the false impression that the background has a gradient.- Parameters:
value-- See Also:
resetBackColor
-
getBindingSources
public ChartBindingSources getBindingSources()
Used to bind the data sources between the chart and other controls.
ChartBindingSources chartBS;
chartBS = chart1.getBindingSources();
-
getChartAreaRectangle
public java.awt.Rectangle getChartAreaRectangle()
Gets the rectangle object for the chart area.java.awt.Rectangle chartRect = new java.awt.Rectangle; chartRect = chart1.getChartAreaRectangle();
-
getChartBackground
public IBackgroundAdornment getChartBackground()
Allows you to assign a background to the chart.
GradientBackground myGradient;
myGradient = new GradientBackground(GradientType.BACKWARD_DIAGONAL);
myGradient.getColors().add(new java.awt.Color(0,128,0,255));
myGradient.getColors().add(new java.awt.Color(0,0,255,255));
myGradient.getPosition().add(0f);
myGradient.getPosition().add(0.5f);
myGradient.getPosition().add(1f);
myGradient.getFactor().add(0f);
myGradient.getFactor().add(0.5f);
myGradient.getFactor().add(1f);
chart1.setChartBackground(myGradient);
chart1.setForeColor(new java.awt.Color(255,255,255,255));
PopulateCarProduction(chart1);
chart1.getTitles().add(new TitleDockable("Vehicles Production by Type"));
public static void PopulateCarProduction(Chart chart1) { CarProduction[] production = new CarProduction[] { new CarProduction("Jan", 1760, 535, 695 ) , new CarProduction("Feb", 1849, 395, 688 ) , new CarProduction("Mar", 2831, 685, 1047 ) , new CarProduction("Apr", 2851, 984, 1652 ) , new CarProduction("May", 2961, 1579, 1889 ) , new CarProduction("Jun", 1519, 1539, 1766 ) , new CarProduction("Jul", 2633, 1489, 1361 ) , new CarProduction("Aug", 1140, 650, 874 ) , new CarProduction("Sep", 1626, 653, 693 ) , new CarProduction("Oct", 1478, 2236, 786 ) , new CarProduction("Nov", 1306, 1937, 599 ) , new CarProduction("Dec", 1607, 2138, 678 ) }; ObjectProvider objProvider = new ObjectProvider(production); chart1.getDataSourceSettings().setDataSource(objProvider); }public static class CarProduction { private CarProduction(String month, int sedan, int coupe, int SUV) { this.setMonth(month); this.setSedan(sedan); this.setCoupe(coupe); this.setSUV(SUV); } private String privateMonth; public final String getMonth() { return privateMonth; } public final void setMonth(String value) { privateMonth = value; } private int privateSedan; public final int getSedan() { return privateSedan; } public final void setSedan(int value) { privateSedan = value; } private int privateCoupe; public final int getCoupe() { return privateCoupe; } public final void setCoupe(int value) { privateCoupe = value; } private int privateSUV; public final int getSUV() { return privateSUV; } public final void setSUV(int value) { privateSUV = value; } }
-
setChartBackground
public void setChartBackground(IBackgroundAdornment value)
Allows you to assign a background to the chart.
GradientBackground myGradient;
myGradient = new GradientBackground(GradientType.BACKWARD_DIAGONAL);
myGradient.getColors().add(new java.awt.Color(0,128,0,255));
myGradient.getColors().add(new java.awt.Color(0,0,255,255));
myGradient.getPosition().add(0f);
myGradient.getPosition().add(0.5f);
myGradient.getPosition().add(1f);
myGradient.getFactor().add(0f);
myGradient.getFactor().add(0.5f);
myGradient.getFactor().add(1f);
chart1.setChartBackground(myGradient);
chart1.setForeColor(new java.awt.Color(255,255,255,255));
PopulateCarProduction(chart1);
chart1.getTitles().add(new TitleDockable("Vehicles Production by Type"));
public static void PopulateCarProduction(Chart chart1) { CarProduction[] production = new CarProduction[] { new CarProduction("Jan", 1760, 535, 695 ) , new CarProduction("Feb", 1849, 395, 688 ) , new CarProduction("Mar", 2831, 685, 1047 ) , new CarProduction("Apr", 2851, 984, 1652 ) , new CarProduction("May", 2961, 1579, 1889 ) , new CarProduction("Jun", 1519, 1539, 1766 ) , new CarProduction("Jul", 2633, 1489, 1361 ) , new CarProduction("Aug", 1140, 650, 874 ) , new CarProduction("Sep", 1626, 653, 693 ) , new CarProduction("Oct", 1478, 2236, 786 ) , new CarProduction("Nov", 1306, 1937, 599 ) , new CarProduction("Dec", 1607, 2138, 678 ) }; ObjectProvider objProvider = new ObjectProvider(production); chart1.getDataSourceSettings().setDataSource(objProvider); }public static class CarProduction { private CarProduction(String month, int sedan, int coupe, int SUV) { this.setMonth(month); this.setSedan(sedan); this.setCoupe(coupe); this.setSUV(SUV); } private String privateMonth; public final String getMonth() { return privateMonth; } public final void setMonth(String value) { privateMonth = value; } private int privateSedan; public final int getSedan() { return privateSedan; } public final void setSedan(int value) { privateSedan = value; } private int privateCoupe; public final int getCoupe() { return privateCoupe; } public final void setCoupe(int value) { privateCoupe = value; } private int privateSUV; public final int getSUV() { return privateSUV; } public final void setSUV(int value) { privateSUV = value; } }
- Parameters:
value-
-
getChartBorder
public IBorderAdornment getChartBorder()
Allows you to assign a border to the chart.
VectorBorder vectorBorder;
vectorBorder = new VectorBorder(VectorBorderType.ROUND);
vectorBorder.setColor(new java.awt.Color(128,128,128,255));
chart1.setChartBorder(vectorBorder);
chart1.getLegendBox().setBorder(DockBorder.INTERNAL);
PopulateBirthVariation(chart1);
chart1.setGallery(Gallery.BAR);
chart1.getTitles().add(new TitleDockable("Birth Variation by Gender"));
chart1.getAxisY().getTitle().setText("Variation (%)");
public static void PopulateBirthVariation(Chart chart1) { BirthVariation[] variations = new BirthVariation[] { new BirthVariation("2007", 4.5, 4.9 ), new BirthVariation("2008", -1.8, 1.2 ), new BirthVariation("2009", 2.3, -2.6 ), new BirthVariation("2010", 2.0, 3.0), new BirthVariation("2011", -0.5, -1.7 ), new BirthVariation("2012", 3.1, -0.9 ) }; ObjectProvider objProvider = new ObjectProvider(variations); chart1.getDataSourceSettings().setDataSource(objProvider); }public static class BirthVariation { public BirthVariation(String year, double male, double female) { this.setYear(year); this.setMale(male); this.setFemale(female); } private String privateYear; public final String getYear() { return privateYear; } public final void setYear(String value) { privateYear = value; } private double privateMale; public final double getMale() { return privateMale; } public final void setMale(double value) { privateMale = value; } private double privateFemale; public final double getFemale() { return privateFemale; } public final void setFemale(double value) { privateFemale = value; } }
ImageBorder imageBorder;
imageBorder = new ImageBorder(ImageBorderType.ARCH);
chart1.setChartBorder(imageBorder);
chart1.setPageColor(new java.awt.Color(255,255,255,255));
chart1.getLegendBox().setBorder(DockBorder.EXTERNAL);
PopulateCarProduction(chart1);
chart1.getTitles().add(new TitleDockable("Vehicles Production by Type"));
public static void PopulateCarProduction(Chart chart1) { CarProduction[] production = new CarProduction[] { new CarProduction("Jan", 1760, 535, 695 ) , new CarProduction("Feb", 1849, 395, 688 ) , new CarProduction("Mar", 2831, 685, 1047 ) , new CarProduction("Apr", 2851, 984, 1652 ) , new CarProduction("May", 2961, 1579, 1889 ) , new CarProduction("Jun", 1519, 1539, 1766 ) , new CarProduction("Jul", 2633, 1489, 1361 ) , new CarProduction("Aug", 1140, 650, 874 ) , new CarProduction("Sep", 1626, 653, 693 ) , new CarProduction("Oct", 1478, 2236, 786 ) , new CarProduction("Nov", 1306, 1937, 599 ) , new CarProduction("Dec", 1607, 2138, 678 ) }; ObjectProvider objProvider = new ObjectProvider(production); chart1.getDataSourceSettings().setDataSource(objProvider); }public static class CarProduction { private CarProduction(String month, int sedan, int coupe, int SUV) { this.setMonth(month); this.setSedan(sedan); this.setCoupe(coupe); this.setSUV(SUV); } private String privateMonth; public final String getMonth() { return privateMonth; } public final void setMonth(String value) { privateMonth = value; } private int privateSedan; public final int getSedan() { return privateSedan; } public final void setSedan(int value) { privateSedan = value; } private int privateCoupe; public final int getCoupe() { return privateCoupe; } public final void setCoupe(int value) { privateCoupe = value; } private int privateSUV; public final int getSUV() { return privateSUV; } public final void setSUV(int value) { privateSUV = value; } }
SimpleBorder simpleBorder;
simpleBorder = new SimpleBorder(SimpleBorderType.RAISED);
chart1.setChartBorder(simpleBorder);
PopulateCompanyDataBubble_PE(chart1);
chart1.setGallery(Gallery.BAR);
chart1.getAllSeries().setMultipleColors(true);
chart1.getLegendBox().setVisible(false);
chart1.getTitles().add(new TitleDockable("PE Ratio by Company"));
chart1.getAxisX().setLabelAngle((short)90);
chart1.getAxisX().setLineSpacing(1);
public static void PopulateCompanyDataBubble_PE(Chart chart1) { CompanyDataBubble[] companyData = new CompanyDataBubble[]{ new CompanyDataBubble("DODC", 0.97, 85, 39), new CompanyDataBubble("HPLA", 0.75, 74, 54), new CompanyDataBubble("FSTW", 0.73, 74, 23), new CompanyDataBubble("HYSL", 0.83, 72, 55), new CompanyDataBubble("COOG", 0.82, 68, 52), new CompanyDataBubble("JDEC", 0.64, 68, 37), new CompanyDataBubble("OTEX", 0.65, 65, 22), new CompanyDataBubble("NTIQ", 0.52, 60, 24), new CompanyDataBubble("OOGN", 0.59, 58, 39), new CompanyDataBubble("ORCL", 0.54, 58, 65), new CompanyDataBubble("SY", 0.71, 58, 7), new CompanyDataBubble("PRGS", 0.69, 57, 19), new CompanyDataBubble("TALX", 0.34, 54, 16), new CompanyDataBubble("TTS", 0.38, 54, 4), new CompanyDataBubble("PRSE", 0.44, 50, 6), new CompanyDataBubble("BCBJ", 0.37, 48, 0), new CompanyDataBubble("DCTM", 0.53, 46, 67), new CompanyDataBubble("ULCM", 0.31, 44, 71), new CompanyDataBubble("MERQ", 0.56, 43, 38), new CompanyDataBubble("ATRS", 0.78, 42, 0), new CompanyDataBubble("JDAS", 0.34, 41, 32), new CompanyDataBubble("SAP", 0.48, 40, 11), new CompanyDataBubble("VRTY", 0.49, 39, 80), new CompanyDataBubble("PSFT", 0.38, 38, 42), new CompanyDataBubble("SRNA", 0.35, 36, 39), new CompanyDataBubble("SPSS", 0.58, 36, 18), new CompanyDataBubble("QSFT", 0.32, 35, 68), new CompanyDataBubble("PTEC", 0.51, 34, 10), new CompanyDataBubble("BMC", 0.58, 32, 37), new CompanyDataBubble("CTXS", 0.16, 32, 9), new CompanyDataBubble("PDFS", 0.22, 31, 18), new CompanyDataBubble("MRCL", 0.3, 30, 22), new CompanyDataBubble("CA", 0.24, 30, 33), new CompanyDataBubble("VRTS", 0.36, 29, 12), new CompanyDataBubble("TIBX", 0.31, 28, 6), new CompanyDataBubble("LTBG", 0.47, 23, 18), new CompanyDataBubble("RATL", 0.26, 23, 23), new CompanyDataBubble("SEBL", 0.23, 19, 15), new CompanyDataBubble("LWSN", 0.27, 16, 13) }; ObjectProvider objProvider = new ObjectProvider(companyData); chart1.getDataSourceSettings().setDataSource(objProvider); // Since not all the fields in the DataSource are required, we must specify the number // of series that will be contained in the chart and perform the corresponding bindings chart1.getData().setSeries(1); NumericDataField numericFieldPE = new NumericDataField(); numericFieldPE.setDataPath("PE"); chart1.getDataSourceSettings().getDataFields().add(numericFieldPE); chart1.getSeries().get(0).getBindings().setY(numericFieldPE); StringDataField stringFieldMonth = new StringDataField(); stringFieldMonth.setDataPath("Symbol"); chart1.getDataSourceSettings().getDataFields().add(stringFieldMonth); chart1.getAxisX().getBindings().setLabel(stringFieldMonth); }public static void PopulateCompanyDataBubble(Chart chart1) { CompanyDataBubble[] companyData = new CompanyDataBubble[]{ new CompanyDataBubble("DODC", 0.97, 85, 39), new CompanyDataBubble("HPLA", 0.75, 74, 54), new CompanyDataBubble("FSTW", 0.73, 74, 23), new CompanyDataBubble("HYSL", 0.83, 72, 55), new CompanyDataBubble("COOG", 0.82, 68, 52), new CompanyDataBubble("JDEC", 0.64, 68, 37), new CompanyDataBubble("OTEX", 0.65, 65, 22), new CompanyDataBubble("NTIQ", 0.52, 60, 24), new CompanyDataBubble("OOGN", 0.59, 58, 39), new CompanyDataBubble("ORCL", 0.54, 58, 65), new CompanyDataBubble("SY", 0.71, 58, 7), new CompanyDataBubble("PRGS", 0.69, 57, 19), new CompanyDataBubble("TALX", 0.34, 54, 16), new CompanyDataBubble("TTS", 0.38, 54, 4), new CompanyDataBubble("PRSE", 0.44, 50, 6), new CompanyDataBubble("BCBJ", 0.37, 48, 0), new CompanyDataBubble("DCTM", 0.53, 46, 67), new CompanyDataBubble("ULCM", 0.31, 44, 71), new CompanyDataBubble("MERQ", 0.56, 43, 38), new CompanyDataBubble("ATRS", 0.78, 42, 0), new CompanyDataBubble("JDAS", 0.34, 41, 32), new CompanyDataBubble("SAP", 0.48, 40, 11), new CompanyDataBubble("VRTY", 0.49, 39, 80), new CompanyDataBubble("PSFT", 0.38, 38, 42), new CompanyDataBubble("SRNA", 0.35, 36, 39), new CompanyDataBubble("SPSS", 0.58, 36, 18), new CompanyDataBubble("QSFT", 0.32, 35, 68), new CompanyDataBubble("PTEC", 0.51, 34, 10), new CompanyDataBubble("BMC", 0.58, 32, 37), new CompanyDataBubble("CTXS", 0.16, 32, 9), new CompanyDataBubble("PDFS", 0.22, 31, 18), new CompanyDataBubble("MRCL", 0.3, 30, 22), new CompanyDataBubble("CA", 0.24, 30, 33), new CompanyDataBubble("VRTS", 0.36, 29, 12), new CompanyDataBubble("TIBX", 0.31, 28, 6), new CompanyDataBubble("LTBG", 0.47, 23, 18), new CompanyDataBubble("RATL", 0.26, 23, 23), new CompanyDataBubble("SEBL", 0.23, 19, 15), new CompanyDataBubble("LWSN", 0.27, 16, 13) }; ObjectProvider objProvider = new ObjectProvider(companyData); chart1.getDataSourceSettings().setDataSource(objProvider); DataFieldCollection dataFieldCollection = chart1.getDataSourceSettings().getDataFields(); StringDataField dfSymbol = new StringDataField(); dfSymbol.setDataPath("Symbol"); NumericDataField dfStrength = new NumericDataField(); dfStrength.setDataPath("Strength"); NumericDataField dfRank = new NumericDataField(); dfRank.setDataPath("Rank"); NumericDataField dfPE = new NumericDataField(); dfPE.setDataPath("PE"); dataFieldCollection.add(dfSymbol); dataFieldCollection.add(dfStrength); dataFieldCollection.add(dfRank); dataFieldCollection.add(dfPE); chart1.getData().setSeries(2); SeriesBindings series0Bindings = chart1.getSeries().get(0).getBindings(); SeriesBindings series1Bindings = chart1.getSeries().get(1).getBindings(); series0Bindings.setX(dfStrength); series1Bindings.setX(dfStrength); series0Bindings.setY(dfRank); series1Bindings.setY(dfPE); chart1.getDataSourceSettings().readData(); }public static class CompanyDataBubble { public CompanyDataBubble(String symbol, double strengh, double rank, double pe) { this.setSymbol(symbol); this.setStrength(strengh); this.setRank(rank); this.setPE(pe); } private String privateSymbol; public final String getSymbol() { return privateSymbol; } public final void setSymbol(String value) { privateSymbol = value; } private double privateStrength; public final double getStrength() { return privateStrength; } public final void setStrength(double value) { privateStrength = value; } private double privateRank; public final double getRank() { return privateRank; } public final void setRank(double value) { privateRank = value; } private double privatePE; public final double getPE() { return privatePE; } public final void setPE(double value) { privatePE = value; } }
chart1.setChartBorder(new SimpleBorder(SimpleBorderType.NONE));
PopulateMiamiClimate(chart1,"High,Low");
chart1.getTitles().add(new TitleDockable("Miami Temperature Range in 2012"));
chart1.getAxisY().getTitle().setText("Temperature (°F)");
chart1.getAllSeries().getPointLabels().setVisible(true);
public static void PopulateMiamiClimate(Chart chart1, String fieldNames) { MiamiClimate[] data = new MiamiClimate[] { new MiamiClimate("Jan", 59.6, 76.5, 67.2, 1.88, 9.5, 59 ), new MiamiClimate("Feb", 60.5, 77.7, 68.5, 2.07, 10.1, 71 ), new MiamiClimate("Mar", 64, 80.7, 71.7, 2.56, 10.5, 69.5 ), new MiamiClimate("Apr", 67.6, 83.8, 75.2, 3.36, 10.5, 67.5 ), new MiamiClimate("May", 72, 87.2, 78.7, 5.52, 9.5, 67 ), new MiamiClimate("Jun", 75.2, 89.5, 81.4, 8.54, 8.3, 71 ), new MiamiClimate("Jul", 76.5, 90.9, 82.6, 5.79, 7.9, 74 ), new MiamiClimate("Aug", 76.5, 90.6, 82.8, 8.63, 7.9, 74 ), new MiamiClimate("Sep", 75.7, 89, 81.9, 8.38, 8.2, 76 ), new MiamiClimate("Oct", 72.2, 85.4, 78.3, 6.19, 9.2, 76 ), new MiamiClimate("Nov", 67.5, 81.2, 73.6, 3.43, 9.7, 74 ), new MiamiClimate("Dec", 62.2, 77.5, 69.1, 2.18, 9.2, 73 ) }; ObjectProvider objProvider = new ObjectProvider(data); chart1.getDataSourceSettings().setDataSource(objProvider); if (fieldNames != ""){ List<DataField> removeFields = new ArrayList<DataField>(); List<String> includeFields = Arrays.asList(fieldNames.split(",")); chart1.getDataSourceSettings().fillFromSchema(); for (DataField dataField : chart1.getDataSourceSettings().getDataFields()) { if (dataField.isMeasure() && !includeFields.contains(dataField.getDataPath())) { removeFields.add(dataField); } } for (DataField dataField : removeFields) { chart1.getDataSourceSettings().getDataFields().remove(dataField); } } } public static void PopulateMiamiClimate(Chart chart1) { PopulateMiamiClimate(chart1, ""); }public static class MiamiClimate { public MiamiClimate(String Month, double low, double high, double average, double precipitation, double windSpeed, double relativeHumidity) { this.setMonth(Month); this.setLow(low); this.setHigh(high); this.setAverage(average); this.setPrecipitation(precipitation); this.setWindSpeed(windSpeed); this.setRelativeHumidity(relativeHumidity); } private String privateMonth; public final String getMonth() { return privateMonth; } public final void setMonth(String value) { privateMonth = value; } private double privateLow; public final double getLow() { return privateLow; } public final void setLow(double value) { privateLow = value; } private double privateHigh; public final double getHigh() { return privateHigh; } public final void setHigh(double value) { privateHigh = value; } private double privateAverage; public final double getAverage() { return privateAverage; } public final void setAverage(double value) { privateAverage = value; } private double privatePrecipitation; public final double getPrecipitation() { return privatePrecipitation; } public final void setPrecipitation(double value) { privatePrecipitation = value; } private double privateWindSpeed; public final double getWindSpeed() { return privateWindSpeed; } public final void setWindSpeed(double value) { privateWindSpeed = value; } private double privateRelativeHumidity; public final double getRelativeHumidity() { return privateRelativeHumidity; } public final void setRelativeHumidity(double value) { privateRelativeHumidity = value; } }
-
setChartBorder
public void setChartBorder(IBorderAdornment value)
Allows you to assign a border to the chart.
VectorBorder vectorBorder;
vectorBorder = new VectorBorder(VectorBorderType.ROUND);
vectorBorder.setColor(new java.awt.Color(128,128,128,255));
chart1.setChartBorder(vectorBorder);
chart1.getLegendBox().setBorder(DockBorder.INTERNAL);
PopulateBirthVariation(chart1);
chart1.setGallery(Gallery.BAR);
chart1.getTitles().add(new TitleDockable("Birth Variation by Gender"));
chart1.getAxisY().getTitle().setText("Variation (%)");
public static void PopulateBirthVariation(Chart chart1) { BirthVariation[] variations = new BirthVariation[] { new BirthVariation("2007", 4.5, 4.9 ), new BirthVariation("2008", -1.8, 1.2 ), new BirthVariation("2009", 2.3, -2.6 ), new BirthVariation("2010", 2.0, 3.0), new BirthVariation("2011", -0.5, -1.7 ), new BirthVariation("2012", 3.1, -0.9 ) }; ObjectProvider objProvider = new ObjectProvider(variations); chart1.getDataSourceSettings().setDataSource(objProvider); }public static class BirthVariation { public BirthVariation(String year, double male, double female) { this.setYear(year); this.setMale(male); this.setFemale(female); } private String privateYear; public final String getYear() { return privateYear; } public final void setYear(String value) { privateYear = value; } private double privateMale; public final double getMale() { return privateMale; } public final void setMale(double value) { privateMale = value; } private double privateFemale; public final double getFemale() { return privateFemale; } public final void setFemale(double value) { privateFemale = value; } }
ImageBorder imageBorder;
imageBorder = new ImageBorder(ImageBorderType.ARCH);
chart1.setChartBorder(imageBorder);
chart1.setPageColor(new java.awt.Color(255,255,255,255));
chart1.getLegendBox().setBorder(DockBorder.EXTERNAL);
PopulateCarProduction(chart1);
chart1.getTitles().add(new TitleDockable("Vehicles Production by Type"));
public static void PopulateCarProduction(Chart chart1) { CarProduction[] production = new CarProduction[] { new CarProduction("Jan", 1760, 535, 695 ) , new CarProduction("Feb", 1849, 395, 688 ) , new CarProduction("Mar", 2831, 685, 1047 ) , new CarProduction("Apr", 2851, 984, 1652 ) , new CarProduction("May", 2961, 1579, 1889 ) , new CarProduction("Jun", 1519, 1539, 1766 ) , new CarProduction("Jul", 2633, 1489, 1361 ) , new CarProduction("Aug", 1140, 650, 874 ) , new CarProduction("Sep", 1626, 653, 693 ) , new CarProduction("Oct", 1478, 2236, 786 ) , new CarProduction("Nov", 1306, 1937, 599 ) , new CarProduction("Dec", 1607, 2138, 678 ) }; ObjectProvider objProvider = new ObjectProvider(production); chart1.getDataSourceSettings().setDataSource(objProvider); }public static class CarProduction { private CarProduction(String month, int sedan, int coupe, int SUV) { this.setMonth(month); this.setSedan(sedan); this.setCoupe(coupe); this.setSUV(SUV); } private String privateMonth; public final String getMonth() { return privateMonth; } public final void setMonth(String value) { privateMonth = value; } private int privateSedan; public final int getSedan() { return privateSedan; } public final void setSedan(int value) { privateSedan = value; } private int privateCoupe; public final int getCoupe() { return privateCoupe; } public final void setCoupe(int value) { privateCoupe = value; } private int privateSUV; public final int getSUV() { return privateSUV; } public final void setSUV(int value) { privateSUV = value; } }
SimpleBorder simpleBorder;
simpleBorder = new SimpleBorder(SimpleBorderType.RAISED);
chart1.setChartBorder(simpleBorder);
PopulateCompanyDataBubble_PE(chart1);
chart1.setGallery(Gallery.BAR);
chart1.getAllSeries().setMultipleColors(true);
chart1.getLegendBox().setVisible(false);
chart1.getTitles().add(new TitleDockable("PE Ratio by Company"));
chart1.getAxisX().setLabelAngle((short)90);
chart1.getAxisX().setLineSpacing(1);
public static void PopulateCompanyDataBubble_PE(Chart chart1) { CompanyDataBubble[] companyData = new CompanyDataBubble[]{ new CompanyDataBubble("DODC", 0.97, 85, 39), new CompanyDataBubble("HPLA", 0.75, 74, 54), new CompanyDataBubble("FSTW", 0.73, 74, 23), new CompanyDataBubble("HYSL", 0.83, 72, 55), new CompanyDataBubble("COOG", 0.82, 68, 52), new CompanyDataBubble("JDEC", 0.64, 68, 37), new CompanyDataBubble("OTEX", 0.65, 65, 22), new CompanyDataBubble("NTIQ", 0.52, 60, 24), new CompanyDataBubble("OOGN", 0.59, 58, 39), new CompanyDataBubble("ORCL", 0.54, 58, 65), new CompanyDataBubble("SY", 0.71, 58, 7), new CompanyDataBubble("PRGS", 0.69, 57, 19), new CompanyDataBubble("TALX", 0.34, 54, 16), new CompanyDataBubble("TTS", 0.38, 54, 4), new CompanyDataBubble("PRSE", 0.44, 50, 6), new CompanyDataBubble("BCBJ", 0.37, 48, 0), new CompanyDataBubble("DCTM", 0.53, 46, 67), new CompanyDataBubble("ULCM", 0.31, 44, 71), new CompanyDataBubble("MERQ", 0.56, 43, 38), new CompanyDataBubble("ATRS", 0.78, 42, 0), new CompanyDataBubble("JDAS", 0.34, 41, 32), new CompanyDataBubble("SAP", 0.48, 40, 11), new CompanyDataBubble("VRTY", 0.49, 39, 80), new CompanyDataBubble("PSFT", 0.38, 38, 42), new CompanyDataBubble("SRNA", 0.35, 36, 39), new CompanyDataBubble("SPSS", 0.58, 36, 18), new CompanyDataBubble("QSFT", 0.32, 35, 68), new CompanyDataBubble("PTEC", 0.51, 34, 10), new CompanyDataBubble("BMC", 0.58, 32, 37), new CompanyDataBubble("CTXS", 0.16, 32, 9), new CompanyDataBubble("PDFS", 0.22, 31, 18), new CompanyDataBubble("MRCL", 0.3, 30, 22), new CompanyDataBubble("CA", 0.24, 30, 33), new CompanyDataBubble("VRTS", 0.36, 29, 12), new CompanyDataBubble("TIBX", 0.31, 28, 6), new CompanyDataBubble("LTBG", 0.47, 23, 18), new CompanyDataBubble("RATL", 0.26, 23, 23), new CompanyDataBubble("SEBL", 0.23, 19, 15), new CompanyDataBubble("LWSN", 0.27, 16, 13) }; ObjectProvider objProvider = new ObjectProvider(companyData); chart1.getDataSourceSettings().setDataSource(objProvider); // Since not all the fields in the DataSource are required, we must specify the number // of series that will be contained in the chart and perform the corresponding bindings chart1.getData().setSeries(1); NumericDataField numericFieldPE = new NumericDataField(); numericFieldPE.setDataPath("PE"); chart1.getDataSourceSettings().getDataFields().add(numericFieldPE); chart1.getSeries().get(0).getBindings().setY(numericFieldPE); StringDataField stringFieldMonth = new StringDataField(); stringFieldMonth.setDataPath("Symbol"); chart1.getDataSourceSettings().getDataFields().add(stringFieldMonth); chart1.getAxisX().getBindings().setLabel(stringFieldMonth); }public static void PopulateCompanyDataBubble(Chart chart1) { CompanyDataBubble[] companyData = new CompanyDataBubble[]{ new CompanyDataBubble("DODC", 0.97, 85, 39), new CompanyDataBubble("HPLA", 0.75, 74, 54), new CompanyDataBubble("FSTW", 0.73, 74, 23), new CompanyDataBubble("HYSL", 0.83, 72, 55), new CompanyDataBubble("COOG", 0.82, 68, 52), new CompanyDataBubble("JDEC", 0.64, 68, 37), new CompanyDataBubble("OTEX", 0.65, 65, 22), new CompanyDataBubble("NTIQ", 0.52, 60, 24), new CompanyDataBubble("OOGN", 0.59, 58, 39), new CompanyDataBubble("ORCL", 0.54, 58, 65), new CompanyDataBubble("SY", 0.71, 58, 7), new CompanyDataBubble("PRGS", 0.69, 57, 19), new CompanyDataBubble("TALX", 0.34, 54, 16), new CompanyDataBubble("TTS", 0.38, 54, 4), new CompanyDataBubble("PRSE", 0.44, 50, 6), new CompanyDataBubble("BCBJ", 0.37, 48, 0), new CompanyDataBubble("DCTM", 0.53, 46, 67), new CompanyDataBubble("ULCM", 0.31, 44, 71), new CompanyDataBubble("MERQ", 0.56, 43, 38), new CompanyDataBubble("ATRS", 0.78, 42, 0), new CompanyDataBubble("JDAS", 0.34, 41, 32), new CompanyDataBubble("SAP", 0.48, 40, 11), new CompanyDataBubble("VRTY", 0.49, 39, 80), new CompanyDataBubble("PSFT", 0.38, 38, 42), new CompanyDataBubble("SRNA", 0.35, 36, 39), new CompanyDataBubble("SPSS", 0.58, 36, 18), new CompanyDataBubble("QSFT", 0.32, 35, 68), new CompanyDataBubble("PTEC", 0.51, 34, 10), new CompanyDataBubble("BMC", 0.58, 32, 37), new CompanyDataBubble("CTXS", 0.16, 32, 9), new CompanyDataBubble("PDFS", 0.22, 31, 18), new CompanyDataBubble("MRCL", 0.3, 30, 22), new CompanyDataBubble("CA", 0.24, 30, 33), new CompanyDataBubble("VRTS", 0.36, 29, 12), new CompanyDataBubble("TIBX", 0.31, 28, 6), new CompanyDataBubble("LTBG", 0.47, 23, 18), new CompanyDataBubble("RATL", 0.26, 23, 23), new CompanyDataBubble("SEBL", 0.23, 19, 15), new CompanyDataBubble("LWSN", 0.27, 16, 13) }; ObjectProvider objProvider = new ObjectProvider(companyData); chart1.getDataSourceSettings().setDataSource(objProvider); DataFieldCollection dataFieldCollection = chart1.getDataSourceSettings().getDataFields(); StringDataField dfSymbol = new StringDataField(); dfSymbol.setDataPath("Symbol"); NumericDataField dfStrength = new NumericDataField(); dfStrength.setDataPath("Strength"); NumericDataField dfRank = new NumericDataField(); dfRank.setDataPath("Rank"); NumericDataField dfPE = new NumericDataField(); dfPE.setDataPath("PE"); dataFieldCollection.add(dfSymbol); dataFieldCollection.add(dfStrength); dataFieldCollection.add(dfRank); dataFieldCollection.add(dfPE); chart1.getData().setSeries(2); SeriesBindings series0Bindings = chart1.getSeries().get(0).getBindings(); SeriesBindings series1Bindings = chart1.getSeries().get(1).getBindings(); series0Bindings.setX(dfStrength); series1Bindings.setX(dfStrength); series0Bindings.setY(dfRank); series1Bindings.setY(dfPE); chart1.getDataSourceSettings().readData(); }public static class CompanyDataBubble { public CompanyDataBubble(String symbol, double strengh, double rank, double pe) { this.setSymbol(symbol); this.setStrength(strengh); this.setRank(rank); this.setPE(pe); } private String privateSymbol; public final String getSymbol() { return privateSymbol; } public final void setSymbol(String value) { privateSymbol = value; } private double privateStrength; public final double getStrength() { return privateStrength; } public final void setStrength(double value) { privateStrength = value; } private double privateRank; public final double getRank() { return privateRank; } public final void setRank(double value) { privateRank = value; } private double privatePE; public final double getPE() { return privatePE; } public final void setPE(double value) { privatePE = value; } }
chart1.setChartBorder(new SimpleBorder(SimpleBorderType.NONE));
PopulateMiamiClimate(chart1,"High,Low");
chart1.getTitles().add(new TitleDockable("Miami Temperature Range in 2012"));
chart1.getAxisY().getTitle().setText("Temperature (°F)");
chart1.getAllSeries().getPointLabels().setVisible(true);
public static void PopulateMiamiClimate(Chart chart1, String fieldNames) { MiamiClimate[] data = new MiamiClimate[] { new MiamiClimate("Jan", 59.6, 76.5, 67.2, 1.88, 9.5, 59 ), new MiamiClimate("Feb", 60.5, 77.7, 68.5, 2.07, 10.1, 71 ), new MiamiClimate("Mar", 64, 80.7, 71.7, 2.56, 10.5, 69.5 ), new MiamiClimate("Apr", 67.6, 83.8, 75.2, 3.36, 10.5, 67.5 ), new MiamiClimate("May", 72, 87.2, 78.7, 5.52, 9.5, 67 ), new MiamiClimate("Jun", 75.2, 89.5, 81.4, 8.54, 8.3, 71 ), new MiamiClimate("Jul", 76.5, 90.9, 82.6, 5.79, 7.9, 74 ), new MiamiClimate("Aug", 76.5, 90.6, 82.8, 8.63, 7.9, 74 ), new MiamiClimate("Sep", 75.7, 89, 81.9, 8.38, 8.2, 76 ), new MiamiClimate("Oct", 72.2, 85.4, 78.3, 6.19, 9.2, 76 ), new MiamiClimate("Nov", 67.5, 81.2, 73.6, 3.43, 9.7, 74 ), new MiamiClimate("Dec", 62.2, 77.5, 69.1, 2.18, 9.2, 73 ) }; ObjectProvider objProvider = new ObjectProvider(data); chart1.getDataSourceSettings().setDataSource(objProvider); if (fieldNames != ""){ List<DataField> removeFields = new ArrayList<DataField>(); List<String> includeFields = Arrays.asList(fieldNames.split(",")); chart1.getDataSourceSettings().fillFromSchema(); for (DataField dataField : chart1.getDataSourceSettings().getDataFields()) { if (dataField.isMeasure() && !includeFields.contains(dataField.getDataPath())) { removeFields.add(dataField); } } for (DataField dataField : removeFields) { chart1.getDataSourceSettings().getDataFields().remove(dataField); } } } public static void PopulateMiamiClimate(Chart chart1) { PopulateMiamiClimate(chart1, ""); }public static class MiamiClimate { public MiamiClimate(String Month, double low, double high, double average, double precipitation, double windSpeed, double relativeHumidity) { this.setMonth(Month); this.setLow(low); this.setHigh(high); this.setAverage(average); this.setPrecipitation(precipitation); this.setWindSpeed(windSpeed); this.setRelativeHumidity(relativeHumidity); } private String privateMonth; public final String getMonth() { return privateMonth; } public final void setMonth(String value) { privateMonth = value; } private double privateLow; public final double getLow() { return privateLow; } public final void setLow(double value) { privateLow = value; } private double privateHigh; public final double getHigh() { return privateHigh; } public final void setHigh(double value) { privateHigh = value; } private double privateAverage; public final double getAverage() { return privateAverage; } public final void setAverage(double value) { privateAverage = value; } private double privatePrecipitation; public final double getPrecipitation() { return privatePrecipitation; } public final void setPrecipitation(double value) { privatePrecipitation = value; } private double privateWindSpeed; public final double getWindSpeed() { return privateWindSpeed; } public final void setWindSpeed(double value) { privateWindSpeed = value; } private double privateRelativeHumidity; public final double getRelativeHumidity() { return privateRelativeHumidity; } public final void setRelativeHumidity(double value) { privateRelativeHumidity = value; } }
- Parameters:
value-
-
getChartDataSource
public com.softwarefx.server.data.IDataSourceProvider getChartDataSource()
Gets or sets the source containing the values used to populate the chart.
This method is a shortcut to the
setDataSourcemethod of theDataSourceSettingsclass.Once the DataSource has been configured using this method, the chart is automatically bound to the data.
When reading data from text files, you will need to create the
TextProviderobject and use that as the DataSource:TextProvider txtProvider; txtProvider = new TextProvider("TextFile.txt"); chart1.setDataSource(txtProvider); txtProvider.Close();
When reading data from arrays, you will need to create the
ListProviderobject and use that as the DataSource:int[] values; values = new int[] {12, 15, 10, 7, 5}; ListProvider lstProvider; lstProvider = new ListProvider(values); chart1.setDataSource(lstProvider);
-
setChartDataSource
public void setChartDataSource(com.softwarefx.server.data.IDataSourceProvider value)
Gets or sets the source containing the values used to populate the chart.
This method is a shortcut to the
setDataSourcemethod of theDataSourceSettingsclass.Once the DataSource has been configured using this method, the chart is automatically bound to the data.
When reading data from text files, you will need to create the
TextProviderobject and use that as the DataSource:TextProvider txtProvider; txtProvider = new TextProvider("TextFile.txt"); chart1.setDataSource(txtProvider); txtProvider.Close();
When reading data from arrays, you will need to create the
ListProviderobject and use that as the DataSource:int[] values; values = new int[] {12, 15, 10, 7, 5}; ListProvider lstProvider; lstProvider = new ListProvider(values); chart1.setDataSource(lstProvider);
- Parameters:
value-
-
getChartFont
public java.awt.Font getChartFont()
Gets or sets the font type which will be used by default in the chart.
For more information see the Font class in Java.
Below, the default font of the chart is set to Times New Roman, italic and has a font size of 10:
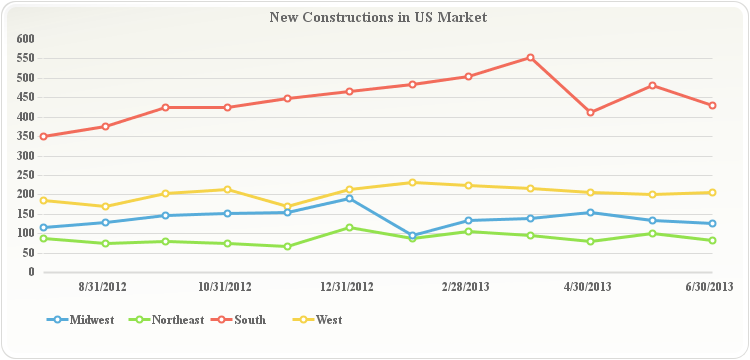
chart1.setChartFont(new java.awt.Font("Times New Roman",java.awt.Font.BOLD, 12));
PopulateNewConstructions(chart1);
chart1.getTitles().add(new TitleDockable("New Constructions in US Market"));
chart1.getLegendBox().setDock(DockArea.BOTTOM);
public static void PopulateNewConstructions(Chart chart1) { NewConstructions[] data = new NewConstructions[] { new NewConstructions(new java.util.GregorianCalendar(2012, 7, 1).getTime(), 88, 116, 351, 186 ), new NewConstructions(new java.util.GregorianCalendar(2012, 8, 1).getTime(), 75, 128, 376, 170 ), new NewConstructions(new java.util.GregorianCalendar(2012, 9, 1).getTime(), 79, 147, 424, 204 ), new NewConstructions(new java.util.GregorianCalendar(2012, 10, 1).getTime(), 75, 151, 425, 213 ), new NewConstructions(new java.util.GregorianCalendar(2012, 11, 1).getTime(), 68, 154, 449, 171 ), new NewConstructions(new java.util.GregorianCalendar(2012, 12, 1).getTime(), 115, 190, 465, 213 ), new NewConstructions(new java.util.GregorianCalendar(2013, 1, 1).getTime(), 87, 95, 483, 233 ), new NewConstructions(new java.util.GregorianCalendar(2013, 2, 1).getTime(), 106, 135, 505, 223 ), new NewConstructions(new java.util.GregorianCalendar(2013, 3, 1).getTime(), 94, 140, 554, 217 ), new NewConstructions(new java.util.GregorianCalendar(2013, 4, 1).getTime(), 79, 154, 412, 207 ), new NewConstructions(new java.util.GregorianCalendar(2013, 5, 1).getTime(), 101, 135, 482, 201 ), new NewConstructions(new java.util.GregorianCalendar(2013, 6, 1).getTime(), 82, 126, 431, 207 ) }; ObjectProvider objProvider = new ObjectProvider(data); chart1.getDataSourceSettings().setDataSource(objProvider); }public static class NewConstructions { public NewConstructions(java.util.Date date, double northeast, double midwest, double south, double west) { this.setDate(date); this.setNortheast(northeast); this.setMidwest(midwest); this.setSouth(south); this.setWest(west); } private java.util.Date privateDate = new java.util.Date(0); public final java.util.Date getDate() { return privateDate; } public final void setDate(java.util.Date value) { privateDate = value; } private double privateNortheast; public final double getNortheast() { return privateNortheast; } public final void setNortheast(double value) { privateNortheast = value; } private double privateMidwest; public final double getMidwest() { return privateMidwest; } public final void setMidwest(double value) { privateMidwest = value; } private double privateSouth; public final double getSouth() { return privateSouth; } public final void setSouth(double value) { privateSouth = value; } private double privateWest; public final double getWest() { return privateWest; } public final void setWest(double value) { privateWest = value; } }
-
setChartFont
public void setChartFont(java.awt.Font value)
Gets or sets the font type which will be used by default in the chart.
For more information see the Font class in Java.
Below, the default font of the chart is set to Times New Roman, italic and has a font size of 10:
chart1.setChartFont(new java.awt.Font("Times New Roman",java.awt.Font.BOLD, 12));
PopulateNewConstructions(chart1);
chart1.getTitles().add(new TitleDockable("New Constructions in US Market"));
chart1.getLegendBox().setDock(DockArea.BOTTOM);
public static void PopulateNewConstructions(Chart chart1) { NewConstructions[] data = new NewConstructions[] { new NewConstructions(new java.util.GregorianCalendar(2012, 7, 1).getTime(), 88, 116, 351, 186 ), new NewConstructions(new java.util.GregorianCalendar(2012, 8, 1).getTime(), 75, 128, 376, 170 ), new NewConstructions(new java.util.GregorianCalendar(2012, 9, 1).getTime(), 79, 147, 424, 204 ), new NewConstructions(new java.util.GregorianCalendar(2012, 10, 1).getTime(), 75, 151, 425, 213 ), new NewConstructions(new java.util.GregorianCalendar(2012, 11, 1).getTime(), 68, 154, 449, 171 ), new NewConstructions(new java.util.GregorianCalendar(2012, 12, 1).getTime(), 115, 190, 465, 213 ), new NewConstructions(new java.util.GregorianCalendar(2013, 1, 1).getTime(), 87, 95, 483, 233 ), new NewConstructions(new java.util.GregorianCalendar(2013, 2, 1).getTime(), 106, 135, 505, 223 ), new NewConstructions(new java.util.GregorianCalendar(2013, 3, 1).getTime(), 94, 140, 554, 217 ), new NewConstructions(new java.util.GregorianCalendar(2013, 4, 1).getTime(), 79, 154, 412, 207 ), new NewConstructions(new java.util.GregorianCalendar(2013, 5, 1).getTime(), 101, 135, 482, 201 ), new NewConstructions(new java.util.GregorianCalendar(2013, 6, 1).getTime(), 82, 126, 431, 207 ) }; ObjectProvider objProvider = new ObjectProvider(data); chart1.getDataSourceSettings().setDataSource(objProvider); }public static class NewConstructions { public NewConstructions(java.util.Date date, double northeast, double midwest, double south, double west) { this.setDate(date); this.setNortheast(northeast); this.setMidwest(midwest); this.setSouth(south); this.setWest(west); } private java.util.Date privateDate = new java.util.Date(0); public final java.util.Date getDate() { return privateDate; } public final void setDate(java.util.Date value) { privateDate = value; } private double privateNortheast; public final double getNortheast() { return privateNortheast; } public final void setNortheast(double value) { privateNortheast = value; } private double privateMidwest; public final double getMidwest() { return privateMidwest; } public final void setMidwest(double value) { privateMidwest = value; } private double privateSouth; public final double getSouth() { return privateSouth; } public final void setSouth(double value) { privateSouth = value; } private double privateWest; public final double getWest() { return privateWest; } public final void setWest(double value) { privateWest = value; } }
- Parameters:
value-
-
getCommands
public com.softwarefx.server.CommandCollection getCommands()
Gets the list of commands associated with the chart.
-
getConditionalAttributes
public IConditionalAttributesCollection getConditionalAttributes()
Returns the collection of ConditionalAttributes objects.chart1.getConditionalAttributes().get(0).getCondition().setActive(true);
-
getConfigureChartViewDelegate
public ConfigureChartViewDelegateListener getConfigureChartViewDelegate()
Gets or sets a View Delegate for the current chart.
-
setConfigureChartViewDelegate
public void setConfigureChartViewDelegate(ConfigureChartViewDelegateListener value)
Gets or sets a View Delegate for the current chart.
- Parameters:
value-
-
getContentUrl
public java.lang.String getContentUrl()
Gets or sets string which contains the URL for the content page when the user wants the chart data rendered to stream.
Allows the webform to receive data from the content page which renders to stream the data for the chart.
The ContentUrl string is placed as the chart image's source. (i.e.)
To use the ContentUrl method:
chart1.setContentUrl("http://www.sampleaddress.com");
-
setContentUrl
public void setContentUrl(java.lang.String value)
Gets or sets string which contains the URL for the content page when the user wants the chart data rendered to stream.
Allows the webform to receive data from the content page which renders to stream the data for the chart.
The ContentUrl string is placed as the chart image's source. (i.e.)
To use the ContentUrl method:
chart1.setContentUrl("http://www.sampleaddress.com");
- Parameters:
value-
-
isContextMenus
public boolean isContextMenus()
Allows you to enable or disable context sensitive menus when the user right clicks a particular chart element.
chart1.setContextMenus(false);
- See Also:
resetContextMenus
-
setContextMenus
public void setContextMenus(boolean value)
Allows you to enable or disable context sensitive menus when the user right clicks a particular chart element.
chart1.setContextMenus(false);
- Parameters:
value-- See Also:
resetContextMenus
-
isCrosshairs
public boolean isCrosshairs()
Enables or Disables the cross-hairs marker in the chart.chart1.setCrosshairs(true);
- See Also:
resetCrosshairs
-
setCrosshairs
public void setCrosshairs(boolean value)
Enables or Disables the cross-hairs marker in the chart.chart1.setCrosshairs(true);
- Parameters:
value-- See Also:
resetCrosshairs
-
getCulture
public java.util.Locale getCulture()
Allows you to localize charts for a specific language and region.chart1.setCulture(new SfxNET.System.Globalization.CultureInfo("es-ES"));
- See Also:
resetCulture
-
setCulture
public void setCulture(java.util.Locale value)
Allows you to localize charts for a specific language and region.chart1.setCulture(new SfxNET.System.Globalization.CultureInfo("es-ES"));
- Parameters:
value-- See Also:
resetCulture
-
getData
public DataValues getData()
Allows you to set the Y values. Alternativelly, the Y values can be access through the Y property of the DataValues class.
chart1.getData().set(0, 0, ((DataUnit)Chart.HIDDEN));
-
getDataAnalysisViews
public DataAnalysisViewCollection getDataAnalysisViews()
Allows you access the DataAnalysisViews collection.
DataAnalysisView data;
data = new DataAnalysisView();
data.setDataSource(new int[] {15, 12, 45, 8, 6});
chart1.getDataAnalysisViews().add(data);
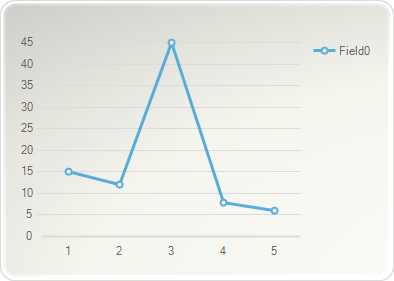
-
getDataGrid
public DataGrid getDataGrid()
Gets the DataGrid of the chart. The DataGrid is a spreadsheet that shows the data points in tabular format. When shown, it allows the user to see both the chart and the grid at the same time.
chart1.getDataGrid().setVisible(true);
PopulateCarProduction_SUV(chart1);
chart1.getTitles().add(new TitleDockable("Vehicles Production by Type"));
chart1.getLegendBox().setVisible(false);
public static void PopulateCarProduction_SUV(Chart chart1) { CarProduction[] production = new CarProduction[] { new CarProduction("Jan", 1760, 535, 695 ) , new CarProduction("Feb", 1849, 395, 688 ) , new CarProduction("Mar", 2831, 685, 1047 ) , new CarProduction("Apr", 2851, 984, 1652 ) , new CarProduction("May", 2961, 1579, 1889 ) , new CarProduction("Jun", 1519, 1539, 1766 ) , new CarProduction("Jul", 2633, 1489, 1361 ) , new CarProduction("Aug", 1140, 650, 874 ) , new CarProduction("Sep", 1626, 653, 693 ) , new CarProduction("Oct", 1478, 2236, 786 ) , new CarProduction("Nov", 1306, 1937, 599 ) , new CarProduction("Dec", 1607, 2138, 678 ) }; ObjectProvider objProvider = new ObjectProvider(production); chart1.getDataSourceSettings().setDataSource(objProvider); // Since not all the fields in the DataSource are required, we must specify the number // of series that will be contained in the chart and perform the corresponding bindings chart1.getData().setSeries(1); NumericDataField numericFieldSUV = new NumericDataField(); numericFieldSUV.setDataPath("SUV"); chart1.getDataSourceSettings().getDataFields().add(numericFieldSUV); chart1.getSeries().get(0).getBindings().setY(numericFieldSUV); StringDataField stringField = new StringDataField(); stringField.setDataPath("Month"); chart1.getDataSourceSettings().getDataFields().add(stringField); chart1.getAxisX().getBindings().setLabel(stringField); }public static void PopulateCarProduction(Chart chart1) { CarProduction[] production = new CarProduction[] { new CarProduction("Jan", 1760, 535, 695 ) , new CarProduction("Feb", 1849, 395, 688 ) , new CarProduction("Mar", 2831, 685, 1047 ) , new CarProduction("Apr", 2851, 984, 1652 ) , new CarProduction("May", 2961, 1579, 1889 ) , new CarProduction("Jun", 1519, 1539, 1766 ) , new CarProduction("Jul", 2633, 1489, 1361 ) , new CarProduction("Aug", 1140, 650, 874 ) , new CarProduction("Sep", 1626, 653, 693 ) , new CarProduction("Oct", 1478, 2236, 786 ) , new CarProduction("Nov", 1306, 1937, 599 ) , new CarProduction("Dec", 1607, 2138, 678 ) }; ObjectProvider objProvider = new ObjectProvider(production); chart1.getDataSourceSettings().setDataSource(objProvider); }public static class CarProduction { private CarProduction(String month, int sedan, int coupe, int SUV) { this.setMonth(month); this.setSedan(sedan); this.setCoupe(coupe); this.setSUV(SUV); } private String privateMonth; public final String getMonth() { return privateMonth; } public final void setMonth(String value) { privateMonth = value; } private int privateSedan; public final int getSedan() { return privateSedan; } public final void setSedan(int value) { privateSedan = value; } private int privateCoupe; public final int getCoupe() { return privateCoupe; } public final void setCoupe(int value) { privateCoupe = value; } private int privateSUV; public final int getSUV() { return privateSUV; } public final void setSUV(int value) { privateSUV = value; } }
-
getDataMember
public java.lang.String getDataMember()
Gets or sets the data mamber for the chart.
-
setDataMember
public void setDataMember(java.lang.String value)
Gets or sets the data mamber for the chart.- Parameters:
value-
-
getDataSourceID
public java.lang.String getDataSourceID()
Gets or sets the ID of the data source control the chart should use to retrieve its data source.
Use the
setDataSourceIDmethod to access the ID of the data source control that the data listing control should use to retrieve its data source. The data source control referenced by thesetDataSourceIDmethod can be any control that implements the IDataSource interface. The data source control must exist either in the same naming container as the data listing control that references it or in a parent control of the data listing control. When you specify a value for this method, the data listing control automatically binds to the specified data source control. You do not need to write code that explicitly calls thereadDatamethod.Alternately, you can use the
setChartDataSourcemethod to specify the source of values to bind to a data listing control. The data source must be an object that implements the IEnumerable interface (such as DataView, ArrayList, or Hashtable) or the IListSource interface to bind to a control derived from the BaseDataList class. When you set thesetChartDataSourcemethod, you must manually write the code to perform data binding.To configure the DataSourceID for a chart:
chart1.setDataSourceID("MyID");
-
setDataSourceID
public void setDataSourceID(java.lang.String value)
Gets or sets the ID of the data source control the chart should use to retrieve its data source.
Use the
setDataSourceIDmethod to access the ID of the data source control that the data listing control should use to retrieve its data source. The data source control referenced by thesetDataSourceIDmethod can be any control that implements the IDataSource interface. The data source control must exist either in the same naming container as the data listing control that references it or in a parent control of the data listing control. When you specify a value for this method, the data listing control automatically binds to the specified data source control. You do not need to write code that explicitly calls thereadDatamethod.Alternately, you can use the
setChartDataSourcemethod to specify the source of values to bind to a data listing control. The data source must be an object that implements the IEnumerable interface (such as DataView, ArrayList, or Hashtable) or the IListSource interface to bind to a control derived from the BaseDataList class. When you set thesetChartDataSourcemethod, you must manually write the code to perform data binding.To configure the DataSourceID for a chart:
chart1.setDataSourceID("MyID");
- Parameters:
value-
-
getDataSourceSettings
public DataSourceSettings getDataSourceSettings()
Used to assign data related attributes to your chart applications.
chart1.getDataSourceSettings().setDataSource(DataSet1.getTables().get(0));
-
isDirty
public boolean isDirty()
Returns a boolean specifying if the chart has been modified by the user.boolean isDirty; isDirty = chart1.getDirty();
-
setDirty
public void setDirty(boolean value)
Returns a boolean specifying if the chart has been modified by the user.boolean isDirty; isDirty = chart1.getDirty();
- Parameters:
value-
-
getDrillDownType
public DrillDownType getDrillDownType()
Used to set the DrillDown option in the series context menu.
chart1.setDrillDownType(DrillDownType.InPlace);
- See Also:
resetDrillDownType
-
setDrillDownType
public void setDrillDownType(DrillDownType value)
Used to set the DrillDown option in the series context menu.
chart1.setDrillDownType(DrillDownType.InPlace);
- Parameters:
value-- See Also:
resetDrillDownType
-
getExportImageSize
public java.awt.Dimension getExportImageSize()
Gets or sets the image dimensions for exported chart images.chart1.setExportImageSize(new SfxNET.System.Drawing.Size(310, 215).StructClone());
-
setExportImageSize
public void setExportImageSize(java.awt.Dimension value)
Gets or sets the image dimensions for exported chart images.chart1.setExportImageSize(new SfxNET.System.Drawing.Size(310, 215).StructClone());
- Parameters:
value-
-
getExtensions
public ExtensionCollection getExtensions()
Collection used to add, clear and assign Chart FX extension objects.
chart1.getExtensions().clear();
Annotations annots;
annots = new Annotations();
chart1.getExtensions().add(((IExtension)annots));
-
getExtraStyle
public java.util.EnumSet<ChartStyles> getExtraStyle()
Allows you to set additional visual attributes in the chart.
This method is set using the bitwise operators (And, Or, Not, Xor) provided by your class.
This method uses bitwise operators to turn on and off settings. To combine two flags, use the 'Or' bitwise operator.
For example, the correct way to turn on the Monochrome setting is the following:
java.util.EnumSet<ChartStyles> style = chart1.getExtraStyle();
style.add(ChartStyles.MONOCHROME);
chart1.setExtraStyle(style);
The following code is WRONG (it will erase all other settings in the method causing an erratic behavior of the library and an incorrect setting of the individual methods which also control these flags):
chart1.setExtraStyle(ChartStyles.MONOCHROME);
- See Also:
resetExtraStyle
-
setExtraStyle
public void setExtraStyle(java.util.EnumSet<ChartStyles> value)
Allows you to set additional visual attributes in the chart.
This method is set using the bitwise operators (And, Or, Not, Xor) provided by your class.
This method uses bitwise operators to turn on and off settings. To combine two flags, use the 'Or' bitwise operator.
For example, the correct way to turn on the Monochrome setting is the following:
java.util.EnumSet<ChartStyles> style = chart1.getExtraStyle();
style.add(ChartStyles.MONOCHROME);
chart1.setExtraStyle(style);
The following code is WRONG (it will erase all other settings in the method causing an erratic behavior of the library and an incorrect setting of the individual methods which also control these flags):
chart1.setExtraStyle(ChartStyles.MONOCHROME);
- Parameters:
value-- See Also:
resetExtraStyle
-
getFileContents
public java.util.EnumSet<FileContents> getFileContents()
Gets or sets the attributes to save in chart files (Export method).
The
setFileContentsmethod is used to customize the chart attributes saved in 'Binary' and 'XML' FileFormat output.Use the
exportChartmethod to export charts as binary output containing the contents specified with this method.This method is a mask method, this means all settings represent a bit in the word that you need to turn on or off according to what you want. For this purpose you'll need to use the bitwise operators supported by your development environment. Also ensure you use these operators to turn on/off bits and avoid losing previous settings.
The
setTemplateContentsproperty may be used to customize what attributes are saved into chart template files (FileFormat.BINARY_TEMPLATE).By default the setting of this property is 'ALL' so all chart settings are actually saved in the chart file (including data).
To configure FileContents so Font attributes are NOT saved:
java.util.EnumSet<FileContents> fileContents = chart1.getFileContents();
fileContents.remove(FileContents.FONTS);
chart1.setFileContents(fileContents);
-
setFileContents
public void setFileContents(java.util.EnumSet<FileContents> value)
Gets or sets the attributes to save in chart files (Export method).
The
setFileContentsmethod is used to customize the chart attributes saved in 'Binary' and 'XML' FileFormat output.Use the
exportChartmethod to export charts as binary output containing the contents specified with this method.This method is a mask method, this means all settings represent a bit in the word that you need to turn on or off according to what you want. For this purpose you'll need to use the bitwise operators supported by your development environment. Also ensure you use these operators to turn on/off bits and avoid losing previous settings.
The
setTemplateContentsproperty may be used to customize what attributes are saved into chart template files (FileFormat.BINARY_TEMPLATE).By default the setting of this property is 'ALL' so all chart settings are actually saved in the chart file (including data).
To configure FileContents so Font attributes are NOT saved:
java.util.EnumSet<FileContents> fileContents = chart1.getFileContents();
fileContents.remove(FileContents.FONTS);
chart1.setFileContents(fileContents);
- Parameters:
value-
-
getForeColor
public java.awt.Color getForeColor()
Gets or sets the default font color of the chart.
chart1.setForeColor(new java.awt.Color(0,128,0,255));
PopulateCarProduction(chart1);
chart1.getTitles().add(new TitleDockable("Vehicles Production by Type"));
public static void PopulateCarProduction(Chart chart1) { CarProduction[] production = new CarProduction[] { new CarProduction("Jan", 1760, 535, 695 ) , new CarProduction("Feb", 1849, 395, 688 ) , new CarProduction("Mar", 2831, 685, 1047 ) , new CarProduction("Apr", 2851, 984, 1652 ) , new CarProduction("May", 2961, 1579, 1889 ) , new CarProduction("Jun", 1519, 1539, 1766 ) , new CarProduction("Jul", 2633, 1489, 1361 ) , new CarProduction("Aug", 1140, 650, 874 ) , new CarProduction("Sep", 1626, 653, 693 ) , new CarProduction("Oct", 1478, 2236, 786 ) , new CarProduction("Nov", 1306, 1937, 599 ) , new CarProduction("Dec", 1607, 2138, 678 ) }; ObjectProvider objProvider = new ObjectProvider(production); chart1.getDataSourceSettings().setDataSource(objProvider); }public static class CarProduction { private CarProduction(String month, int sedan, int coupe, int SUV) { this.setMonth(month); this.setSedan(sedan); this.setCoupe(coupe); this.setSUV(SUV); } private String privateMonth; public final String getMonth() { return privateMonth; } public final void setMonth(String value) { privateMonth = value; } private int privateSedan; public final int getSedan() { return privateSedan; } public final void setSedan(int value) { privateSedan = value; } private int privateCoupe; public final int getCoupe() { return privateCoupe; } public final void setCoupe(int value) { privateCoupe = value; } private int privateSUV; public final int getSUV() { return privateSUV; } public final void setSUV(int value) { privateSUV = value; } }
- See Also:
resetForeColor
-
setForeColor
public void setForeColor(java.awt.Color value)
Gets or sets the default font color of the chart.
chart1.setForeColor(new java.awt.Color(0,128,0,255));
PopulateCarProduction(chart1);
chart1.getTitles().add(new TitleDockable("Vehicles Production by Type"));
public static void PopulateCarProduction(Chart chart1) { CarProduction[] production = new CarProduction[] { new CarProduction("Jan", 1760, 535, 695 ) , new CarProduction("Feb", 1849, 395, 688 ) , new CarProduction("Mar", 2831, 685, 1047 ) , new CarProduction("Apr", 2851, 984, 1652 ) , new CarProduction("May", 2961, 1579, 1889 ) , new CarProduction("Jun", 1519, 1539, 1766 ) , new CarProduction("Jul", 2633, 1489, 1361 ) , new CarProduction("Aug", 1140, 650, 874 ) , new CarProduction("Sep", 1626, 653, 693 ) , new CarProduction("Oct", 1478, 2236, 786 ) , new CarProduction("Nov", 1306, 1937, 599 ) , new CarProduction("Dec", 1607, 2138, 678 ) }; ObjectProvider objProvider = new ObjectProvider(production); chart1.getDataSourceSettings().setDataSource(objProvider); }public static class CarProduction { private CarProduction(String month, int sedan, int coupe, int SUV) { this.setMonth(month); this.setSedan(sedan); this.setCoupe(coupe); this.setSUV(SUV); } private String privateMonth; public final String getMonth() { return privateMonth; } public final void setMonth(String value) { privateMonth = value; } private int privateSedan; public final int getSedan() { return privateSedan; } public final void setSedan(int value) { privateSedan = value; } private int privateCoupe; public final int getCoupe() { return privateCoupe; } public final void setCoupe(int value) { privateCoupe = value; } private int privateSUV; public final int getSUV() { return privateSUV; } public final void setSUV(int value) { privateSUV = value; } }
- Parameters:
value-- See Also:
resetForeColor
-
getGallery
public Gallery getGallery()
Sets the gallery type for the whole chart.
When you set the gallery with this property, it applies to all the series in the chart. If you want to create a Multitype (combination) chart you need to assign galleries individally for each series. Please refer to the
setGalleryproperties of theSeriesAttributesclass.setGalleryAttributesallows you to assign additional attributes to selected gallery types.To display an AREA chart:
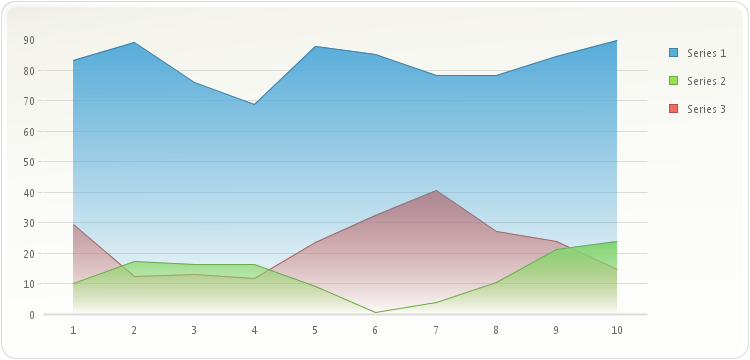
chart1.setGallery(Gallery.AREA);
-
setGallery
public void setGallery(Gallery value)
Sets the gallery type for the whole chart.
When you set the gallery with this property, it applies to all the series in the chart. If you want to create a Multitype (combination) chart you need to assign galleries individally for each series. Please refer to the
setGalleryproperties of theSeriesAttributesclass.setGalleryAttributesallows you to assign additional attributes to selected gallery types.To display an AREA chart:
chart1.setGallery(Gallery.AREA);
- Parameters:
value-
-
getGalleryAttributes
public IGallery getGalleryAttributes()
Used to create a gallery object to assign additional attributes to the selected gallery type of the chart.
This method returns an object which allows assignment of special methods to be set for the selected gallery.
The gallery attribute can also be accessed through the
setAllSeriesmethod.The type of the gallery attribute returned depends on the global gallery used by the chart. Therefore, you must convert the returned object to a specific gallery object before you can access its methods.
Below, the attributes of the Bar gallery are modified to eliminate the space between the bars for different series of the same point:
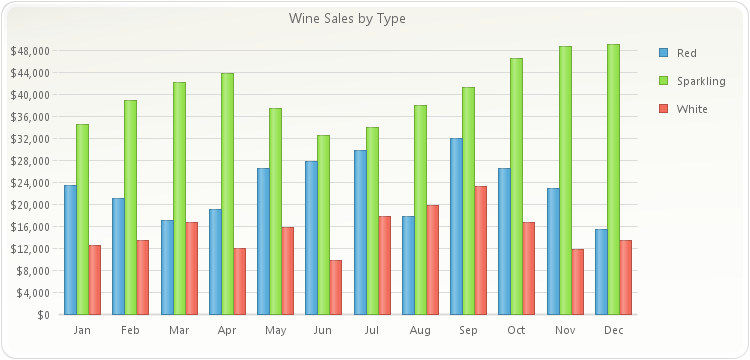
chart1.setGallery(Gallery.BAR);
Bar bar;
bar = ((Bar)chart1.getGalleryAttributes());
bar.setIntraSeriesGap((short) 0);
PopulateProductSales(chart1);
chart1.getTitles().add(new TitleDockable("Wine Sales by Type"));
chart1.getAxisY().getLabelsFormat().setFormat(AxisFormat.CURRENCY);
public static void PopulateProductSales(Chart chart1) { ProductSales[] data = new ProductSales[]{ new ProductSales("Jan", 12560, 23400, 34500), new ProductSales("Feb", 13400, 21000, 38900), new ProductSales("Mar", 16700, 17000, 42100), new ProductSales("Apr", 12000, 19020, 43800), new ProductSales("May", 15800, 26500, 37540), new ProductSales("Jun", 9800, 27800, 32580), new ProductSales("Jul", 17800, 29820, 34000), new ProductSales("Aug", 19800, 17800, 38000), new ProductSales("Sep", 23200, 32000, 41300), new ProductSales("Oct", 16700, 26500, 46590), new ProductSales("Nov", 11800, 23000, 48700), new ProductSales("Dec", 13400, 15400, 49100) }; ObjectProvider objProvider = new ObjectProvider(data); chart1.getDataSourceSettings().setDataSource(objProvider); }public static class ProductSales { public ProductSales(String month, double white, double red, double sparkling) { this.setMonth(month); this.setWhite(white); this.setRed(red); this.setSparkling(sparkling); } private String privateMonth; public final String getMonth() { return privateMonth; } public final void setMonth(String value) { privateMonth = value; } private double privateWhite; public final double getWhite() { return privateWhite; } public final void setWhite(double value) { privateWhite = value; } private double privateRed; public final double getRed() { return privateRed; } public final void setRed(double value) { privateRed = value; } private double privateSparkling; public final double getSparkling() { return privateSparkling; } public final void setSparkling(double value) { privateSparkling = value; } }
Note: Not all gallery types support additional methods.
-
setGalleryAttributes
public void setGalleryAttributes(IGallery value)
Used to create a gallery object to assign additional attributes to the selected gallery type of the chart.
This method returns an object which allows assignment of special methods to be set for the selected gallery.
The gallery attribute can also be accessed through the
setAllSeriesmethod.The type of the gallery attribute returned depends on the global gallery used by the chart. Therefore, you must convert the returned object to a specific gallery object before you can access its methods.
Below, the attributes of the Bar gallery are modified to eliminate the space between the bars for different series of the same point:
chart1.setGallery(Gallery.BAR);
Bar bar;
bar = ((Bar)chart1.getGalleryAttributes());
bar.setIntraSeriesGap((short) 0);
PopulateProductSales(chart1);
chart1.getTitles().add(new TitleDockable("Wine Sales by Type"));
chart1.getAxisY().getLabelsFormat().setFormat(AxisFormat.CURRENCY);
public static void PopulateProductSales(Chart chart1) { ProductSales[] data = new ProductSales[]{ new ProductSales("Jan", 12560, 23400, 34500), new ProductSales("Feb", 13400, 21000, 38900), new ProductSales("Mar", 16700, 17000, 42100), new ProductSales("Apr", 12000, 19020, 43800), new ProductSales("May", 15800, 26500, 37540), new ProductSales("Jun", 9800, 27800, 32580), new ProductSales("Jul", 17800, 29820, 34000), new ProductSales("Aug", 19800, 17800, 38000), new ProductSales("Sep", 23200, 32000, 41300), new ProductSales("Oct", 16700, 26500, 46590), new ProductSales("Nov", 11800, 23000, 48700), new ProductSales("Dec", 13400, 15400, 49100) }; ObjectProvider objProvider = new ObjectProvider(data); chart1.getDataSourceSettings().setDataSource(objProvider); }public static class ProductSales { public ProductSales(String month, double white, double red, double sparkling) { this.setMonth(month); this.setWhite(white); this.setRed(red); this.setSparkling(sparkling); } private String privateMonth; public final String getMonth() { return privateMonth; } public final void setMonth(String value) { privateMonth = value; } private double privateWhite; public final double getWhite() { return privateWhite; } public final void setWhite(double value) { privateWhite = value; } private double privateRed; public final double getRed() { return privateRed; } public final void setRed(double value) { privateRed = value; } private double privateSparkling; public final double getSparkling() { return privateSparkling; } public final void setSparkling(double value) { privateSparkling = value; } }
Note: Not all gallery types support additional methods.- Parameters:
value-
-
getHeight
public int getHeight()
Description goes here
-
setHeight
public void setHeight(int value)
Description goes here- Parameters:
value-
-
getHighlight
public HighlightAttributes getHighlight()
Allows you to customized how all the series of the chart are highlighted. To highlight a series in a chart, simply hover the mouse over a desired series while this property is set to true.chart1.getHighlight().setEnabled(false);
-
isIgnoreDesignMode
public boolean isIgnoreDesignMode()
Allows or denies that the end user make changes to the chart.
chart1.setIgnoreDesignMode(true);
-
setIgnoreDesignMode
public void setIgnoreDesignMode(boolean value)
Allows or denies that the end user make changes to the chart.
chart1.setIgnoreDesignMode(true);
- Parameters:
value-
-
getImageSettings
public ImageSettings getImageSettings()
Description goes here
-
getLegendBox
public LegendBox getLegendBox()
Allows you to acces the legend box of the chart.
chart1.getLegendBox().setDock(DockArea.BOTTOM);
chart1.getLegendBox().setVisible(true);
chart1.getLegendBox().setBorder(DockBorder.INTERNAL);
chart1.getLegendBox().setContentLayout(ContentLayout.CENTER);
PopulateCarProduction(chart1);
chart1.setGallery(Gallery.BAR);
chart1.getTitles().add(new TitleDockable("Vehicles Production by Type"));
public static void PopulateCarProduction(Chart chart1) { CarProduction[] production = new CarProduction[] { new CarProduction("Jan", 1760, 535, 695 ) , new CarProduction("Feb", 1849, 395, 688 ) , new CarProduction("Mar", 2831, 685, 1047 ) , new CarProduction("Apr", 2851, 984, 1652 ) , new CarProduction("May", 2961, 1579, 1889 ) , new CarProduction("Jun", 1519, 1539, 1766 ) , new CarProduction("Jul", 2633, 1489, 1361 ) , new CarProduction("Aug", 1140, 650, 874 ) , new CarProduction("Sep", 1626, 653, 693 ) , new CarProduction("Oct", 1478, 2236, 786 ) , new CarProduction("Nov", 1306, 1937, 599 ) , new CarProduction("Dec", 1607, 2138, 678 ) }; ObjectProvider objProvider = new ObjectProvider(production); chart1.getDataSourceSettings().setDataSource(objProvider); }public static class CarProduction { private CarProduction(String month, int sedan, int coupe, int SUV) { this.setMonth(month); this.setSedan(sedan); this.setCoupe(coupe); this.setSUV(SUV); } private String privateMonth; public final String getMonth() { return privateMonth; } public final void setMonth(String value) { privateMonth = value; } private int privateSedan; public final int getSedan() { return privateSedan; } public final void setSedan(int value) { privateSedan = value; } private int privateCoupe; public final int getCoupe() { return privateCoupe; } public final void setCoupe(int value) { privateCoupe = value; } private int privateSUV; public final int getSUV() { return privateSUV; } public final void setSUV(int value) { privateSUV = value; } }
-
getMainPane
public Pane getMainPane()
Gets the default pane of the chart.
chart1.getMainPane().setBackColor(new java.awt.Color(0,0,255,255));
PopulateCompanyDataBubble_Strength_Rank_PE(chart1);
chart1.getTitles().add(new TitleDockable("Companies Fundamentals"));
chart1.getPanes().add(new Pane());
chart1.getPanes().add(new Pane());
chart1.getData().setSeries(3);
chart1.getSeries().get(0).setPane(chart1.getPanes().get(2));
chart1.getSeries().get(0).setGallery(Gallery.LINES);
chart1.getSeries().get(1).setPane(chart1.getPanes().get(1));
chart1.getSeries().get(2).setPane(chart1.getMainPane());
chart1.getSeries().get(2).setGallery(Gallery.BAR);
public static void PopulateCompanyDataBubble_Strength_Rank_PE(Chart chart1) { CompanyDataBubble[] companyData = new CompanyDataBubble[]{ new CompanyDataBubble("DODC", 0.97, 85, 39), new CompanyDataBubble("HPLA", 0.75, 74, 54), new CompanyDataBubble("FSTW", 0.73, 74, 23), new CompanyDataBubble("HYSL", 0.83, 72, 55), new CompanyDataBubble("COOG", 0.82, 68, 52), new CompanyDataBubble("JDEC", 0.64, 68, 37), new CompanyDataBubble("OTEX", 0.65, 65, 22), new CompanyDataBubble("NTIQ", 0.52, 60, 24), new CompanyDataBubble("OOGN", 0.59, 58, 39), new CompanyDataBubble("ORCL", 0.54, 58, 65), new CompanyDataBubble("SY", 0.71, 58, 7), new CompanyDataBubble("PRGS", 0.69, 57, 19), new CompanyDataBubble("TALX", 0.34, 54, 16), new CompanyDataBubble("TTS", 0.38, 54, 4), new CompanyDataBubble("PRSE", 0.44, 50, 6), new CompanyDataBubble("BCBJ", 0.37, 48, 0), new CompanyDataBubble("DCTM", 0.53, 46, 67), new CompanyDataBubble("ULCM", 0.31, 44, 71), new CompanyDataBubble("MERQ", 0.56, 43, 38), new CompanyDataBubble("ATRS", 0.78, 42, 0), new CompanyDataBubble("JDAS", 0.34, 41, 32), new CompanyDataBubble("SAP", 0.48, 40, 11), new CompanyDataBubble("VRTY", 0.49, 39, 80), new CompanyDataBubble("PSFT", 0.38, 38, 42), new CompanyDataBubble("SRNA", 0.35, 36, 39), new CompanyDataBubble("SPSS", 0.58, 36, 18), new CompanyDataBubble("QSFT", 0.32, 35, 68), new CompanyDataBubble("PTEC", 0.51, 34, 10), new CompanyDataBubble("BMC", 0.58, 32, 37), new CompanyDataBubble("CTXS", 0.16, 32, 9), new CompanyDataBubble("PDFS", 0.22, 31, 18), new CompanyDataBubble("MRCL", 0.3, 30, 22), new CompanyDataBubble("CA", 0.24, 30, 33), new CompanyDataBubble("VRTS", 0.36, 29, 12), new CompanyDataBubble("TIBX", 0.31, 28, 6), new CompanyDataBubble("LTBG", 0.47, 23, 18), new CompanyDataBubble("RATL", 0.26, 23, 23), new CompanyDataBubble("SEBL", 0.23, 19, 15), new CompanyDataBubble("LWSN", 0.27, 16, 13) }; ObjectProvider objProvider = new ObjectProvider(companyData); chart1.getDataSourceSettings().setDataSource(objProvider); // Since not all the fields in the DataSource are required, we must specify the number // of series that will be contained in the chart and perform the corresponding bindings chart1.getData().setSeries(3); NumericDataField numericFieldStrength = new NumericDataField(); numericFieldStrength.setDataPath("Strength"); chart1.getDataSourceSettings().getDataFields().add(numericFieldStrength); chart1.getSeries().get(0).getBindings().setY(numericFieldStrength); NumericDataField numericFieldRank = new NumericDataField(); numericFieldRank.setDataPath("Rank"); chart1.getDataSourceSettings().getDataFields().add(numericFieldRank); chart1.getSeries().get(1).getBindings().setY(numericFieldRank); NumericDataField numericFieldPE = new NumericDataField(); numericFieldPE.setDataPath("PE"); chart1.getDataSourceSettings().getDataFields().add(numericFieldPE); chart1.getSeries().get(2).getBindings().setY(numericFieldPE); StringDataField stringFieldMonth = new StringDataField(); stringFieldMonth.setDataPath("Symbol"); chart1.getDataSourceSettings().getDataFields().add(stringFieldMonth); chart1.getAxisX().getBindings().setLabel(stringFieldMonth); }public static void PopulateCompanyDataBubble(Chart chart1) { CompanyDataBubble[] companyData = new CompanyDataBubble[]{ new CompanyDataBubble("DODC", 0.97, 85, 39), new CompanyDataBubble("HPLA", 0.75, 74, 54), new CompanyDataBubble("FSTW", 0.73, 74, 23), new CompanyDataBubble("HYSL", 0.83, 72, 55), new CompanyDataBubble("COOG", 0.82, 68, 52), new CompanyDataBubble("JDEC", 0.64, 68, 37), new CompanyDataBubble("OTEX", 0.65, 65, 22), new CompanyDataBubble("NTIQ", 0.52, 60, 24), new CompanyDataBubble("OOGN", 0.59, 58, 39), new CompanyDataBubble("ORCL", 0.54, 58, 65), new CompanyDataBubble("SY", 0.71, 58, 7), new CompanyDataBubble("PRGS", 0.69, 57, 19), new CompanyDataBubble("TALX", 0.34, 54, 16), new CompanyDataBubble("TTS", 0.38, 54, 4), new CompanyDataBubble("PRSE", 0.44, 50, 6), new CompanyDataBubble("BCBJ", 0.37, 48, 0), new CompanyDataBubble("DCTM", 0.53, 46, 67), new CompanyDataBubble("ULCM", 0.31, 44, 71), new CompanyDataBubble("MERQ", 0.56, 43, 38), new CompanyDataBubble("ATRS", 0.78, 42, 0), new CompanyDataBubble("JDAS", 0.34, 41, 32), new CompanyDataBubble("SAP", 0.48, 40, 11), new CompanyDataBubble("VRTY", 0.49, 39, 80), new CompanyDataBubble("PSFT", 0.38, 38, 42), new CompanyDataBubble("SRNA", 0.35, 36, 39), new CompanyDataBubble("SPSS", 0.58, 36, 18), new CompanyDataBubble("QSFT", 0.32, 35, 68), new CompanyDataBubble("PTEC", 0.51, 34, 10), new CompanyDataBubble("BMC", 0.58, 32, 37), new CompanyDataBubble("CTXS", 0.16, 32, 9), new CompanyDataBubble("PDFS", 0.22, 31, 18), new CompanyDataBubble("MRCL", 0.3, 30, 22), new CompanyDataBubble("CA", 0.24, 30, 33), new CompanyDataBubble("VRTS", 0.36, 29, 12), new CompanyDataBubble("TIBX", 0.31, 28, 6), new CompanyDataBubble("LTBG", 0.47, 23, 18), new CompanyDataBubble("RATL", 0.26, 23, 23), new CompanyDataBubble("SEBL", 0.23, 19, 15), new CompanyDataBubble("LWSN", 0.27, 16, 13) }; ObjectProvider objProvider = new ObjectProvider(companyData); chart1.getDataSourceSettings().setDataSource(objProvider); DataFieldCollection dataFieldCollection = chart1.getDataSourceSettings().getDataFields(); StringDataField dfSymbol = new StringDataField(); dfSymbol.setDataPath("Symbol"); NumericDataField dfStrength = new NumericDataField(); dfStrength.setDataPath("Strength"); NumericDataField dfRank = new NumericDataField(); dfRank.setDataPath("Rank"); NumericDataField dfPE = new NumericDataField(); dfPE.setDataPath("PE"); dataFieldCollection.add(dfSymbol); dataFieldCollection.add(dfStrength); dataFieldCollection.add(dfRank); dataFieldCollection.add(dfPE); chart1.getData().setSeries(2); SeriesBindings series0Bindings = chart1.getSeries().get(0).getBindings(); SeriesBindings series1Bindings = chart1.getSeries().get(1).getBindings(); series0Bindings.setX(dfStrength); series1Bindings.setX(dfStrength); series0Bindings.setY(dfRank); series1Bindings.setY(dfPE); chart1.getDataSourceSettings().readData(); }public static class CompanyDataBubble { public CompanyDataBubble(String symbol, double strengh, double rank, double pe) { this.setSymbol(symbol); this.setStrength(strengh); this.setRank(rank); this.setPE(pe); } private String privateSymbol; public final String getSymbol() { return privateSymbol; } public final void setSymbol(String value) { privateSymbol = value; } private double privateStrength; public final double getStrength() { return privateStrength; } public final void setStrength(double value) { privateStrength = value; } private double privateRank; public final double getRank() { return privateRank; } public final void setRank(double value) { privateRank = value; } private double privatePE; public final double getPE() { return privatePE; } public final void setPE(double value) { privatePE = value; } }
-
getMenuBar
public DockableBar getMenuBar()
Description goes here
-
isMonochrome
public boolean isMonochrome()
Gets or sets some chart attibutes color to Monochromechart1.setMonochrome(true);
- See Also:
resetMonochrome
-
setMonochrome
public void setMonochrome(boolean value)
Gets or sets some chart attibutes color to Monochromechart1.setMonochrome(true);
- Parameters:
value-- See Also:
resetMonochrome
-
getPageColor
public java.awt.Color getPageColor()
Allows you to specify a form background color needed to fill areas around image border shadowing.
chart1.setPageColor(new java.awt.Color(128,0,128,255));
chart1.setChartBorder(new ImageBorder(ImageBorderType.MUSEUM));
PopulateProductSales(chart1);
chart1.getTitles().add(new TitleDockable("Wine Sales by Type"));
chart1.getAxisY().getLabelsFormat().setFormat(AxisFormat.CURRENCY);
public static void PopulateProductSales(Chart chart1) { ProductSales[] data = new ProductSales[]{ new ProductSales("Jan", 12560, 23400, 34500), new ProductSales("Feb", 13400, 21000, 38900), new ProductSales("Mar", 16700, 17000, 42100), new ProductSales("Apr", 12000, 19020, 43800), new ProductSales("May", 15800, 26500, 37540), new ProductSales("Jun", 9800, 27800, 32580), new ProductSales("Jul", 17800, 29820, 34000), new ProductSales("Aug", 19800, 17800, 38000), new ProductSales("Sep", 23200, 32000, 41300), new ProductSales("Oct", 16700, 26500, 46590), new ProductSales("Nov", 11800, 23000, 48700), new ProductSales("Dec", 13400, 15400, 49100) }; ObjectProvider objProvider = new ObjectProvider(data); chart1.getDataSourceSettings().setDataSource(objProvider); }public static class ProductSales { public ProductSales(String month, double white, double red, double sparkling) { this.setMonth(month); this.setWhite(white); this.setRed(red); this.setSparkling(sparkling); } private String privateMonth; public final String getMonth() { return privateMonth; } public final void setMonth(String value) { privateMonth = value; } private double privateWhite; public final double getWhite() { return privateWhite; } public final void setWhite(double value) { privateWhite = value; } private double privateRed; public final double getRed() { return privateRed; } public final void setRed(double value) { privateRed = value; } private double privateSparkling; public final double getSparkling() { return privateSparkling; } public final void setSparkling(double value) { privateSparkling = value; } }
- See Also:
resetPageColor
-
setPageColor
public void setPageColor(java.awt.Color value)
Allows you to specify a form background color needed to fill areas around image border shadowing.
chart1.setPageColor(new java.awt.Color(128,0,128,255));
chart1.setChartBorder(new ImageBorder(ImageBorderType.MUSEUM));
PopulateProductSales(chart1);
chart1.getTitles().add(new TitleDockable("Wine Sales by Type"));
chart1.getAxisY().getLabelsFormat().setFormat(AxisFormat.CURRENCY);
public static void PopulateProductSales(Chart chart1) { ProductSales[] data = new ProductSales[]{ new ProductSales("Jan", 12560, 23400, 34500), new ProductSales("Feb", 13400, 21000, 38900), new ProductSales("Mar", 16700, 17000, 42100), new ProductSales("Apr", 12000, 19020, 43800), new ProductSales("May", 15800, 26500, 37540), new ProductSales("Jun", 9800, 27800, 32580), new ProductSales("Jul", 17800, 29820, 34000), new ProductSales("Aug", 19800, 17800, 38000), new ProductSales("Sep", 23200, 32000, 41300), new ProductSales("Oct", 16700, 26500, 46590), new ProductSales("Nov", 11800, 23000, 48700), new ProductSales("Dec", 13400, 15400, 49100) }; ObjectProvider objProvider = new ObjectProvider(data); chart1.getDataSourceSettings().setDataSource(objProvider); }public static class ProductSales { public ProductSales(String month, double white, double red, double sparkling) { this.setMonth(month); this.setWhite(white); this.setRed(red); this.setSparkling(sparkling); } private String privateMonth; public final String getMonth() { return privateMonth; } public final void setMonth(String value) { privateMonth = value; } private double privateWhite; public final double getWhite() { return privateWhite; } public final void setWhite(double value) { privateWhite = value; } private double privateRed; public final double getRed() { return privateRed; } public final void setRed(double value) { privateRed = value; } private double privateSparkling; public final double getSparkling() { return privateSparkling; } public final void setSparkling(double value) { privateSparkling = value; } }
- Parameters:
value-- See Also:
resetPageColor
-
getPalette
public java.lang.String getPalette()
Allows you to set a predefined color palette.
chart1.setPalette("ChartFX6.EarthTones");
PopulateSouthAmericaPopulation(chart1);
chart1.setGallery(Gallery.BAR);
chart1.getLegendBox().setVisible(false);
chart1.getTitles().add(new TitleDockable("South American Countries Population"));
chart1.getAxisY().setScaleUnit(1000000);
chart1.getAxisY().getTitle().setText("(in Millions)");
public static void PopulateSouthAmericaPopulation(Chart chart1) { SouthAmericaPopulation[] data = new SouthAmericaPopulation[]{ new SouthAmericaPopulation("Brazil", 201033000), new SouthAmericaPopulation("Colombia", 47130000), new SouthAmericaPopulation("Argentina", 41350000), new SouthAmericaPopulation("Peru", 30476000), new SouthAmericaPopulation("Venezuela", 29760000), new SouthAmericaPopulation("Chile", 16841000), new SouthAmericaPopulation("Ecuador", 15779000), new SouthAmericaPopulation("Bolivia", 10517000) }; ObjectProvider objProvider = new ObjectProvider(data); chart1.getDataSourceSettings().setDataSource(objProvider); }public static class SouthAmericaPopulation { public SouthAmericaPopulation(String country, double population) { this.setCountry(country); this.setPopulation(population); } private String privateCountry; public final String getCountry() { return privateCountry; } public final void setCountry(String value) { privateCountry = value; } private double privatePopulation; public final double getPopulation() { return privatePopulation; } public final void setPopulation(double value) { privatePopulation = value; } }public static class Countries { public Countries(String country, double lei, double gdppc, java.awt.Image flag) { this.setCountry(country); this.setLEI(lei); this.setGDPPC(gdppc); this.setFlag(flag); } private String privateCountry; public final String getCountry() { return privateCountry; } public final void setCountry(String value) { privateCountry = value; } private double privateLEI; public final double getLEI() { return privateLEI; } public final void setLEI(double value) { privateLEI = value; } private double privateGDPPC; public final double getGDPPC() { return privateGDPPC; } public final void setGDPPC(double value) { privateGDPPC = value; } private java.awt.Image privateFlag; public final java.awt.Image getFlag() { return privateFlag; } public final void setFlag(java.awt.Image value) { privateFlag = value; } }
chart1.setForeColor(new java.awt.Color(255,0,0,255));
chart1.setPalette("ChartFX6.EarthTones");
PopulateSouthAmericaPopulation(chart1);
chart1.setGallery(Gallery.BAR);
chart1.getLegendBox().setVisible(false);
chart1.getTitles().add(new TitleDockable("South American Countries Population"));
chart1.getAxisY().setScaleUnit(1000000);
chart1.getAxisY().getTitle().setText("(in Millions)");
public static void PopulateSouthAmericaPopulation(Chart chart1) { SouthAmericaPopulation[] data = new SouthAmericaPopulation[]{ new SouthAmericaPopulation("Brazil", 201033000), new SouthAmericaPopulation("Colombia", 47130000), new SouthAmericaPopulation("Argentina", 41350000), new SouthAmericaPopulation("Peru", 30476000), new SouthAmericaPopulation("Venezuela", 29760000), new SouthAmericaPopulation("Chile", 16841000), new SouthAmericaPopulation("Ecuador", 15779000), new SouthAmericaPopulation("Bolivia", 10517000) }; ObjectProvider objProvider = new ObjectProvider(data); chart1.getDataSourceSettings().setDataSource(objProvider); }public static class SouthAmericaPopulation { public SouthAmericaPopulation(String country, double population) { this.setCountry(country); this.setPopulation(population); } private String privateCountry; public final String getCountry() { return privateCountry; } public final void setCountry(String value) { privateCountry = value; } private double privatePopulation; public final double getPopulation() { return privatePopulation; } public final void setPopulation(double value) { privatePopulation = value; } }public static class Countries { public Countries(String country, double lei, double gdppc, java.awt.Image flag) { this.setCountry(country); this.setLEI(lei); this.setGDPPC(gdppc); this.setFlag(flag); } private String privateCountry; public final String getCountry() { return privateCountry; } public final void setCountry(String value) { privateCountry = value; } private double privateLEI; public final double getLEI() { return privateLEI; } public final void setLEI(double value) { privateLEI = value; } private double privateGDPPC; public final double getGDPPC() { return privateGDPPC; } public final void setGDPPC(double value) { privateGDPPC = value; } private java.awt.Image privateFlag; public final java.awt.Image getFlag() { return privateFlag; } public final void setFlag(java.awt.Image value) { privateFlag = value; } }
- See Also:
resetPalette
-
setPalette
public void setPalette(java.lang.String value)
Allows you to set a predefined color palette.
chart1.setPalette("ChartFX6.EarthTones");
PopulateSouthAmericaPopulation(chart1);
chart1.setGallery(Gallery.BAR);
chart1.getLegendBox().setVisible(false);
chart1.getTitles().add(new TitleDockable("South American Countries Population"));
chart1.getAxisY().setScaleUnit(1000000);
chart1.getAxisY().getTitle().setText("(in Millions)");
public static void PopulateSouthAmericaPopulation(Chart chart1) { SouthAmericaPopulation[] data = new SouthAmericaPopulation[]{ new SouthAmericaPopulation("Brazil", 201033000), new SouthAmericaPopulation("Colombia", 47130000), new SouthAmericaPopulation("Argentina", 41350000), new SouthAmericaPopulation("Peru", 30476000), new SouthAmericaPopulation("Venezuela", 29760000), new SouthAmericaPopulation("Chile", 16841000), new SouthAmericaPopulation("Ecuador", 15779000), new SouthAmericaPopulation("Bolivia", 10517000) }; ObjectProvider objProvider = new ObjectProvider(data); chart1.getDataSourceSettings().setDataSource(objProvider); }public static class SouthAmericaPopulation { public SouthAmericaPopulation(String country, double population) { this.setCountry(country); this.setPopulation(population); } private String privateCountry; public final String getCountry() { return privateCountry; } public final void setCountry(String value) { privateCountry = value; } private double privatePopulation; public final double getPopulation() { return privatePopulation; } public final void setPopulation(double value) { privatePopulation = value; } }public static class Countries { public Countries(String country, double lei, double gdppc, java.awt.Image flag) { this.setCountry(country); this.setLEI(lei); this.setGDPPC(gdppc); this.setFlag(flag); } private String privateCountry; public final String getCountry() { return privateCountry; } public final void setCountry(String value) { privateCountry = value; } private double privateLEI; public final double getLEI() { return privateLEI; } public final void setLEI(double value) { privateLEI = value; } private double privateGDPPC; public final double getGDPPC() { return privateGDPPC; } public final void setGDPPC(double value) { privateGDPPC = value; } private java.awt.Image privateFlag; public final java.awt.Image getFlag() { return privateFlag; } public final void setFlag(java.awt.Image value) { privateFlag = value; } }
chart1.setForeColor(new java.awt.Color(255,0,0,255));
chart1.setPalette("ChartFX6.EarthTones");
PopulateSouthAmericaPopulation(chart1);
chart1.setGallery(Gallery.BAR);
chart1.getLegendBox().setVisible(false);
chart1.getTitles().add(new TitleDockable("South American Countries Population"));
chart1.getAxisY().setScaleUnit(1000000);
chart1.getAxisY().getTitle().setText("(in Millions)");
public static void PopulateSouthAmericaPopulation(Chart chart1) { SouthAmericaPopulation[] data = new SouthAmericaPopulation[]{ new SouthAmericaPopulation("Brazil", 201033000), new SouthAmericaPopulation("Colombia", 47130000), new SouthAmericaPopulation("Argentina", 41350000), new SouthAmericaPopulation("Peru", 30476000), new SouthAmericaPopulation("Venezuela", 29760000), new SouthAmericaPopulation("Chile", 16841000), new SouthAmericaPopulation("Ecuador", 15779000), new SouthAmericaPopulation("Bolivia", 10517000) }; ObjectProvider objProvider = new ObjectProvider(data); chart1.getDataSourceSettings().setDataSource(objProvider); }public static class SouthAmericaPopulation { public SouthAmericaPopulation(String country, double population) { this.setCountry(country); this.setPopulation(population); } private String privateCountry; public final String getCountry() { return privateCountry; } public final void setCountry(String value) { privateCountry = value; } private double privatePopulation; public final double getPopulation() { return privatePopulation; } public final void setPopulation(double value) { privatePopulation = value; } }public static class Countries { public Countries(String country, double lei, double gdppc, java.awt.Image flag) { this.setCountry(country); this.setLEI(lei); this.setGDPPC(gdppc); this.setFlag(flag); } private String privateCountry; public final String getCountry() { return privateCountry; } public final void setCountry(String value) { privateCountry = value; } private double privateLEI; public final double getLEI() { return privateLEI; } public final void setLEI(double value) { privateLEI = value; } private double privateGDPPC; public final double getGDPPC() { return privateGDPPC; } public final void setGDPPC(double value) { privateGDPPC = value; } private java.awt.Image privateFlag; public final java.awt.Image getFlag() { return privateFlag; } public final void setFlag(java.awt.Image value) { privateFlag = value; } }
- Parameters:
value-- See Also:
resetPalette
-
getPanes
public java.util.List<Pane> getPanes()
Returns the collection of the defined panes of the chart.
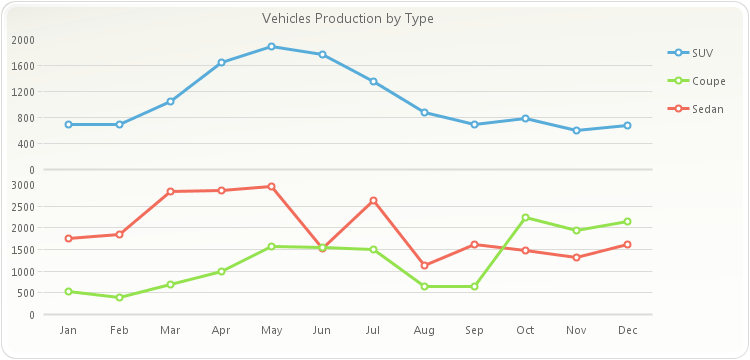
PopulateCarProduction(chart1);
chart1.getData().setSeries(3);
Pane pane;
pane = new Pane();
chart1.getPanes().add(pane);
chart1.getSeries().get(1).setPane(pane);
chart1.getSeries().get(2).setPane(pane);
chart1.getTitles().add(new TitleDockable("Vehicles Production by Type"));
public static void PopulateCarProduction(Chart chart1) { CarProduction[] production = new CarProduction[] { new CarProduction("Jan", 1760, 535, 695 ) , new CarProduction("Feb", 1849, 395, 688 ) , new CarProduction("Mar", 2831, 685, 1047 ) , new CarProduction("Apr", 2851, 984, 1652 ) , new CarProduction("May", 2961, 1579, 1889 ) , new CarProduction("Jun", 1519, 1539, 1766 ) , new CarProduction("Jul", 2633, 1489, 1361 ) , new CarProduction("Aug", 1140, 650, 874 ) , new CarProduction("Sep", 1626, 653, 693 ) , new CarProduction("Oct", 1478, 2236, 786 ) , new CarProduction("Nov", 1306, 1937, 599 ) , new CarProduction("Dec", 1607, 2138, 678 ) }; ObjectProvider objProvider = new ObjectProvider(production); chart1.getDataSourceSettings().setDataSource(objProvider); }public static class CarProduction { private CarProduction(String month, int sedan, int coupe, int SUV) { this.setMonth(month); this.setSedan(sedan); this.setCoupe(coupe); this.setSUV(SUV); } private String privateMonth; public final String getMonth() { return privateMonth; } public final void setMonth(String value) { privateMonth = value; } private int privateSedan; public final int getSedan() { return privateSedan; } public final void setSedan(int value) { privateSedan = value; } private int privateCoupe; public final int getCoupe() { return privateCoupe; } public final void setCoupe(int value) { privateCoupe = value; } private int privateSUV; public final int getSUV() { return privateSUV; } public final void setSUV(int value) { privateSUV = value; } }
chart1.getPanes().get(0).setBackColor(new java.awt.Color(0,0,255,255));
-
getPersonalize
public PersonalizeAttributes getPersonalize()
Allows you to set the preferences for saving and loading personalized charts.chart1.getPersonalize().SetAsDefault();
-
getPlotAreaBackground
public IBackgroundAdornment getPlotAreaBackground()
Allows you to assign a background to the inside area of a chart.
Chart FX supports several types of backgrounds.
setPlotAreaBackgroundsupports an object of one of the following types:SolidBackground,GradientBackgroundorImageBackground.You can use the
setChartBackgroundmethod to assign a background to the whole chart background area.Gradients applied to the PlotAreaBackground of a chart will only be applied to 2D charts. Gradients applied to the PlotAreaBackground of 3D charts will be ignored, however gradients applied to the
setChartBackgroundof both 2D and 3D charts are supported.Below is an example of a two color gradient rendered in the plot area of the chart:
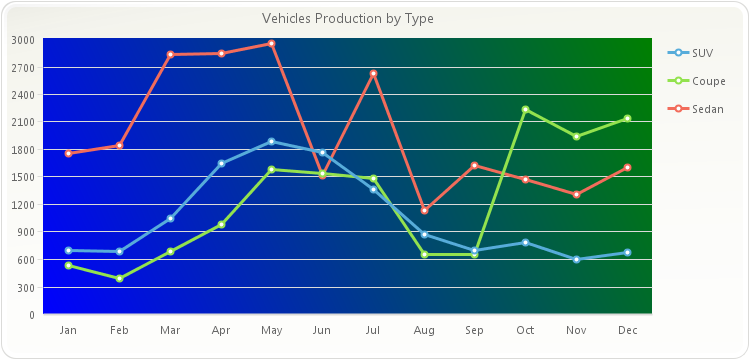
GradientBackground myGradient;
myGradient = new GradientBackground(GradientType.BACKWARD_DIAGONAL);
myGradient.getColors().add(new java.awt.Color(0,128,0,255));
myGradient.getColors().add(new java.awt.Color(0,0,255,255));
myGradient.getPosition().add(0f);
myGradient.getPosition().add(0.5f);
myGradient.getPosition().add(1f);
myGradient.getFactor().add(0f);
myGradient.getFactor().add(0.5f);
myGradient.getFactor().add(1f);
chart1.setPlotAreaBackground(myGradient);
PopulateCarProduction(chart1);
chart1.getTitles().add(new TitleDockable("Vehicles Production by Type"));
public static void PopulateCarProduction(Chart chart1) { CarProduction[] production = new CarProduction[] { new CarProduction("Jan", 1760, 535, 695 ) , new CarProduction("Feb", 1849, 395, 688 ) , new CarProduction("Mar", 2831, 685, 1047 ) , new CarProduction("Apr", 2851, 984, 1652 ) , new CarProduction("May", 2961, 1579, 1889 ) , new CarProduction("Jun", 1519, 1539, 1766 ) , new CarProduction("Jul", 2633, 1489, 1361 ) , new CarProduction("Aug", 1140, 650, 874 ) , new CarProduction("Sep", 1626, 653, 693 ) , new CarProduction("Oct", 1478, 2236, 786 ) , new CarProduction("Nov", 1306, 1937, 599 ) , new CarProduction("Dec", 1607, 2138, 678 ) }; ObjectProvider objProvider = new ObjectProvider(production); chart1.getDataSourceSettings().setDataSource(objProvider); }public static class CarProduction { private CarProduction(String month, int sedan, int coupe, int SUV) { this.setMonth(month); this.setSedan(sedan); this.setCoupe(coupe); this.setSUV(SUV); } private String privateMonth; public final String getMonth() { return privateMonth; } public final void setMonth(String value) { privateMonth = value; } private int privateSedan; public final int getSedan() { return privateSedan; } public final void setSedan(int value) { privateSedan = value; } private int privateCoupe; public final int getCoupe() { return privateCoupe; } public final void setCoupe(int value) { privateCoupe = value; } private int privateSUV; public final int getSUV() { return privateSUV; } public final void setSUV(int value) { privateSUV = value; } }
-
setPlotAreaBackground
public void setPlotAreaBackground(IBackgroundAdornment value)
Allows you to assign a background to the inside area of a chart.
Chart FX supports several types of backgrounds.
setPlotAreaBackgroundsupports an object of one of the following types:SolidBackground,GradientBackgroundorImageBackground.You can use the
setChartBackgroundmethod to assign a background to the whole chart background area.Gradients applied to the PlotAreaBackground of a chart will only be applied to 2D charts. Gradients applied to the PlotAreaBackground of 3D charts will be ignored, however gradients applied to the
setChartBackgroundof both 2D and 3D charts are supported.Below is an example of a two color gradient rendered in the plot area of the chart:
GradientBackground myGradient;
myGradient = new GradientBackground(GradientType.BACKWARD_DIAGONAL);
myGradient.getColors().add(new java.awt.Color(0,128,0,255));
myGradient.getColors().add(new java.awt.Color(0,0,255,255));
myGradient.getPosition().add(0f);
myGradient.getPosition().add(0.5f);
myGradient.getPosition().add(1f);
myGradient.getFactor().add(0f);
myGradient.getFactor().add(0.5f);
myGradient.getFactor().add(1f);
chart1.setPlotAreaBackground(myGradient);
PopulateCarProduction(chart1);
chart1.getTitles().add(new TitleDockable("Vehicles Production by Type"));
public static void PopulateCarProduction(Chart chart1) { CarProduction[] production = new CarProduction[] { new CarProduction("Jan", 1760, 535, 695 ) , new CarProduction("Feb", 1849, 395, 688 ) , new CarProduction("Mar", 2831, 685, 1047 ) , new CarProduction("Apr", 2851, 984, 1652 ) , new CarProduction("May", 2961, 1579, 1889 ) , new CarProduction("Jun", 1519, 1539, 1766 ) , new CarProduction("Jul", 2633, 1489, 1361 ) , new CarProduction("Aug", 1140, 650, 874 ) , new CarProduction("Sep", 1626, 653, 693 ) , new CarProduction("Oct", 1478, 2236, 786 ) , new CarProduction("Nov", 1306, 1937, 599 ) , new CarProduction("Dec", 1607, 2138, 678 ) }; ObjectProvider objProvider = new ObjectProvider(production); chart1.getDataSourceSettings().setDataSource(objProvider); }public static class CarProduction { private CarProduction(String month, int sedan, int coupe, int SUV) { this.setMonth(month); this.setSedan(sedan); this.setCoupe(coupe); this.setSUV(SUV); } private String privateMonth; public final String getMonth() { return privateMonth; } public final void setMonth(String value) { privateMonth = value; } private int privateSedan; public final int getSedan() { return privateSedan; } public final void setSedan(int value) { privateSedan = value; } private int privateCoupe; public final int getCoupe() { return privateCoupe; } public final void setCoupe(int value) { privateCoupe = value; } private int privateSUV; public final int getSUV() { return privateSUV; } public final void setSUV(int value) { privateSUV = value; } }
- Parameters:
value-
-
getPlotAreaColor
public java.awt.Color getPlotAreaColor()
Gets and sets the color of the PlotAreaBackground.
Alternatively, the color can be accessed using the
setColormethod of thesetPlotAreaBackgroundobject.For more information regarding the Color type, please refer to the Java Documentation.
Named color are supported (e.g. Red), to use Hex notation you have to use quotes (e.g. "#FF00FF").
When the chart renders several panes, setting the color of the plot area is equivalent to setting the
setBackColorof the panes individually.Below, the color of the plot area is set to Purple:
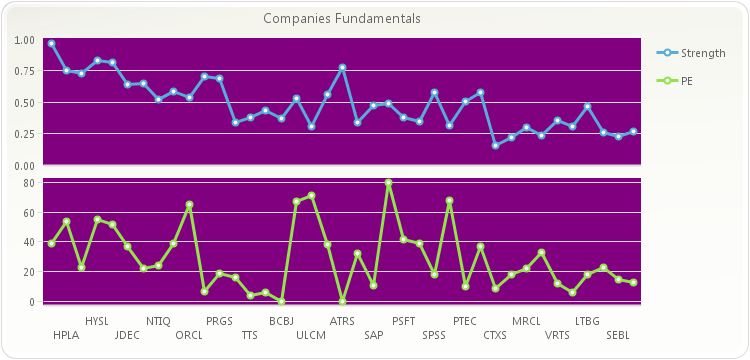
chart1.setPlotAreaColor(new java.awt.Color(128,0,128,255));
PopulateCompanyDataBubble_Strength_PE(chart1);
chart1.getTitles().add(new TitleDockable("Companies Fundamentals"));
chart1.getPanes().add(new Pane());
chart1.getSeries().get(0).setPane(chart1.getPanes().get(0));
chart1.getSeries().get(0).setGallery(Gallery.LINES);
chart1.getSeries().get(1).setPane(chart1.getPanes().get(1));
Pane pane;
pane = chart1.getPanes().get(0);
pane.getAxisY().setStep(0.25);
pane.getAxisY().getLabelsFormat().setDecimals(2);
public static void PopulateCompanyDataBubble_Strength_PE(Chart chart1) { CompanyDataBubble[] companyData = new CompanyDataBubble[]{ new CompanyDataBubble("DODC", 0.97, 85, 39), new CompanyDataBubble("HPLA", 0.75, 74, 54), new CompanyDataBubble("FSTW", 0.73, 74, 23), new CompanyDataBubble("HYSL", 0.83, 72, 55), new CompanyDataBubble("COOG", 0.82, 68, 52), new CompanyDataBubble("JDEC", 0.64, 68, 37), new CompanyDataBubble("OTEX", 0.65, 65, 22), new CompanyDataBubble("NTIQ", 0.52, 60, 24), new CompanyDataBubble("OOGN", 0.59, 58, 39), new CompanyDataBubble("ORCL", 0.54, 58, 65), new CompanyDataBubble("SY", 0.71, 58, 7), new CompanyDataBubble("PRGS", 0.69, 57, 19), new CompanyDataBubble("TALX", 0.34, 54, 16), new CompanyDataBubble("TTS", 0.38, 54, 4), new CompanyDataBubble("PRSE", 0.44, 50, 6), new CompanyDataBubble("BCBJ", 0.37, 48, 0), new CompanyDataBubble("DCTM", 0.53, 46, 67), new CompanyDataBubble("ULCM", 0.31, 44, 71), new CompanyDataBubble("MERQ", 0.56, 43, 38), new CompanyDataBubble("ATRS", 0.78, 42, 0), new CompanyDataBubble("JDAS", 0.34, 41, 32), new CompanyDataBubble("SAP", 0.48, 40, 11), new CompanyDataBubble("VRTY", 0.49, 39, 80), new CompanyDataBubble("PSFT", 0.38, 38, 42), new CompanyDataBubble("SRNA", 0.35, 36, 39), new CompanyDataBubble("SPSS", 0.58, 36, 18), new CompanyDataBubble("QSFT", 0.32, 35, 68), new CompanyDataBubble("PTEC", 0.51, 34, 10), new CompanyDataBubble("BMC", 0.58, 32, 37), new CompanyDataBubble("CTXS", 0.16, 32, 9), new CompanyDataBubble("PDFS", 0.22, 31, 18), new CompanyDataBubble("MRCL", 0.3, 30, 22), new CompanyDataBubble("CA", 0.24, 30, 33), new CompanyDataBubble("VRTS", 0.36, 29, 12), new CompanyDataBubble("TIBX", 0.31, 28, 6), new CompanyDataBubble("LTBG", 0.47, 23, 18), new CompanyDataBubble("RATL", 0.26, 23, 23), new CompanyDataBubble("SEBL", 0.23, 19, 15), new CompanyDataBubble("LWSN", 0.27, 16, 13) }; ObjectProvider objProvider = new ObjectProvider(companyData); chart1.getDataSourceSettings().setDataSource(objProvider); // Since not all the fields in the DataSource are required, we must specify the number // of series that will be contained in the chart and perform the corresponding bindings chart1.getData().setSeries(2); NumericDataField numericFieldStrength = new NumericDataField(); numericFieldStrength.setDataPath("Strength"); chart1.getDataSourceSettings().getDataFields().add(numericFieldStrength); chart1.getSeries().get(0).getBindings().setY(numericFieldStrength); NumericDataField numericFieldPE = new NumericDataField(); numericFieldPE.setDataPath("PE"); chart1.getDataSourceSettings().getDataFields().add(numericFieldPE); chart1.getSeries().get(1).getBindings().setY(numericFieldPE); StringDataField stringFieldMonth = new StringDataField(); stringFieldMonth.setDataPath("Symbol"); chart1.getDataSourceSettings().getDataFields().add(stringFieldMonth); chart1.getAxisX().getBindings().setLabel(stringFieldMonth); }public static void PopulateCompanyDataBubble(Chart chart1) { CompanyDataBubble[] companyData = new CompanyDataBubble[]{ new CompanyDataBubble("DODC", 0.97, 85, 39), new CompanyDataBubble("HPLA", 0.75, 74, 54), new CompanyDataBubble("FSTW", 0.73, 74, 23), new CompanyDataBubble("HYSL", 0.83, 72, 55), new CompanyDataBubble("COOG", 0.82, 68, 52), new CompanyDataBubble("JDEC", 0.64, 68, 37), new CompanyDataBubble("OTEX", 0.65, 65, 22), new CompanyDataBubble("NTIQ", 0.52, 60, 24), new CompanyDataBubble("OOGN", 0.59, 58, 39), new CompanyDataBubble("ORCL", 0.54, 58, 65), new CompanyDataBubble("SY", 0.71, 58, 7), new CompanyDataBubble("PRGS", 0.69, 57, 19), new CompanyDataBubble("TALX", 0.34, 54, 16), new CompanyDataBubble("TTS", 0.38, 54, 4), new CompanyDataBubble("PRSE", 0.44, 50, 6), new CompanyDataBubble("BCBJ", 0.37, 48, 0), new CompanyDataBubble("DCTM", 0.53, 46, 67), new CompanyDataBubble("ULCM", 0.31, 44, 71), new CompanyDataBubble("MERQ", 0.56, 43, 38), new CompanyDataBubble("ATRS", 0.78, 42, 0), new CompanyDataBubble("JDAS", 0.34, 41, 32), new CompanyDataBubble("SAP", 0.48, 40, 11), new CompanyDataBubble("VRTY", 0.49, 39, 80), new CompanyDataBubble("PSFT", 0.38, 38, 42), new CompanyDataBubble("SRNA", 0.35, 36, 39), new CompanyDataBubble("SPSS", 0.58, 36, 18), new CompanyDataBubble("QSFT", 0.32, 35, 68), new CompanyDataBubble("PTEC", 0.51, 34, 10), new CompanyDataBubble("BMC", 0.58, 32, 37), new CompanyDataBubble("CTXS", 0.16, 32, 9), new CompanyDataBubble("PDFS", 0.22, 31, 18), new CompanyDataBubble("MRCL", 0.3, 30, 22), new CompanyDataBubble("CA", 0.24, 30, 33), new CompanyDataBubble("VRTS", 0.36, 29, 12), new CompanyDataBubble("TIBX", 0.31, 28, 6), new CompanyDataBubble("LTBG", 0.47, 23, 18), new CompanyDataBubble("RATL", 0.26, 23, 23), new CompanyDataBubble("SEBL", 0.23, 19, 15), new CompanyDataBubble("LWSN", 0.27, 16, 13) }; ObjectProvider objProvider = new ObjectProvider(companyData); chart1.getDataSourceSettings().setDataSource(objProvider); DataFieldCollection dataFieldCollection = chart1.getDataSourceSettings().getDataFields(); StringDataField dfSymbol = new StringDataField(); dfSymbol.setDataPath("Symbol"); NumericDataField dfStrength = new NumericDataField(); dfStrength.setDataPath("Strength"); NumericDataField dfRank = new NumericDataField(); dfRank.setDataPath("Rank"); NumericDataField dfPE = new NumericDataField(); dfPE.setDataPath("PE"); dataFieldCollection.add(dfSymbol); dataFieldCollection.add(dfStrength); dataFieldCollection.add(dfRank); dataFieldCollection.add(dfPE); chart1.getData().setSeries(2); SeriesBindings series0Bindings = chart1.getSeries().get(0).getBindings(); SeriesBindings series1Bindings = chart1.getSeries().get(1).getBindings(); series0Bindings.setX(dfStrength); series1Bindings.setX(dfStrength); series0Bindings.setY(dfRank); series1Bindings.setY(dfPE); chart1.getDataSourceSettings().readData(); }public static class CompanyDataBubble { public CompanyDataBubble(String symbol, double strengh, double rank, double pe) { this.setSymbol(symbol); this.setStrength(strengh); this.setRank(rank); this.setPE(pe); } private String privateSymbol; public final String getSymbol() { return privateSymbol; } public final void setSymbol(String value) { privateSymbol = value; } private double privateStrength; public final double getStrength() { return privateStrength; } public final void setStrength(double value) { privateStrength = value; } private double privateRank; public final double getRank() { return privateRank; } public final void setRank(double value) { privateRank = value; } private double privatePE; public final double getPE() { return privatePE; } public final void setPE(double value) { privatePE = value; } }
PlotAreaColor supports transparency. When the PlotArea is transparent, the background of the PlotArea is rendered by the
setChartBackgroundandsetBackColormethods.- See Also:
resetPlotAreaColor
-
setPlotAreaColor
public void setPlotAreaColor(java.awt.Color value)
Gets and Sets the color of the PlotAreaBackground.
Alternatively, the color can be accessed using the
setColormethod of thesetPlotAreaBackgroundobject.For more information regarding the Color type, please refer to the Java Documentation.
Named color are supported (e.g. Red), to use Hex notation you have to use quotes (e.g. "#FF00FF").
When the chart renders several panes, setting the color of the plot area is equivalent to setting the
setBackColorof the panes individually.Below, the color of the plot area is set to Purple:
chart1.setPlotAreaColor(new java.awt.Color(128,0,128,255));
PopulateCompanyDataBubble_Strength_PE(chart1);
chart1.getTitles().add(new TitleDockable("Companies Fundamentals"));
chart1.getPanes().add(new Pane());
chart1.getSeries().get(0).setPane(chart1.getPanes().get(0));
chart1.getSeries().get(0).setGallery(Gallery.LINES);
chart1.getSeries().get(1).setPane(chart1.getPanes().get(1));
Pane pane;
pane = chart1.getPanes().get(0);
pane.getAxisY().setStep(0.25);
pane.getAxisY().getLabelsFormat().setDecimals(2);
public static void PopulateCompanyDataBubble_Strength_PE(Chart chart1) { CompanyDataBubble[] companyData = new CompanyDataBubble[]{ new CompanyDataBubble("DODC", 0.97, 85, 39), new CompanyDataBubble("HPLA", 0.75, 74, 54), new CompanyDataBubble("FSTW", 0.73, 74, 23), new CompanyDataBubble("HYSL", 0.83, 72, 55), new CompanyDataBubble("COOG", 0.82, 68, 52), new CompanyDataBubble("JDEC", 0.64, 68, 37), new CompanyDataBubble("OTEX", 0.65, 65, 22), new CompanyDataBubble("NTIQ", 0.52, 60, 24), new CompanyDataBubble("OOGN", 0.59, 58, 39), new CompanyDataBubble("ORCL", 0.54, 58, 65), new CompanyDataBubble("SY", 0.71, 58, 7), new CompanyDataBubble("PRGS", 0.69, 57, 19), new CompanyDataBubble("TALX", 0.34, 54, 16), new CompanyDataBubble("TTS", 0.38, 54, 4), new CompanyDataBubble("PRSE", 0.44, 50, 6), new CompanyDataBubble("BCBJ", 0.37, 48, 0), new CompanyDataBubble("DCTM", 0.53, 46, 67), new CompanyDataBubble("ULCM", 0.31, 44, 71), new CompanyDataBubble("MERQ", 0.56, 43, 38), new CompanyDataBubble("ATRS", 0.78, 42, 0), new CompanyDataBubble("JDAS", 0.34, 41, 32), new CompanyDataBubble("SAP", 0.48, 40, 11), new CompanyDataBubble("VRTY", 0.49, 39, 80), new CompanyDataBubble("PSFT", 0.38, 38, 42), new CompanyDataBubble("SRNA", 0.35, 36, 39), new CompanyDataBubble("SPSS", 0.58, 36, 18), new CompanyDataBubble("QSFT", 0.32, 35, 68), new CompanyDataBubble("PTEC", 0.51, 34, 10), new CompanyDataBubble("BMC", 0.58, 32, 37), new CompanyDataBubble("CTXS", 0.16, 32, 9), new CompanyDataBubble("PDFS", 0.22, 31, 18), new CompanyDataBubble("MRCL", 0.3, 30, 22), new CompanyDataBubble("CA", 0.24, 30, 33), new CompanyDataBubble("VRTS", 0.36, 29, 12), new CompanyDataBubble("TIBX", 0.31, 28, 6), new CompanyDataBubble("LTBG", 0.47, 23, 18), new CompanyDataBubble("RATL", 0.26, 23, 23), new CompanyDataBubble("SEBL", 0.23, 19, 15), new CompanyDataBubble("LWSN", 0.27, 16, 13) }; ObjectProvider objProvider = new ObjectProvider(companyData); chart1.getDataSourceSettings().setDataSource(objProvider); // Since not all the fields in the DataSource are required, we must specify the number // of series that will be contained in the chart and perform the corresponding bindings chart1.getData().setSeries(2); NumericDataField numericFieldStrength = new NumericDataField(); numericFieldStrength.setDataPath("Strength"); chart1.getDataSourceSettings().getDataFields().add(numericFieldStrength); chart1.getSeries().get(0).getBindings().setY(numericFieldStrength); NumericDataField numericFieldPE = new NumericDataField(); numericFieldPE.setDataPath("PE"); chart1.getDataSourceSettings().getDataFields().add(numericFieldPE); chart1.getSeries().get(1).getBindings().setY(numericFieldPE); StringDataField stringFieldMonth = new StringDataField(); stringFieldMonth.setDataPath("Symbol"); chart1.getDataSourceSettings().getDataFields().add(stringFieldMonth); chart1.getAxisX().getBindings().setLabel(stringFieldMonth); }public static void PopulateCompanyDataBubble(Chart chart1) { CompanyDataBubble[] companyData = new CompanyDataBubble[]{ new CompanyDataBubble("DODC", 0.97, 85, 39), new CompanyDataBubble("HPLA", 0.75, 74, 54), new CompanyDataBubble("FSTW", 0.73, 74, 23), new CompanyDataBubble("HYSL", 0.83, 72, 55), new CompanyDataBubble("COOG", 0.82, 68, 52), new CompanyDataBubble("JDEC", 0.64, 68, 37), new CompanyDataBubble("OTEX", 0.65, 65, 22), new CompanyDataBubble("NTIQ", 0.52, 60, 24), new CompanyDataBubble("OOGN", 0.59, 58, 39), new CompanyDataBubble("ORCL", 0.54, 58, 65), new CompanyDataBubble("SY", 0.71, 58, 7), new CompanyDataBubble("PRGS", 0.69, 57, 19), new CompanyDataBubble("TALX", 0.34, 54, 16), new CompanyDataBubble("TTS", 0.38, 54, 4), new CompanyDataBubble("PRSE", 0.44, 50, 6), new CompanyDataBubble("BCBJ", 0.37, 48, 0), new CompanyDataBubble("DCTM", 0.53, 46, 67), new CompanyDataBubble("ULCM", 0.31, 44, 71), new CompanyDataBubble("MERQ", 0.56, 43, 38), new CompanyDataBubble("ATRS", 0.78, 42, 0), new CompanyDataBubble("JDAS", 0.34, 41, 32), new CompanyDataBubble("SAP", 0.48, 40, 11), new CompanyDataBubble("VRTY", 0.49, 39, 80), new CompanyDataBubble("PSFT", 0.38, 38, 42), new CompanyDataBubble("SRNA", 0.35, 36, 39), new CompanyDataBubble("SPSS", 0.58, 36, 18), new CompanyDataBubble("QSFT", 0.32, 35, 68), new CompanyDataBubble("PTEC", 0.51, 34, 10), new CompanyDataBubble("BMC", 0.58, 32, 37), new CompanyDataBubble("CTXS", 0.16, 32, 9), new CompanyDataBubble("PDFS", 0.22, 31, 18), new CompanyDataBubble("MRCL", 0.3, 30, 22), new CompanyDataBubble("CA", 0.24, 30, 33), new CompanyDataBubble("VRTS", 0.36, 29, 12), new CompanyDataBubble("TIBX", 0.31, 28, 6), new CompanyDataBubble("LTBG", 0.47, 23, 18), new CompanyDataBubble("RATL", 0.26, 23, 23), new CompanyDataBubble("SEBL", 0.23, 19, 15), new CompanyDataBubble("LWSN", 0.27, 16, 13) }; ObjectProvider objProvider = new ObjectProvider(companyData); chart1.getDataSourceSettings().setDataSource(objProvider); DataFieldCollection dataFieldCollection = chart1.getDataSourceSettings().getDataFields(); StringDataField dfSymbol = new StringDataField(); dfSymbol.setDataPath("Symbol"); NumericDataField dfStrength = new NumericDataField(); dfStrength.setDataPath("Strength"); NumericDataField dfRank = new NumericDataField(); dfRank.setDataPath("Rank"); NumericDataField dfPE = new NumericDataField(); dfPE.setDataPath("PE"); dataFieldCollection.add(dfSymbol); dataFieldCollection.add(dfStrength); dataFieldCollection.add(dfRank); dataFieldCollection.add(dfPE); chart1.getData().setSeries(2); SeriesBindings series0Bindings = chart1.getSeries().get(0).getBindings(); SeriesBindings series1Bindings = chart1.getSeries().get(1).getBindings(); series0Bindings.setX(dfStrength); series1Bindings.setX(dfStrength); series0Bindings.setY(dfRank); series1Bindings.setY(dfPE); chart1.getDataSourceSettings().readData(); }public static class CompanyDataBubble { public CompanyDataBubble(String symbol, double strengh, double rank, double pe) { this.setSymbol(symbol); this.setStrength(strengh); this.setRank(rank); this.setPE(pe); } private String privateSymbol; public final String getSymbol() { return privateSymbol; } public final void setSymbol(String value) { privateSymbol = value; } private double privateStrength; public final double getStrength() { return privateStrength; } public final void setStrength(double value) { privateStrength = value; } private double privateRank; public final double getRank() { return privateRank; } public final void setRank(double value) { privateRank = value; } private double privatePE; public final double getPE() { return privatePE; } public final void setPE(double value) { privatePE = value; } }
PlotAreaColor supports transparency. When the PlotArea is transparent, the background of the PlotArea is rendered by the
setChartBackgroundandsetBackColormethods.- Parameters:
value-- See Also:
resetPlotAreaColor
-
getPlotAreaMargin
public Margins getPlotAreaMargin()
Gets and sets the top, bottom, left and right gaps of the chart.
chart1.getPlotAreaMargin().setTop(1);
chart1.getPlotAreaMargin().setBottom(100);
chart1.getPlotAreaMargin().setRight(1);
chart1.getPlotAreaMargin().setLeft(1);
PopulateCompanyDataBubble_PE(chart1);
chart1.setGallery(Gallery.BAR);
chart1.getAllSeries().setMultipleColors(true);
chart1.getLegendBox().setVisible(false);
chart1.getTitles().add(new TitleDockable("PE Ratio by Company"));
chart1.getAxisX().setLabelAngle((short)90);
chart1.getAxisX().setLineSpacing(1);
public static void PopulateCompanyDataBubble_PE(Chart chart1) { CompanyDataBubble[] companyData = new CompanyDataBubble[]{ new CompanyDataBubble("DODC", 0.97, 85, 39), new CompanyDataBubble("HPLA", 0.75, 74, 54), new CompanyDataBubble("FSTW", 0.73, 74, 23), new CompanyDataBubble("HYSL", 0.83, 72, 55), new CompanyDataBubble("COOG", 0.82, 68, 52), new CompanyDataBubble("JDEC", 0.64, 68, 37), new CompanyDataBubble("OTEX", 0.65, 65, 22), new CompanyDataBubble("NTIQ", 0.52, 60, 24), new CompanyDataBubble("OOGN", 0.59, 58, 39), new CompanyDataBubble("ORCL", 0.54, 58, 65), new CompanyDataBubble("SY", 0.71, 58, 7), new CompanyDataBubble("PRGS", 0.69, 57, 19), new CompanyDataBubble("TALX", 0.34, 54, 16), new CompanyDataBubble("TTS", 0.38, 54, 4), new CompanyDataBubble("PRSE", 0.44, 50, 6), new CompanyDataBubble("BCBJ", 0.37, 48, 0), new CompanyDataBubble("DCTM", 0.53, 46, 67), new CompanyDataBubble("ULCM", 0.31, 44, 71), new CompanyDataBubble("MERQ", 0.56, 43, 38), new CompanyDataBubble("ATRS", 0.78, 42, 0), new CompanyDataBubble("JDAS", 0.34, 41, 32), new CompanyDataBubble("SAP", 0.48, 40, 11), new CompanyDataBubble("VRTY", 0.49, 39, 80), new CompanyDataBubble("PSFT", 0.38, 38, 42), new CompanyDataBubble("SRNA", 0.35, 36, 39), new CompanyDataBubble("SPSS", 0.58, 36, 18), new CompanyDataBubble("QSFT", 0.32, 35, 68), new CompanyDataBubble("PTEC", 0.51, 34, 10), new CompanyDataBubble("BMC", 0.58, 32, 37), new CompanyDataBubble("CTXS", 0.16, 32, 9), new CompanyDataBubble("PDFS", 0.22, 31, 18), new CompanyDataBubble("MRCL", 0.3, 30, 22), new CompanyDataBubble("CA", 0.24, 30, 33), new CompanyDataBubble("VRTS", 0.36, 29, 12), new CompanyDataBubble("TIBX", 0.31, 28, 6), new CompanyDataBubble("LTBG", 0.47, 23, 18), new CompanyDataBubble("RATL", 0.26, 23, 23), new CompanyDataBubble("SEBL", 0.23, 19, 15), new CompanyDataBubble("LWSN", 0.27, 16, 13) }; ObjectProvider objProvider = new ObjectProvider(companyData); chart1.getDataSourceSettings().setDataSource(objProvider); // Since not all the fields in the DataSource are required, we must specify the number // of series that will be contained in the chart and perform the corresponding bindings chart1.getData().setSeries(1); NumericDataField numericFieldPE = new NumericDataField(); numericFieldPE.setDataPath("PE"); chart1.getDataSourceSettings().getDataFields().add(numericFieldPE); chart1.getSeries().get(0).getBindings().setY(numericFieldPE); StringDataField stringFieldMonth = new StringDataField(); stringFieldMonth.setDataPath("Symbol"); chart1.getDataSourceSettings().getDataFields().add(stringFieldMonth); chart1.getAxisX().getBindings().setLabel(stringFieldMonth); }public static void PopulateCompanyDataBubble(Chart chart1) { CompanyDataBubble[] companyData = new CompanyDataBubble[]{ new CompanyDataBubble("DODC", 0.97, 85, 39), new CompanyDataBubble("HPLA", 0.75, 74, 54), new CompanyDataBubble("FSTW", 0.73, 74, 23), new CompanyDataBubble("HYSL", 0.83, 72, 55), new CompanyDataBubble("COOG", 0.82, 68, 52), new CompanyDataBubble("JDEC", 0.64, 68, 37), new CompanyDataBubble("OTEX", 0.65, 65, 22), new CompanyDataBubble("NTIQ", 0.52, 60, 24), new CompanyDataBubble("OOGN", 0.59, 58, 39), new CompanyDataBubble("ORCL", 0.54, 58, 65), new CompanyDataBubble("SY", 0.71, 58, 7), new CompanyDataBubble("PRGS", 0.69, 57, 19), new CompanyDataBubble("TALX", 0.34, 54, 16), new CompanyDataBubble("TTS", 0.38, 54, 4), new CompanyDataBubble("PRSE", 0.44, 50, 6), new CompanyDataBubble("BCBJ", 0.37, 48, 0), new CompanyDataBubble("DCTM", 0.53, 46, 67), new CompanyDataBubble("ULCM", 0.31, 44, 71), new CompanyDataBubble("MERQ", 0.56, 43, 38), new CompanyDataBubble("ATRS", 0.78, 42, 0), new CompanyDataBubble("JDAS", 0.34, 41, 32), new CompanyDataBubble("SAP", 0.48, 40, 11), new CompanyDataBubble("VRTY", 0.49, 39, 80), new CompanyDataBubble("PSFT", 0.38, 38, 42), new CompanyDataBubble("SRNA", 0.35, 36, 39), new CompanyDataBubble("SPSS", 0.58, 36, 18), new CompanyDataBubble("QSFT", 0.32, 35, 68), new CompanyDataBubble("PTEC", 0.51, 34, 10), new CompanyDataBubble("BMC", 0.58, 32, 37), new CompanyDataBubble("CTXS", 0.16, 32, 9), new CompanyDataBubble("PDFS", 0.22, 31, 18), new CompanyDataBubble("MRCL", 0.3, 30, 22), new CompanyDataBubble("CA", 0.24, 30, 33), new CompanyDataBubble("VRTS", 0.36, 29, 12), new CompanyDataBubble("TIBX", 0.31, 28, 6), new CompanyDataBubble("LTBG", 0.47, 23, 18), new CompanyDataBubble("RATL", 0.26, 23, 23), new CompanyDataBubble("SEBL", 0.23, 19, 15), new CompanyDataBubble("LWSN", 0.27, 16, 13) }; ObjectProvider objProvider = new ObjectProvider(companyData); chart1.getDataSourceSettings().setDataSource(objProvider); DataFieldCollection dataFieldCollection = chart1.getDataSourceSettings().getDataFields(); StringDataField dfSymbol = new StringDataField(); dfSymbol.setDataPath("Symbol"); NumericDataField dfStrength = new NumericDataField(); dfStrength.setDataPath("Strength"); NumericDataField dfRank = new NumericDataField(); dfRank.setDataPath("Rank"); NumericDataField dfPE = new NumericDataField(); dfPE.setDataPath("PE"); dataFieldCollection.add(dfSymbol); dataFieldCollection.add(dfStrength); dataFieldCollection.add(dfRank); dataFieldCollection.add(dfPE); chart1.getData().setSeries(2); SeriesBindings series0Bindings = chart1.getSeries().get(0).getBindings(); SeriesBindings series1Bindings = chart1.getSeries().get(1).getBindings(); series0Bindings.setX(dfStrength); series1Bindings.setX(dfStrength); series0Bindings.setY(dfRank); series1Bindings.setY(dfPE); chart1.getDataSourceSettings().readData(); }public static class CompanyDataBubble { public CompanyDataBubble(String symbol, double strengh, double rank, double pe) { this.setSymbol(symbol); this.setStrength(strengh); this.setRank(rank); this.setPE(pe); } private String privateSymbol; public final String getSymbol() { return privateSymbol; } public final void setSymbol(String value) { privateSymbol = value; } private double privateStrength; public final double getStrength() { return privateStrength; } public final void setStrength(double value) { privateStrength = value; } private double privateRank; public final double getRank() { return privateRank; } public final void setRank(double value) { privateRank = value; } private double privatePE; public final double getPE() { return privatePE; } public final void setPE(double value) { privatePE = value; } }
-
getPoints
public PointAttributesCollection getPoints()
Assigns properties directly to a specific point in the chart.

chart1.setGallery(Gallery.BAR);
chart1.getPoints().get(1, 2).setColor(new java.awt.Color(0,0,0,255));
chart1.getPoints().get(2).getPointLabels().setVisible(true);
-
getPrinter
public Printer getPrinter()
Allows you to set properties of the printer object.
chart1.getPrinter().setOrientation(PageOrientation.LANDSCAPE);
-
getProxyUri
public java.lang.String getProxyUri()
Used to add the Proxy URI of a proxy server.chart1.setProxyUri(" ");
- See Also:
resetProxyUri
-
setProxyUri
public void setProxyUri(java.lang.String value)
Used to add the Proxy URI of a proxy server.chart1.setProxyUri(" ");
- Parameters:
value-- See Also:
resetProxyUri
-
getRandomData
public RandomData getRandomData()
Description goes here
-
getRealTime
public RealTimeSettings getRealTime()
Allows access to the RealTimeSettings class supported members used to create real-time charts.chart1.getRealTime().setBufferSize(20);
-
getRenderFormat
public java.lang.String getRenderFormat()
Gets or sets the chart format to generate.
The possible options are: "Image", "Jpeg", "Png" or "SVG". If no value is specified, the default setting is Image. We recommend using "SVG" for browsers that support HTML5.
To force Chart FX to generate an SVG in line chart:
chart1.setRenderFormat("SVG");
- See Also:
resetRenderFormat
-
setRenderFormat
public void setRenderFormat(java.lang.String value)
Gets or sets the chart format to generate.
The possible options are: "Image", "Jpeg", "Png" or "SVG". If no value is specified, the default setting is Image. We recommend using "SVG" for browsers that support HTML5.
To force Chart FX to generate an SVG in line chart:
chart1.setRenderFormat("SVG");
- Parameters:
value-- See Also:
resetRenderFormat
-
getSelectedValue
public java.lang.Object getSelectedValue()
Gets the DataField value of the selected point.
StringDataField dfName;
dfName = new StringDataField();
dfName.setDataPath("Name");
NumericDataField dfAge;
dfAge = new NumericDataField();
dfAge.setDataPath("Age");
chart1.getDataSourceSettings().getDataFields().add(((DataField)dfName));
chart1.getDataSourceSettings().getDataFields().add(((DataField)dfAge));
chart1.getDataSourceSettings().ReadData();
chart1.getSelection().setEnabled(true);
chart1.getSelection().select(0, 1);
chart1.setSelectedValueField(dfName);
-
getSelectedValueField
public com.softwarefx.server.data.DataField getSelectedValueField()
Gets or sets the selected DataField.
-
setSelectedValueField
public void setSelectedValueField(com.softwarefx.server.data.DataField value)
Gets or sets the selected DataField.
- Parameters:
value-
-
getSelection
public SelectionAttributes getSelection()
Allows the selection of one or several data in the chart.
chart1.getSelection().setEnabled(true);
chart1.getSelection().setAllowMultiple(true);
chart1.getSelection().select(0, 0);
-
getSeries
public java.util.List<SeriesAttributes> getSeries()
Assigns properties directly to the selected series in the chart.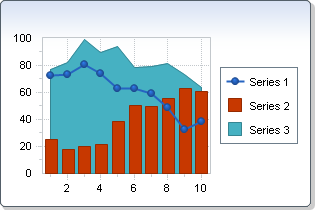
chart1.getSeries().get(0).setGallery(Gallery.LINES);
chart1.getSeries().get(1).setGallery(Gallery.BAR);
chart1.getSeries().get(2).setGallery(Gallery.AREA);
-
getStylePrefix
public java.lang.String getStylePrefix()
Description goes here
-
setStylePrefix
public void setStylePrefix(java.lang.String value)
Description goes here- Parameters:
value-
-
getTemplateContents
public java.util.EnumSet<FileContents> getTemplateContents()
Gets or sets the attributes to save in personalization features and template files (Export method).java.util.EnumSet<FileContents> style = chart1.getTemplateContents(); style.add(FileContents.FONTS); chart1.setTemplateContents(style);
- See Also:
resetTemplateContents
-
setTemplateContents
public void setTemplateContents(java.util.EnumSet<FileContents> value)
Gets or sets the attributes to save in personalization features and template files (Export method).java.util.EnumSet<FileContents> style = chart1.getTemplateContents(); style.add(FileContents.FONTS); chart1.setTemplateContents(style);
- Parameters:
value-- See Also:
resetTemplateContents
-
getTitles
public java.util.List<TitleDockable> getTitles()
Returns the collection of titles defined in the chart.
-
getToolBar
public DockableToolBar getToolBar()
Allows access to the chart's toolbar.
chart1.getToolBar().setVisible(true);
-
getToolTip
public java.lang.String getToolTip()
Description goes here
-
setToolTip
public void setToolTip(java.lang.String value)
Description goes here- Parameters:
value-
-
getToolTipFormat
public java.lang.String getToolTipFormat()
Allows you to control the information to be displayed in the tooltip when the user positions the mouse over a particular data point in the chart.
isToolTipstoggle on/off the tooltip in the chart.The syntax for this method is the same as the one used in the
setFormatmethod. Variables can be accessed using the % following the variable you want to include:l Shows X-Axis Legend. k Shows X-Axis Key Legend. s Shows Series Legend.S Shows the Series Index.x Shows XValue (XY charts, when they were set with X values). i Shows IniValues (Gantt). v Shows Data Value.v For types that require more than one series, these are replaced by the value of each one. (n represents an index).t Series Total (Sum of all points in this series).p Percentage of total this point represents (Pie).T Point Total (Sum of all series for this point). P Percentage of total this series represents (Used in stacked charts). X displays the marker X value for any chart type including those that do not support X values such as bar.N Shows the index for the point.L Shows the
setTextmethod of thePointAttributesobject.Shows a custom text, the series legend and the data value though the tooltip:
java.lang.String maskString; maskString = "I\'m series: " + "%S " + " my value is: " + "%v"; chart1.setToolTipFormat(maskString);
- See Also:
resetToolTipFormat
-
setToolTipFormat
public void setToolTipFormat(java.lang.String value)
Allows you to control the information to be displayed in the tooltip when the user positions the mouse over a particular data point in the chart.
isToolTipstoggle on/off the tooltip in the chart.The syntax for this method is the same as the one used in the
setFormatmethod. Variables can be accessed using the % following the variable you want to include:l Shows X-Axis Legend. k Shows X-Axis Key Legend. s Shows Series Legend.S Shows the Series Index.x Shows XValue (XY charts, when they were set with X values). i Shows IniValues (Gantt). v Shows Data Value.v For types that require more than one series, these are replaced by the value of each one. (n represents an index).t Series Total (Sum of all points in this series).p Percentage of total this point represents (Pie).T Point Total (Sum of all series for this point). P Percentage of total this series represents (Used in stacked charts). X displays the marker X value for any chart type including those that do not support X values such as bar.N Shows the index for the point.L Shows the
setTextmethod of thePointAttributesobject.Shows a custom text, the series legend and the data value though the tooltip:
java.lang.String maskString; maskString = "I\'m series: " + "%S " + " my value is: " + "%v"; chart1.setToolTipFormat(maskString);
- Parameters:
value-- See Also:
resetToolTipFormat
-
isToolTips
public boolean isToolTips()
Allows you to enable or disable tooltips when the user positions the mouse over a particular element in the chart area only.chart1.setToolTips(false);
- See Also:
resetToolTips
-
setToolTips
public void setToolTips(boolean value)
Allows you to enable or disable tooltips when the user positions the mouse over a particular element in the chart area only.chart1.setToolTips(false);
- Parameters:
value-- See Also:
resetToolTips
-
getUndoRedo
public UndoRedo getUndoRedo()
Provides the undo and redo capability for the chart.
chart1.getUndoRedo().setEnabled(false);
-
isUseCallbacksForEvents
public boolean isUseCallbacksForEvents()
Allows you to use CallBacks scripts when events are fired.- See Also:
resetUseCallbacksForEvents
-
setUseCallbacksForEvents
public void setUseCallbacksForEvents(boolean value)
Allows you to use CallBacks scripts when events are fired.- Parameters:
value-- See Also:
resetUseCallbacksForEvents
-
isUseStyles
public boolean isUseStyles()
Description goes here
-
setUseStyles
public void setUseStyles(boolean value)
Description goes here- Parameters:
value-
-
getView3D
public Attributes3D getView3D()
Provides access to the chart's Attributes3D object to enable or disable 3D view of the chart as well as customize the 3D view.
chart1.getView3D().setEnabled(true); PopulateProductSales(chart1); chart1.getTitles().add(new TitleDockable("Wine Sales by Type")); chart1.getAxisY().getLabelsFormat().setFormat(AxisFormat.CURRENCY); chart1.setGallery(Gallery.BAR);public static void PopulateProductSales(Chart chart1) { ProductSales[] data = new ProductSales[]{ new ProductSales("Jan", 12560, 23400, 34500), new ProductSales("Feb", 13400, 21000, 38900), new ProductSales("Mar", 16700, 17000, 42100), new ProductSales("Apr", 12000, 19020, 43800), new ProductSales("May", 15800, 26500, 37540), new ProductSales("Jun", 9800, 27800, 32580), new ProductSales("Jul", 17800, 29820, 34000), new ProductSales("Aug", 19800, 17800, 38000), new ProductSales("Sep", 23200, 32000, 41300), new ProductSales("Oct", 16700, 26500, 46590), new ProductSales("Nov", 11800, 23000, 48700), new ProductSales("Dec", 13400, 15400, 49100) }; ObjectProvider objProvider = new ObjectProvider(data); chart1.getDataSourceSettings().setDataSource(objProvider); }public static class ProductSales { public ProductSales(String month, double white, double red, double sparkling) { this.setMonth(month); this.setWhite(white); this.setRed(red); this.setSparkling(sparkling); } private String privateMonth; public final String getMonth() { return privateMonth; } public final void setMonth(String value) { privateMonth = value; } private double privateWhite; public final double getWhite() { return privateWhite; } public final void setWhite(double value) { privateWhite = value; } private double privateRed; public final double getRed() { return privateRed; } public final void setRed(double value) { privateRed = value; } private double privateSparkling; public final double getSparkling() { return privateSparkling; } public final void setSparkling(double value) { privateSparkling = value; } }
-
isVisible
public boolean isVisible()
Gets or sets a value specifying to show or hide the chart.chart1.setVisible(false);
- See Also:
resetVisible
-
setVisible
public void setVisible(boolean value)
Gets or sets a value specifying to show or hide the chart.chart1.setVisible(false);
- Parameters:
value-- See Also:
resetVisible
-
getWidth
public int getWidth()
Description goes here
-
setWidth
public void setWidth(int value)
Description goes here- Parameters:
value-
-
isZoom
public boolean isZoom()
Allows you to select a section of the chart using the mouse cursor and zoom in that area.
PopulateProductSales(chart1); chart1.getTitles().add(new TitleDockable("Wine Sales by Type")); chart1.getAxisY().getLabelsFormat().setFormat(AxisFormat.CURRENCY); chart1.setZoom(true);public static void PopulateProductSales(Chart chart1) { ProductSales[] data = new ProductSales[]{ new ProductSales("Jan", 12560, 23400, 34500), new ProductSales("Feb", 13400, 21000, 38900), new ProductSales("Mar", 16700, 17000, 42100), new ProductSales("Apr", 12000, 19020, 43800), new ProductSales("May", 15800, 26500, 37540), new ProductSales("Jun", 9800, 27800, 32580), new ProductSales("Jul", 17800, 29820, 34000), new ProductSales("Aug", 19800, 17800, 38000), new ProductSales("Sep", 23200, 32000, 41300), new ProductSales("Oct", 16700, 26500, 46590), new ProductSales("Nov", 11800, 23000, 48700), new ProductSales("Dec", 13400, 15400, 49100) }; ObjectProvider objProvider = new ObjectProvider(data); chart1.getDataSourceSettings().setDataSource(objProvider); }public static class ProductSales { public ProductSales(String month, double white, double red, double sparkling) { this.setMonth(month); this.setWhite(white); this.setRed(red); this.setSparkling(sparkling); } private String privateMonth; public final String getMonth() { return privateMonth; } public final void setMonth(String value) { privateMonth = value; } private double privateWhite; public final double getWhite() { return privateWhite; } public final void setWhite(double value) { privateWhite = value; } private double privateRed; public final double getRed() { return privateRed; } public final void setRed(double value) { privateRed = value; } private double privateSparkling; public final double getSparkling() { return privateSparkling; } public final void setSparkling(double value) { privateSparkling = value; } }
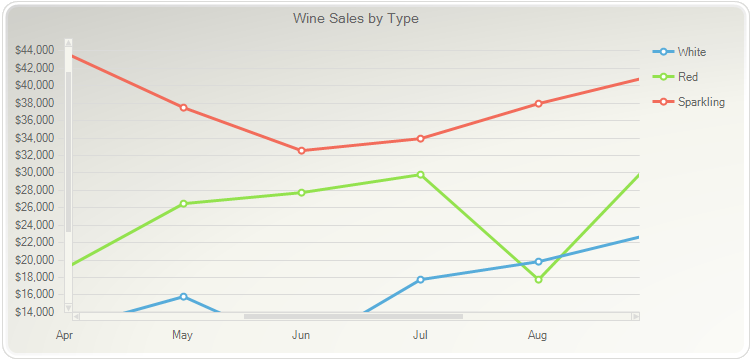
- See Also:
resetZoom
-
setZoom
public void setZoom(boolean value)
Allows you to select a section of the chart using the mouse cursor and zoom in that area.
PopulateProductSales(chart1); chart1.getTitles().add(new TitleDockable("Wine Sales by Type")); chart1.getAxisY().getLabelsFormat().setFormat(AxisFormat.CURRENCY); chart1.setZoom(true);public static void PopulateProductSales(Chart chart1) { ProductSales[] data = new ProductSales[]{ new ProductSales("Jan", 12560, 23400, 34500), new ProductSales("Feb", 13400, 21000, 38900), new ProductSales("Mar", 16700, 17000, 42100), new ProductSales("Apr", 12000, 19020, 43800), new ProductSales("May", 15800, 26500, 37540), new ProductSales("Jun", 9800, 27800, 32580), new ProductSales("Jul", 17800, 29820, 34000), new ProductSales("Aug", 19800, 17800, 38000), new ProductSales("Sep", 23200, 32000, 41300), new ProductSales("Oct", 16700, 26500, 46590), new ProductSales("Nov", 11800, 23000, 48700), new ProductSales("Dec", 13400, 15400, 49100) }; ObjectProvider objProvider = new ObjectProvider(data); chart1.getDataSourceSettings().setDataSource(objProvider); }public static class ProductSales { public ProductSales(String month, double white, double red, double sparkling) { this.setMonth(month); this.setWhite(white); this.setRed(red); this.setSparkling(sparkling); } private String privateMonth; public final String getMonth() { return privateMonth; } public final void setMonth(String value) { privateMonth = value; } private double privateWhite; public final double getWhite() { return privateWhite; } public final void setWhite(double value) { privateWhite = value; } private double privateRed; public final double getRed() { return privateRed; } public final void setRed(double value) { privateRed = value; } private double privateSparkling; public final double getSparkling() { return privateSparkling; } public final void setSparkling(double value) { privateSparkling = value; } }
- Parameters:
value-- See Also:
resetZoom
-
clearBindings
public void clearBindings()
Clears all the current bindings from the chart object.
Clearing the bindings from the chart object will include clearing the series, axis, datafields and data transformers.
To clear all the bindings from the chart:
chart1.ClearBindings();
-
dateToNumber
public static double dateToNumber(java.util.Calendar date)
Description goes here- Parameters:
date-
-
dateToNumber
public static double dateToNumber(java.util.Date date)
Description goes here- Parameters:
date-
-
expandMacros
public java.lang.String expandMacros(java.lang.String mask, int series, int point, boolean inPoint)Returns the mask string for a selected point or line in a chart .This method is useful when you would like to return the configured mask string for a selected point label.
You may set the mask string for a selected chart element using the
setFormatmethod of thePointLabelAttributesclass, or thesetToolTipFormatmethod.Read the mask string for the 2nd point in the 1st series:
java.lang.String maskString; maskString = chart1.ExpandMacros("", 0, 1, false);
- Parameters:
mask- Speicifies the mask string. (May be null value.)series- Specifies the Point.point- Specifies the Series.inPoint- Specifies to return the mask of the Point or the line between the Points.
-
exportChart
public void exportChart(java.io.OutputStream stream)
Allows you to export the chart to a stream.When saving to a Binary or XML file, you may select which chart settings to save by using the FileMask method.
You may specify the path of the file as follows:
chart1.Export(FileFormat.Bitmap, "C:\\temp\\image.bmp");
- Parameters:
stream- A stream where to store the exported chart.
-
exportChart
public void exportChart(FileFormat format, java.io.OutputStream stream)
Allows you to export the chart to a stream using a specific file format.When saving to a Binary or XML file, you may select which chart settings to save by using the FileMask method.
You may specify the path of the file as follows:
chart1.Export(FileFormat.Bitmap, "C:\\temp\\image.bmp");
- Parameters:
format- The available formats the export can handle.stream- A stream where to store the exported chart.
-
exportChart
public void exportChart(FileFormat format, java.lang.String fileName)
Allows you to export the chart to a data file using a specific file format.When saving to a Binary or XML file, you may select which chart settings to save by using the FileMask method.
You may specify the path of the file as follows:
chart1.Export(FileFormat.Bitmap, "C:\\temp\\image.bmp");
- Parameters:
format- The available formats the export can handle.fileName- The location of the file where to export the chart.
-
getMessageText
public java.lang.String getMessageText(java.lang.String key)
Allows you to obtain default Chart FX stings which are displayed in the chart.
The key parameter is case sensitive, therefore you must use the exact pre-defined key value string.
You can use the
setCulturemethod to fully localize your charts. Elements that can be modified include the names of the culture, the writing system, and the calendar used, as well as formatting dates and strings.The
setCulturemethod of theValueFormatclass allow you to assign culture specific formatting to labels and numbers for a selected axis.Pre-defined message identifiers with the defualt values for each key (key=value):
NoData=No Data Available
Text
LicDownloading=Downloading License ...
Text
DataDownloading=Downloading Chart ...
Text
DataFailed=Failed to download Chart\n{0}
Text
Mask.Percentage=%s\n%l\n%v out of %t\n(%p%%)
Text
Mask.OHLC=%l\nOpen: %v2\nHigh: %v4 - Low: %v1\nClose: %v3
Text
Mask.HLC=%l\nHigh: %v3 - Low: %v1\nClose %v2
Text
Mask.Ini=%s\n%l\nFrom %i to\n%v
Text
Mask.XY=%s\n%l\nX: %x, Y: %v
Text
Mask.Between=%s\n%l - %l\n%v - %v
Text
Mask.Default=%s\n%l\n%v
Text
LegMask.Series=Series #{0}
Text
LegMask.Values=Value #{0}
Text
CFX61B0=A temporary file on {0} could not be created
Text
XAxis=X Axis
Text
YAxis=Y Axis
Text
General=General
Text
Series=Series
Text
Chart=Chart Area
Text
Draw=Drawing Area
Text
AllSeries=All Series
Text
Auto=Auto
Text
None=None
Text
Raised=Raised
Text
Light=Light
Text
Dark=Dark
Text
Opposite=Opposite
Text
Shadow=Shadow
Text
Number=Number
Text
Currency=Currency
Text
Scientific=Scientific
Text
Percentage=Percentage
Text
Date=Short Date
Text
LongDate=Long Date
Text
Time=Time
Text
DateTime=Date-Time
Text
Label0=Horizontal
Text
Label1=Vertical
Text
Label2=45 Degrees
Text
Inside=Inside
Text
Outside=Outside
Text
Cross=Across
Text
ExportFilter=ChartFX File (*.cfx)|*.cfx|Text File (data only)|*.txt|XML File (methods only)|*.xml|Bitmap Image (*.bmp)|*.bmp|Metafile Picture (*.emf)|*.emf
Text
ImportFilter=ChartFX Files (*.cfx)|*.cfx|Text Files (data only)|*.txt|XML Files(methods only)|*.xml
Text
NoPermission=The application does not have enough permissions to execute this operation.To obtain the string for the "NoData" string:
java.lang.String t; t = chart1.GetMessageText("NoData"); chart1.getTitles().add(new TitleDockable(t));
- Parameters:
key- Pre-defined message identifier.
-
importChart
public void importChart(java.io.InputStream stream)
Allows you to import the chart from a stream.If an error is encountered, an exception will be thrown. Your Java may allow you to catch this exception and add your own custom error messages. For more information regarding your own custom error messages, please refer to the Java.
To import a previously saved chart file:
chart1.Import(FileFormat.Binary, "C:\\MyDir\\chart1.bin");
- Parameters:
stream- A stream that contains the chart to be imported.
-
importChart
public void importChart(FileFormat format, java.io.InputStream stream)
Allows you to import the chart from a stream using a specific file format.If an error is encountered, an exception will be thrown. Your Java may allow you to catch this exception and add your own custom error messages. For more information regarding your own custom error messages, please refer to the Java.
To import a previously saved chart file:
chart1.Import(FileFormat.Binary, "C:\\MyDir\\chart1.bin");
- Parameters:
format- The available formats the import can handle.stream- A stream that contains the chart to be imported.
-
importChart
public void importChart(FileFormat format, java.lang.String fileName)
Allows you to import the chart from a file using a specific file format.If an error is encountered, an exception will be thrown. Your Java may allow you to catch this exception and add your own custom error messages. For more information regarding your own custom error messages, please refer to the Java.
To import a previously saved chart file:
chart1.Import(FileFormat.Binary, "C:\\MyDir\\chart1.bin");
- Parameters:
format- The available formats the import can handle.fileName- The location of the file that contains the chart to be imported.
-
isLicensed
public static boolean isLicensed()
Description goes here
-
markerToPixel
public java.awt.Point markerToPixel(int series, int point)Returns a point storing the position in pixel of a specified chart marker.
Note that the x,y are in chart coordinates, where 0,0 is the top-left corner of the chart area.
When this method is applied to a bar chart, the point object is from the top center of the select bar.
This method may be used in conjunction with annotation objects. You may position annotation objects with chart markers very easily by extracting the X and Y values from the returned point object.
To read point value for the chart marker of the first series and fourth point:
SfxNET.System.Drawing.Point vPoint = new SfxNET.System.Drawing.Point(); vPoint = new SfxNET.System.Drawing.Point(); vPoint = chart1.MarkerToPixel(0, 3).StructClone();
- Parameters:
series- An integer specifying the point.point- An integer specifying the series.
-
paint
public void paint(java.awt.Graphics2D g, java.awt.Rectangle r, java.util.EnumSet<PaintStyles> paintFlags)Allows you to paint the chart in a given device context.
This function is very useful when you want to print charts and others objects in the same page or more than one chart in a page.
If you want to print the chart in full page mode, please refer to the
Printerclass.- Parameters:
g-r-paintFlags-
-
performDrillDown
public void performDrillDown(int series, int point)Used to DrillDown for a specific point.
When the
performDrillDownmethod is used the chart will drill down in the specified point and series.To perform a DrillDown for the point 3 of series 0:
chart1.PerformDrillDown(0, 3);
- Parameters:
series- An integer specifying the series.point- An integer specifying the point.
-
performDrillUp
public void performDrillUp()
Returns to the parent chart prior to the DrillDown.
When used the chart returns back to the original chart prior to the DrillDown.
To return to the parent chart after a DrillDown has been perfomed:
chart1.PerformDrillUp();
-
recalculateScale
public void recalculateScale()
Resets and recalculates all scale values.
This method should be invoked to force Chart FX to calculate the Min, Max and Step for the axes.
Please keep in mind that this method reads the entire data array, so abusing this method could affect the performance of your application, as Chart FX will read the entire data array every time this method is called.
This method will not affect the
setStepandsetMinorStepDateTimeif they have been previously set. To make sure they respond to this method make sure the Step and MinorStep methods are set to zero (0).A typical case of when to use this method is when you disable the
isAutoScalemethod to calculate yoursetMinandsetMaxand you set new data to the chart that causes the scale values to be recalculated to show the appropriate data.When using a
setStackedstyle chart, recalculating the scale will sometimes make the chart more readable.To recalculate scale values for all numerical axes:
chart1.recalculateScale();
-
renderControl
public void renderControl()
Renders the chart directly to the browser response context.Generates a chart and embeds the required object tag or image and image map tags to the resulting html output for chart display.
One of the RenderControl greatest advantages is that charts can be easily integrated into your existing scripts and it allows support for automatic browser detection. However, saving a file to disk can have its toll on server performance.
When this method is called, a chart file is generated and saved in a temporary folder. A tag is automatically passed to the browser's response context for the chart to be displayed.
The
setRenderFormatmethod may be used to specify the format of the chart to create.The
renderToStreammethod may be used to bit-stream a chart directly to the browser or retrieve the chart image, image map and html tag in one call.To render a chart directly to the browser's response context:
chart1.renderControl();
-
renderToStream
public void renderToStream()
Used to bit-stream a chart directly to the browser or retrieve the chart image, image map and html tag in one call.
The
renderToStreammethod is used to bit-stream a chart directly to the browser. This avoids the generation of temporary files.Using the 3 parameter overload of this method, developers can obtain the image maps, image tag and the image itself, providing them full control of the handling of the Chart output.
The
setRenderFormatmethod is used to control what type of chart format to generate when using therenderToStreammethod.The following example may be used to bitstream a chart image:
chart1.renderToStream();
The following example writes the chart image, image map and image tag to FileStream objects. However, developers may use any supported stream object (e.g. MemoryStream):
ChartServer chart1 = new ChartServer(pageContext, request, response); chart1.setID("chart1"); OutputStream fileStream; Writer imgMapText; Writer htmlTag; fileStream = new FileOutputStream(application.getRealPath("/") + "getHtmlDataEx.png", false); imgMapText = new FileWriter(application.getRealPath("/") + "imgMapText.txt"); htmlTag = new FileWriter(application.getRealPath("/") + "htmlTag.txt"); chart1.renderToStream(fileStream, imgMapText, htmlTag); imgMapText.close(); htmlTag.close();
-
renderToStream
public void renderToStream(java.io.OutputStream content, java.io.Writer imgMap, java.io.Writer htmlTag)Used to bit-stream a chart directly to the browser or retrieve the chart image, image map and html tag in one call.
The
renderToStreammethod is used to bit-stream a chart directly to the browser. This avoids the generation of temporary files.Using the 3 parameter overload of this method, developers can obtain the image maps, image tag and the image itself, providing them full control of the handling of the Chart output.
The
setRenderFormatmethod is used to control what type of chart format to generate when using therenderToStreammethod.The following example may be used to bitstream a chart image:
chart1.renderToStream();
The following example writes the chart image, image map and image tag to FileStream objects. However, developers may use any supported stream object (e.g. MemoryStream):
ChartServer chart1 = new ChartServer(pageContext, request, response); chart1.setID("chart1"); OutputStream fileStream; Writer imgMapText; Writer htmlTag; fileStream = new FileOutputStream(application.getRealPath("/") + "getHtmlDataEx.png", false); imgMapText = new FileWriter(application.getRealPath("/") + "imgMapText.txt"); htmlTag = new FileWriter(application.getRealPath("/") + "htmlTag.txt"); chart1.renderToStream(fileStream, imgMapText, htmlTag); imgMapText.close(); htmlTag.close();
- Parameters:
content- Stream that contains the image data.imgMap- TextWriter that contains the image map information.htmlTag- TextWriter that contains the Html tag information.
-
reset
public void reset()
Resets the chart to its original state.
Below is the chart before Reset is called:
PopulatePopulationData(chart1); chart1.getTitles().add(new TitleDockable("Population Distribution by Gender and Age Range")); chart1.getAxisY().getTitle().setText("Percentage"); chart1.getAxisX().getTitle().setText("Age Range");public static void PopulatePopulationData(Chart chart1, String fieldNames) { PopulationData[] data = new PopulationData[]{ new PopulationData("0-4", 10471, 10024), new PopulationData("5-9", 9954, 9512), new PopulationData("10-14", 10670, 10167), new PopulationData("15-19", 10871, 10312), new PopulationData("20-24", 10719, 10178), new PopulationData("25-29", 10060, 9744), new PopulationData("30-34", 10021, 9864), new PopulationData("35-39", 10479, 10424), new PopulationData("40-44", 11294, 11454), new PopulationData("45-49", 11080, 11377), new PopulationData("50-54", 9772, 10212), new PopulationData("55-59", 8415, 8944), new PopulationData("60-64", 6203, 6814), new PopulationData("65-69", 4712, 5412), new PopulationData("70-74", 3804, 4697), new PopulationData("75-79", 3094, 4282), new PopulationData("80-84", 2117, 3459), new PopulationData("85-89", 1072, 2135), new PopulationData("90-94", 397, 1034), new PopulationData("95-99", 91, 321), new PopulationData("100+", 12, 58) }; ObjectProvider objProvider = new ObjectProvider(data); chart1.getDataSourceSettings().setDataSource(objProvider); if (fieldNames != "") { List<DataField> removeFields = new ArrayList<DataField>(); List<String> includeFields = Arrays.asList(fieldNames.split(",")); chart1.getDataSourceSettings().fillFromSchema(); for (DataField dataField : chart1.getDataSourceSettings().getDataFields()) { if (dataField.isMeasure() && !includeFields.contains(dataField.getDataPath())) { removeFields.add(dataField); } } for (DataField dataField : removeFields) { chart1.getDataSourceSettings().getDataFields().remove(dataField); } } } public static void PopulatePopulationData(Chart chart1) { PopulatePopulationData(chart1, ""); }public static class PopulationData { public PopulationData(String range, double male, double female) { this.setRange(range); this.setMale(male); this.setFemale(female); } private String privateRange; public final String getRange() { return privateRange; } public final void setRange(String value) { privateRange = value; } private double privateMale; public final double getMale() { return privateMale; } public final void setMale(double value) { privateMale = value; } private double privateFemale; public final double getFemale() { return privateFemale; } public final void setFemale(double value) { privateFemale = value; } }
When Reset is called, all the custom visual attributes as well as the
setDataare cleared.Below is the same chart after it has been reset:
PopulatePopulationData(chart1); chart1.getTitles().add(new TitleDockable("Population Distribution by Gender and Age Range")); chart1.getAxisY().getTitle().setText("Percentage"); chart1.getAxisX().getTitle().setText("Age Range"); chart1.Reset();public static void PopulatePopulationData(Chart chart1, String fieldNames) { PopulationData[] data = new PopulationData[]{ new PopulationData("0-4", 10471, 10024), new PopulationData("5-9", 9954, 9512), new PopulationData("10-14", 10670, 10167), new PopulationData("15-19", 10871, 10312), new PopulationData("20-24", 10719, 10178), new PopulationData("25-29", 10060, 9744), new PopulationData("30-34", 10021, 9864), new PopulationData("35-39", 10479, 10424), new PopulationData("40-44", 11294, 11454), new PopulationData("45-49", 11080, 11377), new PopulationData("50-54", 9772, 10212), new PopulationData("55-59", 8415, 8944), new PopulationData("60-64", 6203, 6814), new PopulationData("65-69", 4712, 5412), new PopulationData("70-74", 3804, 4697), new PopulationData("75-79", 3094, 4282), new PopulationData("80-84", 2117, 3459), new PopulationData("85-89", 1072, 2135), new PopulationData("90-94", 397, 1034), new PopulationData("95-99", 91, 321), new PopulationData("100+", 12, 58) }; ObjectProvider objProvider = new ObjectProvider(data); chart1.getDataSourceSettings().setDataSource(objProvider); if (fieldNames != "") { List<DataField> removeFields = new ArrayList<DataField>(); List<String> includeFields = Arrays.asList(fieldNames.split(",")); chart1.getDataSourceSettings().fillFromSchema(); for (DataField dataField : chart1.getDataSourceSettings().getDataFields()) { if (dataField.isMeasure() && !includeFields.contains(dataField.getDataPath())) { removeFields.add(dataField); } } for (DataField dataField : removeFields) { chart1.getDataSourceSettings().getDataFields().remove(dataField); } } } public static void PopulatePopulationData(Chart chart1) { PopulatePopulationData(chart1, ""); }public static class PopulationData { public PopulationData(String range, double male, double female) { this.setRange(range); this.setMale(male); this.setFemale(female); } private String privateRange; public final String getRange() { return privateRange; } public final void setRange(String value) { privateRange = value; } private double privateMale; public final double getMale() { return privateMale; } public final void setMale(double value) { privateMale = value; } private double privateFemale; public final double getFemale() { return privateFemale; } public final void setFemale(double value) { privateFemale = value; } }
-
resetAllowChanges
public void resetAllowChanges()
Set the property AllowChanges to its default value.- See Also:
setAllowChanges
-
resetAllowDrag
public void resetAllowDrag()
Set the property AllowDrag to its default value.- See Also:
isAllowDrag
-
resetAntialiasing
public void resetAntialiasing()
Set the property Antialiasing to its default value.- See Also:
isAntialiasing
-
resetAxesStyle
public void resetAxesStyle()
Set the property AxesStyle to its default value.- See Also:
setAxesStyle
-
resetBackColor
public void resetBackColor()
Set the property BackColor to its default value.- See Also:
setBackColor
-
resetBackground
public void resetBackground()
Set the property Background to its default value.
-
resetBorder
public void resetBorder()
Set the property Border to its default value.
-
resetContextMenus
public void resetContextMenus()
Set the property ContextMenus to its default value.- See Also:
isContextMenus
-
resetCrosshairs
public void resetCrosshairs()
Set the property Crosshairs to its default value.- See Also:
isCrosshairs
-
resetCulture
public void resetCulture()
Set the property Culture to its default value.- See Also:
setCulture
-
resetDrillDownType
public void resetDrillDownType()
Set the property DrillDownType to its default value.- See Also:
setDrillDownType
-
resetExtraStyle
public void resetExtraStyle()
Set the property ExtraStyle to its default value.- See Also:
setExtraStyle
-
resetFont
public void resetFont()
Set the property Font to its default value.
-
resetForeColor
public void resetForeColor()
Set the property ForeColor to its default value.- See Also:
setForeColor
-
resetMonochrome
public void resetMonochrome()
Set the property Monochrome to its default value.- See Also:
isMonochrome
-
resetPageColor
public void resetPageColor()
Set the property PageColor to its default value.- See Also:
setPageColor
-
resetPalette
public void resetPalette()
Set the property Palette to its default value.- See Also:
setPalette
-
resetPlotAreaColor
public void resetPlotAreaColor()
Set the property PlotAreaColor to its default value.- See Also:
setPlotAreaColor
-
resetProxyUri
public void resetProxyUri()
Set the property ProxyUri to its default value.- See Also:
setProxyUri
-
resetRenderFormat
public void resetRenderFormat()
Set the property RenderFormat to its default value.- See Also:
setRenderFormat
-
resetStylePrefix
public void resetStylePrefix()
Set the property StylePrefix to its default value.
-
resetTemplateContents
public void resetTemplateContents()
Set the property TemplateContents to its default value.- See Also:
setTemplateContents
-
resetToolTipFormat
public void resetToolTipFormat()
Set the property ToolTipFormat to its default value.- See Also:
setToolTipFormat
-
resetToolTips
public void resetToolTips()
Set the property ToolTips to its default value.- See Also:
isToolTips
-
resetUseCallbacksForEvents
public void resetUseCallbacksForEvents()
Set the property UseCallbacksForEvents to its default value.- See Also:
isUseCallbacksForEvents
-
resetUseStyles
public void resetUseStyles()
Set the property UseStyles to its default value.
-
resetVisible
public void resetVisible()
Set the property Visible to its default value.- See Also:
isVisible
-
resetZoom
public void resetZoom()
Set the property Zoom to its default value.- See Also:
isZoom
-
setConfigPath
public static void setConfigPath(java.lang.String path)
Description goes here- Parameters:
path-
-
setLicenseString
public static void setLicenseString(java.lang.String licenseString)
Description goes here- Parameters:
licenseString-
-
setMessageText
public void setMessageText(java.lang.String key, java.lang.String message)Allows you to customize default Chart FX strings which are displayed in the chart.
The key parameter is case sensitive, therefore you must use the exact pre-defined key value string.
You can use the
setCulturemethod to fully localize your charts. Elements that can be modified include the names of the culture, the writing system, and the calendar used, as well as formatting dates and strings.The
setCulturemethod of theValueFormatclass allow you to assign culture specific formatting to labels and numbers for a selected axis.Pre-defined message identifiers with the defualt values for each key:
Key Default value NoData No Data Available LicDownloading Downloading License ... DataDownloading Downloading Chart ... DataFailed Failed to download Chart\n{0} Mask.Percentage %s\n%l\n%v out of %t\n(%p%%) Mask.OHLC %l\nOpen: %v2\nHigh: %v4 - Low: %v1\nClose: %v3 Mask.HLC %l\nHigh: %v3 - Low: %v1\nClose %v2 Mask.Ini %s\n%l\nFrom %i to\n%v Mask.XY %s\n%l\nX: %x, Y: %v Mask.Between %s\n%l - %l\n%v - %v Mask.Default %s\n%l\n%v LegMask.Series Series #{0} LegMask.Values Value #{0} CFX61B0 A temporary file on {0} could not be created XAxis X Axis YAxis Y Axis General General Series Series Chart Chart Area Draw Drawing Area AllSeries All Series Auto Auto None None Raised Raised Light Light Dark Dark Opposite Opposite Shadow Shadow Number Number Currency Currency Scientific Scientific Percentage Percentage Date ShortDate LongDate Long Date Time Time DateTime Date-Time Label0 Horizontal Label1 Vertical Label2 45 Degrees Inside Inside Outside Outside Cross Across ExportFilter ChartFX File (*.cfx)|*.cfx|Text File (data only)|*.txt|XML File (methods only)|*.xml|Bitmap Image (*.bmp)|*.bmp|Metafile Picture (*.emf)|*.emf ImportFilter ChartFX Files (*.cfx)|*.cfx|Text Files (data only)|*.txt|XML Files(methods only)|*.xml NoPermission The application does not have enough permissions to execute this operation. To set a custom message for the 'YAxis' text message:
chart1.SetMessageText("YAxis", "Custom String");
- Parameters:
key- The new string value for the message.message- Pre-defined message identifier.
-
updateSizeNow
public void updateSizeNow()
Allows you to force a scale calculation before the chart is drawn.Scale calculations in Chart FX are delayed until the chart is about to be drawn. This increases the performance as setting multiple methods from only one windows event, cause only
one recalculation.The
updateSizeNowmethod allows you to make this on demand. This allows you to access information about the chart scaling before it is drawn. It also allows you to make changes to a chart and export it to a picture without the chart ever being visible.To force the calculation of the chart scale:
chart1.UpdateSizeNow();
-
zoomToPercentage
public void zoomToPercentage(int percentage)
Zooms the chart to center based on configured percentage value.This method is used to zoom to the center of the chart. Both X and Y axes are zoomed at the same time.
The percentage value should be configured as an integer value between 0 and 100.
After calling this method, the user can continue to zoom the chart using the mouse in selected chart types. Webform chart images (static and interactive images) do not support continued zoom after the ZoomToPercentage call.
To configure a 50% zoom to center:
chart1.ZoomToPercentage(50);
- Parameters:
percentage- The percentage to zoom.
-
zoomToWindow
public void zoomToWindow(int x1, int y1, int x2, int y2)Zooms the chart to a rectangular area based on specified x and y coordinates for the rectangle
The Zooming rectangle is defined Using Left and Top pixel coordinates.
The X and Y coordinates are relative to the Top Left corner of the plot area. I other words, the top left point of the plot area is point (0,0)
You can use this method in conjunction with the
valueToPixelmethod of the axes to define a zooming rectangle based on actual values.To Zoom the chart to a specific rectangle:
chart1.zoomToWindow(30, 40, 200, 100);
- Parameters:
x1- Y coordinate of the zooming rectangle’s Bottom side.y1- Y coordinate of the zooming rectangle’s Top side.x2- X coordinate of the zooming rectangle’s Right side.y2- X coordinate of the zooming rectangle’s Left side.
-
addChangedByUserListener
public void addChangedByUserListener(ChangedByUserListener value)
Adds a ChangedByUserListener to the listener list.- Parameters:
value-
-
removeChangedByUserListener
public void removeChangedByUserListener(ChangedByUserListener value)
Removes a ChangedByUserListener from the listener list.- Parameters:
value-
-
addClickListener
public void addClickListener(HitTestListener value)
Adds a ClickListener to the listener list.- Parameters:
value-
-
removeClickListener
public void removeClickListener(HitTestListener value)
Removes a ClickListener from the listener list.- Parameters:
value-
-
addConditionalAttributesCallbackListener
public void addConditionalAttributesCallbackListener(ConditionalAttributesListener value)
Adds a ConditionalAttributesCallbackListener to the listener list.- Parameters:
value-
-
removeConditionalAttributesCallbackListener
public void removeConditionalAttributesCallbackListener(ConditionalAttributesListener value)
Removes a ConditionalAttributesCallbackListener from the listener list.- Parameters:
value-
-
addDataChangedListener
public void addDataChangedListener(EventListener value)
Adds a DataChangedListener to the listener list.- Parameters:
value-
-
removeDataChangedListener
public void removeDataChangedListener(EventListener value)
Removes a DataChangedListener from the listener list.- Parameters:
value-
-
addDataSourceChangedListener
public void addDataSourceChangedListener(EventListener value)
Adds a DataSourceChangedListener to the listener list.- Parameters:
value-
-
removeDataSourceChangedListener
public void removeDataSourceChangedListener(EventListener value)
Removes a DataSourceChangedListener from the listener list.- Parameters:
value-
-
addDrillDownListener
public void addDrillDownListener(DrillDownListener value)
Adds a DrillDownListener to the listener list.- Parameters:
value-
-
removeDrillDownListener
public void removeDrillDownListener(DrillDownListener value)
Removes a DrillDownListener from the listener list.- Parameters:
value-
-
addGetAxisLabelListener
public void addGetAxisLabelListener(AxisLabelListener value)
Adds a GetAxisLabelListener to the listener list.- Parameters:
value-
-
removeGetAxisLabelListener
public void removeGetAxisLabelListener(AxisLabelListener value)
Removes a GetAxisLabelListener from the listener list.- Parameters:
value-
-
addGetPointLabelListener
public void addGetPointLabelListener(PointLabelListener value)
Adds a GetPointLabelListener to the listener list.- Parameters:
value-
-
removeGetPointLabelListener
public void removeGetPointLabelListener(PointLabelListener value)
Removes a GetPointLabelListener from the listener list.- Parameters:
value-
-
addInternalCommandListener
public void addInternalCommandListener(CommandUIListener value)
Adds a InternalCommandListener to the listener list.- Parameters:
value-
-
removeInternalCommandListener
public void removeInternalCommandListener(CommandUIListener value)
Removes a InternalCommandListener from the listener list.- Parameters:
value-
-
addPaintMarkerListener
public void addPaintMarkerListener(PaintMarkerListener value)
Adds a PaintMarkerListener to the listener list.- Parameters:
value-
-
removePaintMarkerListener
public void removePaintMarkerListener(PaintMarkerListener value)
Removes a PaintMarkerListener from the listener list.- Parameters:
value-
-
addPersonalizedListener
public void addPersonalizedListener(PersonalizeListener value)
Adds a PersonalizedListener to the listener list.- Parameters:
value-
-
removePersonalizedListener
public void removePersonalizedListener(PersonalizeListener value)
Removes a PersonalizedListener from the listener list.- Parameters:
value-
-
addPostPaintListener
public void addPostPaintListener(CustomPaintListener value)
Adds a PostPaintListener to the listener list.- Parameters:
value-
-
removePostPaintListener
public void removePostPaintListener(CustomPaintListener value)
Removes a PostPaintListener from the listener list.- Parameters:
value-
-
addPrePaintListener
public void addPrePaintListener(CustomPaintListener value)
Adds a PrePaintListener to the listener list.- Parameters:
value-
-
removePrePaintListener
public void removePrePaintListener(CustomPaintListener value)
Removes a PrePaintListener from the listener list.- Parameters:
value-
-
addPrePaintMarkerListener
public void addPrePaintMarkerListener(PaintMarkerListener value)
Adds a PrePaintMarkerListener to the listener list.- Parameters:
value-
-
removePrePaintMarkerListener
public void removePrePaintMarkerListener(PaintMarkerListener value)
Removes a PrePaintMarkerListener from the listener list.- Parameters:
value-
-
addSelectionChangedListener
public void addSelectionChangedListener(EventListener value)
Adds a SelectionChangedListener to the listener list.- Parameters:
value-
-
removeSelectionChangedListener
public void removeSelectionChangedListener(EventListener value)
Removes a SelectionChangedListener from the listener list.- Parameters:
value-
-
addUserCallbackListener
public void addUserCallbackListener(UserCallbackListener value)
Adds a UserCallbackListener to the listener list.- Parameters:
value-
-
removeUserCallbackListener
public void removeUserCallbackListener(UserCallbackListener value)
Removes a UserCallbackListener from the listener list.- Parameters:
value-
-
addUserCommandListener
public void addUserCommandListener(CommandUIListener value)
Adds a UserCommandListener to the listener list.- Parameters:
value-
-
removeUserCommandListener
public void removeUserCommandListener(CommandUIListener value)
Removes a UserCommandListener from the listener list.- Parameters:
value-
-
addUserScrollListener
public void addUserScrollListener(AxisListener value)
Adds a UserScrollListener to the listener list.- Parameters:
value-
-
removeUserScrollListener
public void removeUserScrollListener(AxisListener value)
Removes a UserScrollListener from the listener list.- Parameters:
value-
-
addUserZoomListener
public void addUserZoomListener(EventListener value)
Adds a UserZoomListener to the listener list.- Parameters:
value-
-
removeUserZoomListener
public void removeUserZoomListener(EventListener value)
Removes a UserZoomListener from the listener list.- Parameters:
value-
-
addUserZoomingListener
public void addUserZoomingListener(UserZoomingListener value)
Adds a UserZoomingListener to the listener list.- Parameters:
value-
-
removeUserZoomingListener
public void removeUserZoomingListener(UserZoomingListener value)
Removes a UserZoomingListener from the listener list.- Parameters:
value-
-
-