- java.lang.Object
-
- com.softwarefx.chartfx.server.HighlightAttributes
-
public final class HighlightAttributes
extends java.lang.Object
Provides access to the HighlightAttributes object, which allows you to customized how the elements of the chart are highlighted.
Chart FX supports highlighting features that improve end users readability by allowing them to select chart elements in which to focus attention. This analytic tool allows users to easily discover values in the chart. There are several scenarios in which this is very useful, for example when a large number of points are visible in the chart area. Providing this feature in the chart allows end users to highlight and discover points. When an item is highlighted in a chart, the other Chart FX tools visible also reflect the action.
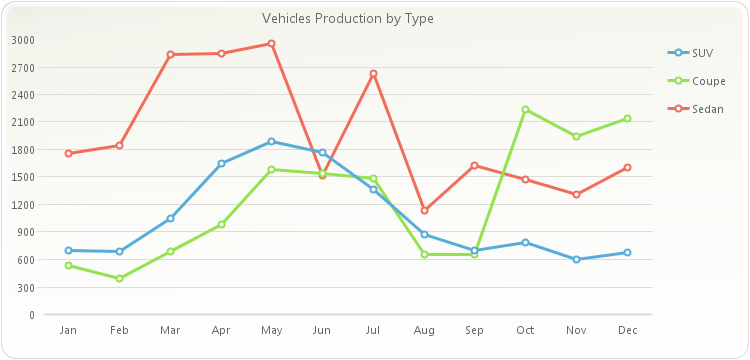
PopulateCarProduction(chart1);
chart1.getTitles().add(new TitleDockable("Vehicles Production by Type"));
public static void PopulateCarProduction(Chart chart1) { CarProduction[] production = new CarProduction[] { new CarProduction("Jan", 1760, 535, 695 ) , new CarProduction("Feb", 1849, 395, 688 ) , new CarProduction("Mar", 2831, 685, 1047 ) , new CarProduction("Apr", 2851, 984, 1652 ) , new CarProduction("May", 2961, 1579, 1889 ) , new CarProduction("Jun", 1519, 1539, 1766 ) , new CarProduction("Jul", 2633, 1489, 1361 ) , new CarProduction("Aug", 1140, 650, 874 ) , new CarProduction("Sep", 1626, 653, 693 ) , new CarProduction("Oct", 1478, 2236, 786 ) , new CarProduction("Nov", 1306, 1937, 599 ) , new CarProduction("Dec", 1607, 2138, 678 ) }; ObjectProvider objProvider = new ObjectProvider(production); chart1.getDataSourceSettings().setDataSource(objProvider); }public static class CarProduction { private CarProduction(String month, int sedan, int coupe, int SUV) { this.setMonth(month); this.setSedan(sedan); this.setCoupe(coupe); this.setSUV(SUV); } private String privateMonth; public final String getMonth() { return privateMonth; } public final void setMonth(String value) { privateMonth = value; } private int privateSedan; public final int getSedan() { return privateSedan; } public final void setSedan(int value) { privateSedan = value; } private int privateCoupe; public final int getCoupe() { return privateCoupe; } public final void setCoupe(int value) { privateCoupe = value; } private int privateSUV; public final int getSUV() { return privateSUV; } public final void setSUV(int value) { privateSUV = value; } }

To highlight a element in a chart, simply hover the mouse over a desired series while the
setHighlightmethod is set to true for this element. TheHighlightAttributesclass is accessed using thesetHighlightmethod of theChartclass.This class is the core of the highlighting feature. Using the supported members, you can turn the highlight feature on and off (using
isEnabled), highlight chart items programmatically, add additional code to highlight processing (using the Highlighted event),clearHighlight, control how points will be painted when highlighted and much more.The amount of time taken for a selected series to display it's highlighted state may be controlled using the
setSpeedmethod.The
PointAttributesmethod returns aPointAttributesobject, allowing you to customize the visual attriutes of a highlighted series.
-
-
Constructor Summary
Constructors Constructor and Description HighlightAttributes()Constructs a newly allocated HighlightAttributes object
-
Method Summary
Methods Modifier and Type Method and Description voidclearHighlight(java.lang.Object sender)Remove any highlighting applied to the chart.PointAttributesgetPointAttributes()Returns the PointAttributes object for a highlighted series.HighlightSpeedgetSpeed()Gets or sets a value indicating the time delay before action is taken to show the highlighted state of a series.voidhighlightItem(java.lang.Object item)Highlights a selected chart element.booleanisDimmed()Gets or sets a value indicating whether the non-selected series will dim (in color) when a series is highlighted.booleanisEnabled()Gets or sets a value indicating whether the highlighting feature will be enabled in the chart.booleanisIgnorePointAttributes()Allows you to modify the highlighting behavior for the chart points.voidresetDimmed()Set the property Dimmed to its default value.voidresetEnabled()Set the property Enabled to its default value.voidresetFlags()Set the property Flags to its default value.voidresetIgnorePointAttributes()Set the property IgnorePointAttributes to its default value.voidresetSpeed()Set the property Speed to its default value.voidsetDimmed(boolean value)Gets or sets a value indicating whether the non-selected series will dim (in color) when a series is highlighted.voidsetEnabled(boolean value)Gets or sets a value indicating whether the highlighting feature will be enabled in the chart.voidsetIgnorePointAttributes(boolean value)Allows you to modify the highlighting behavior for the chart points.voidsetSpeed(HighlightSpeed value)Gets or sets a value indicating the time delay before action is taken to show the highlighted state of a series.
-
-
-
Constructor Detail
-
HighlightAttributes
public HighlightAttributes()
Constructs a newly allocated HighlightAttributes object
-
-
Method Detail
-
isDimmed
public boolean isDimmed()
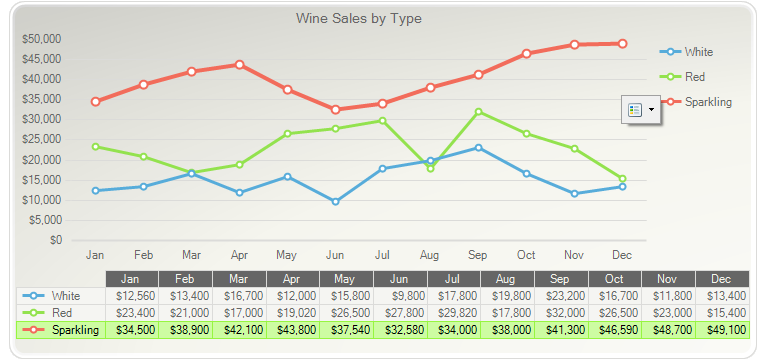
Gets or sets a value indicating whether the non-selected series will dim (in color) when a series is highlighted.
PopulateProductSales(chart1);
chart1.getDataGrid().setVisible(true);
chart1.getHighlight().setDimmed(false);
chart1.getTitles().add(new TitleDockable("Wine Sales by Type"));
chart1.getAxisY().getLabelsFormat().setFormat(AxisFormat.CURRENCY);
public static void PopulateProductSales(Chart chart1) { ProductSales[] data = new ProductSales[]{ new ProductSales("Jan", 12560, 23400, 34500), new ProductSales("Feb", 13400, 21000, 38900), new ProductSales("Mar", 16700, 17000, 42100), new ProductSales("Apr", 12000, 19020, 43800), new ProductSales("May", 15800, 26500, 37540), new ProductSales("Jun", 9800, 27800, 32580), new ProductSales("Jul", 17800, 29820, 34000), new ProductSales("Aug", 19800, 17800, 38000), new ProductSales("Sep", 23200, 32000, 41300), new ProductSales("Oct", 16700, 26500, 46590), new ProductSales("Nov", 11800, 23000, 48700), new ProductSales("Dec", 13400, 15400, 49100) }; ObjectProvider objProvider = new ObjectProvider(data); chart1.getDataSourceSettings().setDataSource(objProvider); }public static class ProductSales { public ProductSales(String month, double white, double red, double sparkling) { this.setMonth(month); this.setWhite(white); this.setRed(red); this.setSparkling(sparkling); } private String privateMonth; public final String getMonth() { return privateMonth; } public final void setMonth(String value) { privateMonth = value; } private double privateWhite; public final double getWhite() { return privateWhite; } public final void setWhite(double value) { privateWhite = value; } private double privateRed; public final double getRed() { return privateRed; } public final void setRed(double value) { privateRed = value; } private double privateSparkling; public final double getSparkling() { return privateSparkling; } public final void setSparkling(double value) { privateSparkling = value; } }
- See Also:
resetDimmed
-
setDimmed
public void setDimmed(boolean value)
Gets or sets a value indicating whether the non-selected series will dim (in color) when a series is highlighted.
PopulateProductSales(chart1);
chart1.getDataGrid().setVisible(true);
chart1.getHighlight().setDimmed(false);
chart1.getTitles().add(new TitleDockable("Wine Sales by Type"));
chart1.getAxisY().getLabelsFormat().setFormat(AxisFormat.CURRENCY);
public static void PopulateProductSales(Chart chart1) { ProductSales[] data = new ProductSales[]{ new ProductSales("Jan", 12560, 23400, 34500), new ProductSales("Feb", 13400, 21000, 38900), new ProductSales("Mar", 16700, 17000, 42100), new ProductSales("Apr", 12000, 19020, 43800), new ProductSales("May", 15800, 26500, 37540), new ProductSales("Jun", 9800, 27800, 32580), new ProductSales("Jul", 17800, 29820, 34000), new ProductSales("Aug", 19800, 17800, 38000), new ProductSales("Sep", 23200, 32000, 41300), new ProductSales("Oct", 16700, 26500, 46590), new ProductSales("Nov", 11800, 23000, 48700), new ProductSales("Dec", 13400, 15400, 49100) }; ObjectProvider objProvider = new ObjectProvider(data); chart1.getDataSourceSettings().setDataSource(objProvider); }public static class ProductSales { public ProductSales(String month, double white, double red, double sparkling) { this.setMonth(month); this.setWhite(white); this.setRed(red); this.setSparkling(sparkling); } private String privateMonth; public final String getMonth() { return privateMonth; } public final void setMonth(String value) { privateMonth = value; } private double privateWhite; public final double getWhite() { return privateWhite; } public final void setWhite(double value) { privateWhite = value; } private double privateRed; public final double getRed() { return privateRed; } public final void setRed(double value) { privateRed = value; } private double privateSparkling; public final double getSparkling() { return privateSparkling; } public final void setSparkling(double value) { privateSparkling = value; } }
- Parameters:
value-- See Also:
resetDimmed
-
isEnabled
public boolean isEnabled()
Gets or sets a value indicating whether the highlighting feature will be enabled in the chart.
Setting this value to false will disable the highlighting feature and the Highlighting event will not be raised.
To disable the highlighting feature:
chart1.getHighlight().setEnabled(false);
- See Also:
resetEnabled
-
setEnabled
public void setEnabled(boolean value)
Gets or sets a value indicating whether the highlighting feature will be enabled in the chart.
Setting this value to false will disable the highlighting feature and the Highlighting event will not be raised.
To disable the highlighting feature:
chart1.getHighlight().setEnabled(false);
- Parameters:
value-- See Also:
resetEnabled
-
isIgnorePointAttributes
public boolean isIgnorePointAttributes()
Allows you to modify the highlighting behavior for the chart points.- See Also:
resetIgnorePointAttributes
-
setIgnorePointAttributes
public void setIgnorePointAttributes(boolean value)
Allows you to modify the highlighting behavior for the chart points.- Parameters:
value-- See Also:
resetIgnorePointAttributes
-
getPointAttributes
public PointAttributes getPointAttributes()
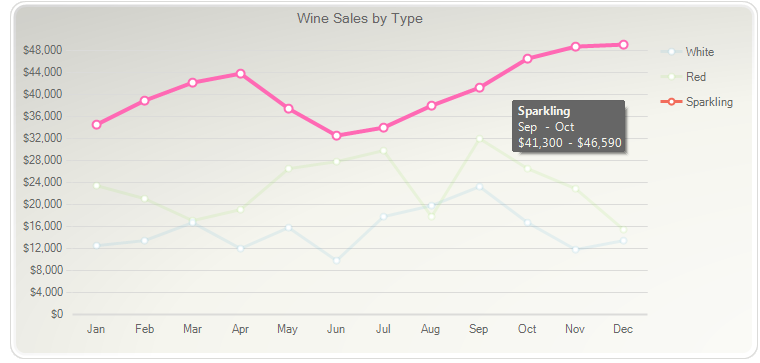
Returns the PointAttributes object for a highlighted series.
PopulateProductSales(chart1);
chart1.getHighlight().getPointAttributes().setColor(new java.awt.Color(255,105,180,255));
chart1.getTitles().add(new TitleDockable("Wine Sales by Type"));
chart1.getAxisY().getLabelsFormat().setFormat(AxisFormat.CURRENCY);
public static void PopulateProductSales(Chart chart1) { ProductSales[] data = new ProductSales[]{ new ProductSales("Jan", 12560, 23400, 34500), new ProductSales("Feb", 13400, 21000, 38900), new ProductSales("Mar", 16700, 17000, 42100), new ProductSales("Apr", 12000, 19020, 43800), new ProductSales("May", 15800, 26500, 37540), new ProductSales("Jun", 9800, 27800, 32580), new ProductSales("Jul", 17800, 29820, 34000), new ProductSales("Aug", 19800, 17800, 38000), new ProductSales("Sep", 23200, 32000, 41300), new ProductSales("Oct", 16700, 26500, 46590), new ProductSales("Nov", 11800, 23000, 48700), new ProductSales("Dec", 13400, 15400, 49100) }; ObjectProvider objProvider = new ObjectProvider(data); chart1.getDataSourceSettings().setDataSource(objProvider); }public static class ProductSales { public ProductSales(String month, double white, double red, double sparkling) { this.setMonth(month); this.setWhite(white); this.setRed(red); this.setSparkling(sparkling); } private String privateMonth; public final String getMonth() { return privateMonth; } public final void setMonth(String value) { privateMonth = value; } private double privateWhite; public final double getWhite() { return privateWhite; } public final void setWhite(double value) { privateWhite = value; } private double privateRed; public final double getRed() { return privateRed; } public final void setRed(double value) { privateRed = value; } private double privateSparkling; public final double getSparkling() { return privateSparkling; } public final void setSparkling(double value) { privateSparkling = value; } }
-
getSpeed
public HighlightSpeed getSpeed()
Gets or sets a value indicating the time delay before action is taken to show the highlighted state of a series.chart1.getHighlight().setSpeed(highlightSpeed.FAST);
- See Also:
resetSpeed
-
setSpeed
public void setSpeed(HighlightSpeed value)
Gets or sets a value indicating the time delay before action is taken to show the highlighted state of a series.chart1.getHighlight().setSpeed(highlightSpeed.FAST);
- Parameters:
value-- See Also:
resetSpeed
-
clearHighlight
public void clearHighlight(java.lang.Object sender)
Remove any highlighting applied to the chart.When a chart element is highlighted, other chart tools such as the
setDataGridand thesetLegendBoxmay be affected. This method removes any highlighting applied to these tools as well.To clear any highlighting applied to the chart:
chart1.getHighlight().clearHighlight((this));
- Parameters:
sender- that is the source of the event.
-
highlightItem
public void highlightItem(java.lang.Object item)
Highlights a selected chart element.
This method may be used to highlight a selected chart element. In order to highlight a chart element, you must pass as a parameter the chart element that you wish to highlight.
When a chart element is highlighted, other chart tools such as the data grid and legends may be affected.
To force highlighting of Series 1:
SeriesAttributes mySeries;
mySeries = chart1.getSeries().get(1);
chart1.getHighlight().highlightItem((mySeries));
- Parameters:
item- The item to be highlighted
-
resetDimmed
public void resetDimmed()
Set the property Dimmed to its default value.- See Also:
isDimmed
-
resetEnabled
public void resetEnabled()
Set the property Enabled to its default value.- See Also:
isEnabled
-
resetFlags
public void resetFlags()
Set the property Flags to its default value.
-
resetIgnorePointAttributes
public void resetIgnorePointAttributes()
Set the property IgnorePointAttributes to its default value.- See Also:
isIgnorePointAttributes
-
resetSpeed
public void resetSpeed()
Set the property Speed to its default value.- See Also:
setSpeed
-
-