- java.lang.Object
-
- com.softwarefx.chartfx.server.AxisSectionBase
-
- com.softwarefx.chartfx.server.Axis
-
- com.softwarefx.chartfx.server.AxisY
-
public final class AxisY
extends Axis
This class provides a shortcut to the Chart's main Axis Y object.
This class provides a shortcut to the Chart's main Axis Y object.
-
-
Nested Class Summary
-
Nested classes/interfaces inherited from class com.softwarefx.chartfx.server.Axis
Axis.GetScrollViewArgs, Axis.SetLabelLayoutDelegateListener
-
-
Constructor Summary
Constructors Constructor and Description AxisY()Constructs a newly allocated AxisY objectAxisY(int index)Constructs a newly allocated AxisY object
-
Method Summary
Methods Modifier and Type Method and Description AxisScalegetMainScale()Allows you to access several properties associated with the scale of the Y-Axis.PanegetPane()Gets or sets an integer value specifying the Pane for a Y Axis object.java.util.List<AxisScale>getScales()Allows you access the Scales collection in order to create axis breaks.booleanshouldSerializeScales()Description goes here-
Methods inherited from class com.softwarefx.chartfx.server.Axis
adjustScale, getBaseline, getCustomGridLines, getCustomSteps, getDataFormat, getFirstLabel, getFont, getKeyLabels, getLabelAngle, getLabels, getLabelsFormat, getLabelTrimming, getLabelValue, getLabelValueDateTime, getLabelValueDouble, getLabelValueTimeSpan, getLine, getLineSpacing, getLogBase, getMarginFromMax, getMarginFromMin, getMax, getMaxDateTime, getMaxDouble, getMaxSizePercentage, getMaxTimeSpan, getMin, getMinDateTime, getMinDouble, getMinorStep, getMinorStepDateTime, getMinorStepDouble, getMinorStepTimeSpan, getMinTimeSpan, getPixelsPerUnit, getPosition, getScaleUnit, getScaleUnitDateTime, getScaleUnitDouble, getScaleUnitTimeSpan, getScrollPosition, getScrollPositionPercentage, getScrollPositionPixel, getScrollSize, getScrollView, getScrollViewMax, getScrollViewMaxDateTime, getScrollViewMaxDouble, getScrollViewMaxTimeSpan, getScrollViewMin, getScrollViewMinDateTime, getScrollViewMinDouble, getScrollViewMinTimeSpan, getSections, getSeparation, getStep, getStepDateTime, getStepDouble, getStepTimeSpan, getStyle, getTitle, isAutoScale, isAutoScroll, isForceBaseline, isForceZero, isHorizontal, isInverted, isNotify, isStaggered, isVisible, pixelToValue, resetBaseline, resetFont, resetForceBaseline, resetInverted, resetLabelAngle, resetLabelTrimming, resetLineSpacing, resetMarginFromMax, resetMarginFromMin, resetMax, resetMaxSizePercentage, resetMin, resetNotify, resetPixelsPerUnit, resetPosition, resetScale, resetScale, resetScrollPositionPixel, resetSeparation, resetStaggered, resetStyle, resetTotalSizeInPixels, resetVisible, resetZoomed, setAutoScale, setAutoScroll, setBaseline, setCustomSteps, setFirstLabel, setFont, setForceBaseline, setForceZero, setInverted, setLabelAngle, setLabelTrimming, setLabelValue, setLabelValue, setLabelValue, setLabelValue, setLineSpacing, setLogBase, setMarginFromMax, setMarginFromMin, setMax, setMax, setMax, setMax, setMaxSizePercentage, setMin, setMin, setMin, setMin, setMinorStep, setMinorStep, setMinorStep, setMinorStep, setNotify, setPixelsPerUnit, setPosition, setScaleUnit, setScaleUnit, setScaleUnit, setScaleUnit, setScrollPosition, setScrollPositionPercentage, setScrollPositionPixel, setScrollView, setScrollView, setScrollView, setScrollView, setSeparation, setStaggered, setStep, setStep, setStep, setStep, setStyle, setTitle, setVisible, valueToPixel, valueToPixel, valueToPixel, valueToPixel, zoom, zoom, zoom, zoom, zoomOff
-
Methods inherited from class com.softwarefx.chartfx.server.AxisSectionBase
getGrids, getLink, getTextColor, resetTextColor, setTextColor
-
-
-
-
Constructor Detail
-
AxisY
public AxisY()
Constructs a newly allocated AxisY object
-
AxisY
public AxisY(int index)
Constructs a newly allocated AxisY object- Parameters:
index-
-
-
Method Detail
-
getMainScale
public AxisScale getMainScale()
Allows you to access several properties associated with the scale of the Y-Axis.
-
getPane
public Pane getPane()
Gets or sets an integer value specifying the Pane for a Y Axis object.
Additional Y axes may be assigned to panes in a chart. Once a Y axis object is assigned to a pane, that pane will be visible in the chart area. Data also associated with the selected Y axis will also be applied to the configured pane.
Use the
setPanesmethod to customize the attributes for a selected pane. This method exposes all the supported members of theAxisYclass.To set the Y axis Pane
setBackColormethod to gray: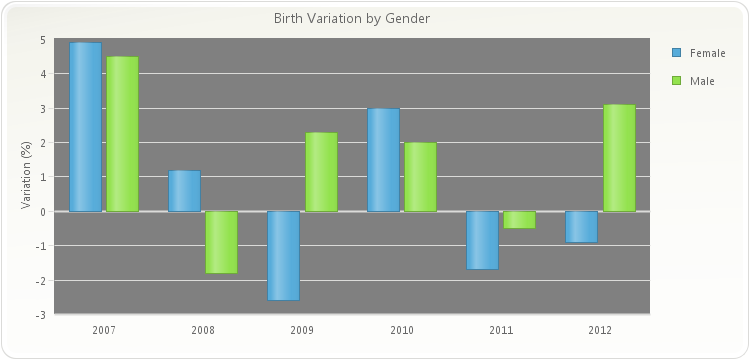
chart1.setGallery(Gallery.BAR);
PopulateBirthVariation(chart1);
chart1.getTitles().add(new TitleDockable("Birth Variation by Gender"));
chart1.getAxisY().getTitle().setText("Variation (%)");
chart1.getAxisY().getPane().setBackColor(new java.awt.Color(128,128,128,255));
public static void PopulateBirthVariation(Chart chart1) { BirthVariation[] variations = new BirthVariation[] { new BirthVariation("2007", 4.5, 4.9 ), new BirthVariation("2008", -1.8, 1.2 ), new BirthVariation("2009", 2.3, -2.6 ), new BirthVariation("2010", 2.0, 3.0), new BirthVariation("2011", -0.5, -1.7 ), new BirthVariation("2012", 3.1, -0.9 ) }; ObjectProvider objProvider = new ObjectProvider(variations); chart1.getDataSourceSettings().setDataSource(objProvider); }public static class BirthVariation { public BirthVariation(String year, double male, double female) { this.setYear(year); this.setMale(male); this.setFemale(female); } private String privateYear; public final String getYear() { return privateYear; } public final void setYear(String value) { privateYear = value; } private double privateMale; public final double getMale() { return privateMale; } public final void setMale(double value) { privateMale = value; } private double privateFemale; public final double getFemale() { return privateFemale; } public final void setFemale(double value) { privateFemale = value; } }
-
getScales
public java.util.List<AxisScale> getScales()
Allows you access the Scales collection in order to create axis breaks.
-
shouldSerializeScales
public boolean shouldSerializeScales()
Description goes here
-
-