- java.lang.Object
-
- com.softwarefx.chartfx.server.AxisSectionBase
-
- Direct Known Subclasses:
- Axis, AxisSection
public class AxisSectionBase
extends java.lang.Object
Provides access to AxisSectionBase, which is the base class for both Axis and AxisSection.
This Base class is not intended to be used directly by the programmer; however, derived classes can be used for axis customization. For example, the
Axisclass is derived from the AxisSectionBase and its members are accessible through the use of thesetAxisXandsetAxisYmethods. Furthermore, AxisSectionBase is the based class whichAxisSectionis derived from.The members of
AxisSectionBaseclass are used to customize theGrids,setTextColor, and URL of the related Axis and AxisSection.
-
-
Constructor Summary
Constructors Constructor and Description AxisSectionBase()
-
Method Summary
Methods Modifier and Type Method and Description GridsgetGrids()Allows customization of grid lines by providing access to the supported members of the Grids class.com.softwarefx.server.LinkgetLink()Gets the Link object for a selected BaseAxisSection item.java.awt.ColorgetTextColor()Gets or sets the color for text of a selected BaseAxisSection object.voidresetTextColor()Set the property TextColor to its default value.voidsetTextColor(java.awt.Color value)Gets or sets the color for text of a selected BaseAxisSection object.
-
-
-
Method Detail
-
getGrids
public Grids getGrids()
Allows customization of grid lines by providing access to the supported members of the Grids class.
PopulateCarProduction(chart1);
chart1.getTitles().add(new TitleDockable("Vehicles Production by Type"));
chart1.getAxisY().setMinorStep(150);
chart1.getAxisY().getGrids().getMajor().setColor(new java.awt.Color(128,128,128,255));
chart1.getAxisY().getGrids().getMinor().setVisible(true);
chart1.getAxisY().getGrids().getMinor().setStyle(DashStyle.DOT);
chart1.getAxisY().getGrids().getMinor().setColor(new java.awt.Color(95,158,160,255));
public static void PopulateCarProduction(Chart chart1) { CarProduction[] production = new CarProduction[] { new CarProduction("Jan", 1760, 535, 695 ) , new CarProduction("Feb", 1849, 395, 688 ) , new CarProduction("Mar", 2831, 685, 1047 ) , new CarProduction("Apr", 2851, 984, 1652 ) , new CarProduction("May", 2961, 1579, 1889 ) , new CarProduction("Jun", 1519, 1539, 1766 ) , new CarProduction("Jul", 2633, 1489, 1361 ) , new CarProduction("Aug", 1140, 650, 874 ) , new CarProduction("Sep", 1626, 653, 693 ) , new CarProduction("Oct", 1478, 2236, 786 ) , new CarProduction("Nov", 1306, 1937, 599 ) , new CarProduction("Dec", 1607, 2138, 678 ) }; ObjectProvider objProvider = new ObjectProvider(production); chart1.getDataSourceSettings().setDataSource(objProvider); }public static class CarProduction { private CarProduction(String month, int sedan, int coupe, int SUV) { this.setMonth(month); this.setSedan(sedan); this.setCoupe(coupe); this.setSUV(SUV); } private String privateMonth; public final String getMonth() { return privateMonth; } public final void setMonth(String value) { privateMonth = value; } private int privateSedan; public final int getSedan() { return privateSedan; } public final void setSedan(int value) { privateSedan = value; } private int privateCoupe; public final int getCoupe() { return privateCoupe; } public final void setCoupe(int value) { privateCoupe = value; } private int privateSUV; public final int getSUV() { return privateSUV; } public final void setSUV(int value) { privateSUV = value; } }
-
getLink
public com.softwarefx.server.Link getLink()
Gets the Link object for a selected BaseAxisSection item.SoftwareFX.WebForms.Link axisSectLink; axisSectLink = chart1.getAxisY().getSections().get(0).getLink();
-
getTextColor
public java.awt.Color getTextColor()
Gets or sets the color for text of a selected BaseAxisSection object.
The
setTextColormethod is used to set a color for the specified AxisSection labels. Please refer to thesetTextColormethod of the Title object to customize the color for the axis title.For more information regarding the Color type, please refer to the Java documentation.
Below, the Y axis section text color is set to red:
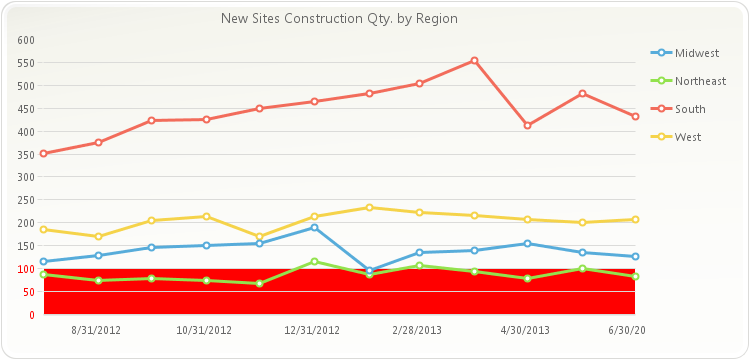
PopulateNewConstructions(chart1);
chart1.getTitles().add(new TitleDockable("New Sites Construction Qty. by Region"));
AxisSection sect;
sect = new AxisSection();
sect.setAdjustable(false);
sect.setFrom(0);
sect.setTo(100);
sect.setBackColor(new java.awt.Color(255,0,0,255));
chart1.getAxisY().getSections().add(sect);
chart1.getAxisY().getSections().get(0).setTextColor(new java.awt.Color(255,0,0,255));
public static void PopulateNewConstructions(Chart chart1) { NewConstructions[] data = new NewConstructions[] { new NewConstructions(new java.util.GregorianCalendar(2012, 7, 1).getTime(), 88, 116, 351, 186 ), new NewConstructions(new java.util.GregorianCalendar(2012, 8, 1).getTime(), 75, 128, 376, 170 ), new NewConstructions(new java.util.GregorianCalendar(2012, 9, 1).getTime(), 79, 147, 424, 204 ), new NewConstructions(new java.util.GregorianCalendar(2012, 10, 1).getTime(), 75, 151, 425, 213 ), new NewConstructions(new java.util.GregorianCalendar(2012, 11, 1).getTime(), 68, 154, 449, 171 ), new NewConstructions(new java.util.GregorianCalendar(2012, 12, 1).getTime(), 115, 190, 465, 213 ), new NewConstructions(new java.util.GregorianCalendar(2013, 1, 1).getTime(), 87, 95, 483, 233 ), new NewConstructions(new java.util.GregorianCalendar(2013, 2, 1).getTime(), 106, 135, 505, 223 ), new NewConstructions(new java.util.GregorianCalendar(2013, 3, 1).getTime(), 94, 140, 554, 217 ), new NewConstructions(new java.util.GregorianCalendar(2013, 4, 1).getTime(), 79, 154, 412, 207 ), new NewConstructions(new java.util.GregorianCalendar(2013, 5, 1).getTime(), 101, 135, 482, 201 ), new NewConstructions(new java.util.GregorianCalendar(2013, 6, 1).getTime(), 82, 126, 431, 207 ) }; ObjectProvider objProvider = new ObjectProvider(data); chart1.getDataSourceSettings().setDataSource(objProvider); }public static class NewConstructions { public NewConstructions(java.util.Date date, double northeast, double midwest, double south, double west) { this.setDate(date); this.setNortheast(northeast); this.setMidwest(midwest); this.setSouth(south); this.setWest(west); } private java.util.Date privateDate = new java.util.Date(0); public final java.util.Date getDate() { return privateDate; } public final void setDate(java.util.Date value) { privateDate = value; } private double privateNortheast; public final double getNortheast() { return privateNortheast; } public final void setNortheast(double value) { privateNortheast = value; } private double privateMidwest; public final double getMidwest() { return privateMidwest; } public final void setMidwest(double value) { privateMidwest = value; } private double privateSouth; public final double getSouth() { return privateSouth; } public final void setSouth(double value) { privateSouth = value; } private double privateWest; public final double getWest() { return privateWest; } public final void setWest(double value) { privateWest = value; } }
- See Also:
resetTextColor
-
setTextColor
public void setTextColor(java.awt.Color value)
Gets or sets the color for text of a selected BaseAxisSection object.
The
setTextColormethod is used to set a color for the specified AxisSection labels. Please refer to thesetTextColormethod of the Title object to customize the color for the axis title.For more information regarding the Color type, please refer to the Java documentation.
Below, the Y axis section text color is set to red:
PopulateNewConstructions(chart1);
chart1.getTitles().add(new TitleDockable("New Sites Construction Qty. by Region"));
AxisSection sect;
sect = new AxisSection();
sect.setAdjustable(false);
sect.setFrom(0);
sect.setTo(100);
sect.setBackColor(new java.awt.Color(255,0,0,255));
chart1.getAxisY().getSections().add(sect);
chart1.getAxisY().getSections().get(0).setTextColor(new java.awt.Color(255,0,0,255));
public static void PopulateNewConstructions(Chart chart1) { NewConstructions[] data = new NewConstructions[] { new NewConstructions(new java.util.GregorianCalendar(2012, 7, 1).getTime(), 88, 116, 351, 186 ), new NewConstructions(new java.util.GregorianCalendar(2012, 8, 1).getTime(), 75, 128, 376, 170 ), new NewConstructions(new java.util.GregorianCalendar(2012, 9, 1).getTime(), 79, 147, 424, 204 ), new NewConstructions(new java.util.GregorianCalendar(2012, 10, 1).getTime(), 75, 151, 425, 213 ), new NewConstructions(new java.util.GregorianCalendar(2012, 11, 1).getTime(), 68, 154, 449, 171 ), new NewConstructions(new java.util.GregorianCalendar(2012, 12, 1).getTime(), 115, 190, 465, 213 ), new NewConstructions(new java.util.GregorianCalendar(2013, 1, 1).getTime(), 87, 95, 483, 233 ), new NewConstructions(new java.util.GregorianCalendar(2013, 2, 1).getTime(), 106, 135, 505, 223 ), new NewConstructions(new java.util.GregorianCalendar(2013, 3, 1).getTime(), 94, 140, 554, 217 ), new NewConstructions(new java.util.GregorianCalendar(2013, 4, 1).getTime(), 79, 154, 412, 207 ), new NewConstructions(new java.util.GregorianCalendar(2013, 5, 1).getTime(), 101, 135, 482, 201 ), new NewConstructions(new java.util.GregorianCalendar(2013, 6, 1).getTime(), 82, 126, 431, 207 ) }; ObjectProvider objProvider = new ObjectProvider(data); chart1.getDataSourceSettings().setDataSource(objProvider); }public static class NewConstructions { public NewConstructions(java.util.Date date, double northeast, double midwest, double south, double west) { this.setDate(date); this.setNortheast(northeast); this.setMidwest(midwest); this.setSouth(south); this.setWest(west); } private java.util.Date privateDate = new java.util.Date(0); public final java.util.Date getDate() { return privateDate; } public final void setDate(java.util.Date value) { privateDate = value; } private double privateNortheast; public final double getNortheast() { return privateNortheast; } public final void setNortheast(double value) { privateNortheast = value; } private double privateMidwest; public final double getMidwest() { return privateMidwest; } public final void setMidwest(double value) { privateMidwest = value; } private double privateSouth; public final double getSouth() { return privateSouth; } public final void setSouth(double value) { privateSouth = value; } private double privateWest; public final double getWest() { return privateWest; } public final void setWest(double value) { privateWest = value; } }
- Parameters:
value-- See Also:
resetTextColor
-
resetTextColor
public void resetTextColor()
Set the property TextColor to its default value.- See Also:
setTextColor
-
-