- java.lang.Object
-
- com.softwarefx.chartfx.server.AxisSectionBase
-
- com.softwarefx.chartfx.server.AxisSection
-
public class AxisSection
extends AxisSectionBase
Provides access to the AxisSection object.
This class is used to customize the axis sections of a chart. By creating axis sections, the developer can assign specific visual attributes to the newly created sections. By allowing this customization, developers can focus the end user's attention on particular values in the chart, or display additional details.
The Axis Section implementation is another analytical feature embedded into Chart FX. Utilizing this object in your charting applications allows end users to quickly identify focus areas of a chart and determine whether values fall into this range. This enhancement makes data driven charts more pleasing to the eye and easily deciphered by users.
The
setSectionsmethod returns the AxisSection object which may be configured using the AxisSection andAxisSectionBaseclass members.The
setFrommethod is used to specify the beginning value of the section range for a selected AxisSection object. ThesetTomethod is used to specify the ending value of the section range for a selected AxisSection object.The
setFontStylemethod is used to configure additional font attributes for the selected axis section.PopulateCarProduction(chart1); chart1.getTitles().add(new TitleDockable("Monthly Vehicles Production by Category")); chart1.getAxisY().getTitle().setText("Number of Vehicles Manufactured"); AxisSection section; section = new AxisSection(); chart1.getAxisY().getSections().add(section); section.setBackColor(new java.awt.Color( 255, 0, 0,64)); section.setFontStyle(FontStyle.BOLD); section.setFrom(0); section.setTo(1000); section.getGrids().getMajor().setVisible(false); section.setTextColor(new java.awt.Color(255,0,0,255)); section.getTitle().setText("Low Production"); section = new AxisSection(); chart1.getAxisY().getSections().add(section); section.setBackColor(new java.awt.Color( 255, 255, 0,64)); section.setFrom(1000); section.setTo(2000); section.getGrids().getMajor().setVisible(false); section.setTextColor(new java.awt.Color(255,140,0,255)); section.getTitle().setText("Acceptable Levels"); section = new AxisSection(); chart1.getAxisY().getSections().add(section); section.setBackColor(new java.awt.Color( 0, 255, 0,64)); section.setFrom(2000); section.setTo(3000); section.getGrids().getMajor().setVisible(true); section.setTextColor(new java.awt.Color(0,128,0,255)); section.getTitle().setText("Optimum Production"); /* This line is required to avoid showing the sections on the legend box. Any section with a title will *\/ /* appear by default on the legend box *\/ chart1.getLegendBox().getItemAttributes().get(((ILegendBoxItemCollection)chart1.getAxisY().getSections())).setVisible(false);public static void PopulateCarProduction(Chart chart1) { CarProduction[] production = new CarProduction[] { new CarProduction("Jan", 1760, 535, 695 ) , new CarProduction("Feb", 1849, 395, 688 ) , new CarProduction("Mar", 2831, 685, 1047 ) , new CarProduction("Apr", 2851, 984, 1652 ) , new CarProduction("May", 2961, 1579, 1889 ) , new CarProduction("Jun", 1519, 1539, 1766 ) , new CarProduction("Jul", 2633, 1489, 1361 ) , new CarProduction("Aug", 1140, 650, 874 ) , new CarProduction("Sep", 1626, 653, 693 ) , new CarProduction("Oct", 1478, 2236, 786 ) , new CarProduction("Nov", 1306, 1937, 599 ) , new CarProduction("Dec", 1607, 2138, 678 ) }; ObjectProvider objProvider = new ObjectProvider(production); chart1.getDataSourceSettings().setDataSource(objProvider); }public static class CarProduction { private CarProduction(String month, int sedan, int coupe, int SUV) { this.setMonth(month); this.setSedan(sedan); this.setCoupe(coupe); this.setSUV(SUV); } private String privateMonth; public final String getMonth() { return privateMonth; } public final void setMonth(String value) { privateMonth = value; } private int privateSedan; public final int getSedan() { return privateSedan; } public final void setSedan(int value) { privateSedan = value; } private int privateCoupe; public final int getCoupe() { return privateCoupe; } public final void setCoupe(int value) { privateCoupe = value; } private int privateSUV; public final int getSUV() { return privateSUV; } public final void setSUV(int value) { privateSUV = value; } }
-
-
Constructor Summary
Constructors Constructor and Description AxisSection()Constructs a newly allocated AxisSection objectAxisSection(AxisSectionCalculation from, AxisSectionCalculation to, java.awt.Color backColor)Constructs a newly allocated AxisSection objectAxisSection(AxisSectionValue from, AxisSectionValue to, java.awt.Color backColor)Constructs a newly allocated AxisSection objectAxisSection(double from, double to, java.awt.Color backColor)Constructs a newly allocated AxisSection object
-
Method Summary
Methods Modifier and Type Method and Description java.awt.ColorgetBackColor()Gets or sets the AxisSection background color.java.util.EnumSet<FontStyle>getFontStyle()Gets or sets additional font attributes to the axis section.AxisSectionValuegetFrom()Gets or sets a value indicating the beginning value of the range for a selected AxisSection object.doublegetFromDouble()Gets or sets a value indicating the beginning value of the range for a selected AxisSection object.AxisSectionHighlightAttributesgetHighlight()Allows to highlight the selected axis section.intgetPoint()Description goes hereSeriesReferencegetSeries()Gets or sets a value indicating the series an AxisSection is associated with.java.lang.StringgetText()Description goes hereTitlegetTitle()Used to set a title for the selected axis sectionAxisSectionValuegetTo()Gets or sets a value indicating the ending value of the range for a selected AxisSection object.doublegetToDouble()Gets or sets a value indicating the ending value of the range for a selected AxisSection object.booleanisAdjustable()Allows to move the selected axis section using the mouse.booleanisVisible()Shows or hides the selected axis section.voidresetAdjustable()Set the property Adjustable to its default value.voidresetBackColor()Set the property BackColor to its default value.voidresetFontStyle()Set the property FontStyle to its default value.voidresetVisible()Set the property Visible to its default value.voidsetAdjustable(boolean value)Allows to move the selected axis section using the mouse.voidsetBackColor(java.awt.Color value)Gets or sets the AxisSection background color.voidsetFontStyle(java.util.EnumSet<FontStyle> value)Gets or sets additional font attributes to the axis section.voidsetFrom(AxisSectionCalculation value)Gets or sets a value indicating the beginning value of the range for a selected AxisSection object.voidsetFrom(AxisSectionValue value)Gets or sets a value indicating the beginning value of the range for a selected AxisSection object.voidsetFrom(double value)Gets or sets a value indicating the beginning value of the range for a selected AxisSection object.voidsetPoint(int value)Description goes herevoidsetText(java.lang.String value)Description goes herevoidsetTo(AxisSectionCalculation value)Gets or sets a value indicating the ending value of the range for a selected AxisSection object.voidsetTo(AxisSectionValue value)Gets or sets a value indicating the ending value of the range for a selected AxisSection object.voidsetTo(double value)Gets or sets a value indicating the ending value of the range for a selected AxisSection object.voidsetVisible(boolean value)Shows or hides the selected axis section.-
Methods inherited from class com.softwarefx.chartfx.server.AxisSectionBase
getGrids, getLink, getTextColor, resetTextColor, setTextColor
-
-
-
-
Constructor Detail
-
AxisSection
public AxisSection()
Constructs a newly allocated AxisSection object
-
AxisSection
public AxisSection(AxisSectionCalculation from,
           AxisSectionCalculation to,
           java.awt.Color backColor)
Constructs a newly allocated AxisSection object- Parameters:
from-to-backColor-
-
AxisSection
public AxisSection(AxisSectionValue from,
           AxisSectionValue to,
           java.awt.Color backColor)
Constructs a newly allocated AxisSection object- Parameters:
from-to-backColor-
-
AxisSection
public AxisSection(double from,
           double to,
           java.awt.Color backColor)
Constructs a newly allocated AxisSection object- Parameters:
from-to-backColor-
-
-
Method Detail
-
isAdjustable
public boolean isAdjustable()
Allows to move the selected axis section using the mouse.AxisSection sect; sect = new AxisSection(((AxisSectionValue)0.0), ((AxisSectionValue)100.0), new java.awt.Color(255,0,0,255)); sect.setAdjustable(true); chart1.getAxisY().getSections().add(sect);
- See Also:
resetAdjustable
-
setAdjustable
public void setAdjustable(boolean value)
Allows to move the selected axis section using the mouse.AxisSection sect; sect = new AxisSection(((AxisSectionValue)0.0), ((AxisSectionValue)100.0), new java.awt.Color(255,0,0,255)); sect.setAdjustable(true); chart1.getAxisY().getSections().add(sect);
- Parameters:
value-- See Also:
resetAdjustable
-
getBackColor
public java.awt.Color getBackColor()
Gets or sets the AxisSection background color.
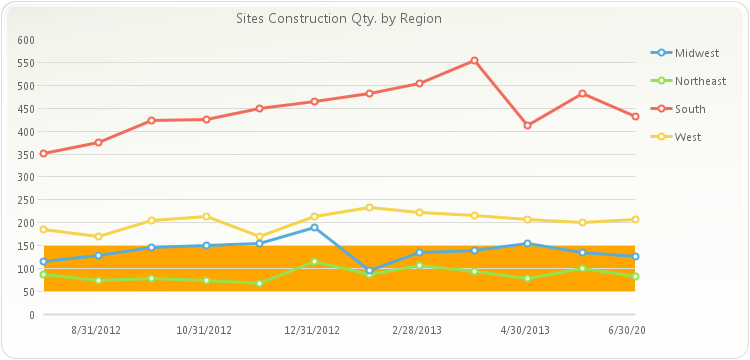
PopulateNewConstructions(chart1);
chart1.getTitles().add(new TitleDockable("Sites Construction Qty. by Region"));
AxisSection sect;
sect = new AxisSection();
sect.setAdjustable(false);
sect.setFrom(50);
sect.setTo(150);
sect.setBackColor(new java.awt.Color(255,165,0,255));
chart1.getAxisY().getSections().add(sect);
public static void PopulateNewConstructions(Chart chart1) { NewConstructions[] data = new NewConstructions[] { new NewConstructions(new java.util.GregorianCalendar(2012, 7, 1).getTime(), 88, 116, 351, 186 ), new NewConstructions(new java.util.GregorianCalendar(2012, 8, 1).getTime(), 75, 128, 376, 170 ), new NewConstructions(new java.util.GregorianCalendar(2012, 9, 1).getTime(), 79, 147, 424, 204 ), new NewConstructions(new java.util.GregorianCalendar(2012, 10, 1).getTime(), 75, 151, 425, 213 ), new NewConstructions(new java.util.GregorianCalendar(2012, 11, 1).getTime(), 68, 154, 449, 171 ), new NewConstructions(new java.util.GregorianCalendar(2012, 12, 1).getTime(), 115, 190, 465, 213 ), new NewConstructions(new java.util.GregorianCalendar(2013, 1, 1).getTime(), 87, 95, 483, 233 ), new NewConstructions(new java.util.GregorianCalendar(2013, 2, 1).getTime(), 106, 135, 505, 223 ), new NewConstructions(new java.util.GregorianCalendar(2013, 3, 1).getTime(), 94, 140, 554, 217 ), new NewConstructions(new java.util.GregorianCalendar(2013, 4, 1).getTime(), 79, 154, 412, 207 ), new NewConstructions(new java.util.GregorianCalendar(2013, 5, 1).getTime(), 101, 135, 482, 201 ), new NewConstructions(new java.util.GregorianCalendar(2013, 6, 1).getTime(), 82, 126, 431, 207 ) }; ObjectProvider objProvider = new ObjectProvider(data); chart1.getDataSourceSettings().setDataSource(objProvider); }public static class NewConstructions { public NewConstructions(java.util.Date date, double northeast, double midwest, double south, double west) { this.setDate(date); this.setNortheast(northeast); this.setMidwest(midwest); this.setSouth(south); this.setWest(west); } private java.util.Date privateDate = new java.util.Date(0); public final java.util.Date getDate() { return privateDate; } public final void setDate(java.util.Date value) { privateDate = value; } private double privateNortheast; public final double getNortheast() { return privateNortheast; } public final void setNortheast(double value) { privateNortheast = value; } private double privateMidwest; public final double getMidwest() { return privateMidwest; } public final void setMidwest(double value) { privateMidwest = value; } private double privateSouth; public final double getSouth() { return privateSouth; } public final void setSouth(double value) { privateSouth = value; } private double privateWest; public final double getWest() { return privateWest; } public final void setWest(double value) { privateWest = value; } }
- See Also:
resetBackColor
-
setBackColor
public void setBackColor(java.awt.Color value)
Gets or sets the AxisSection background color.
PopulateNewConstructions(chart1);
chart1.getTitles().add(new TitleDockable("Sites Construction Qty. by Region"));
AxisSection sect;
sect = new AxisSection();
sect.setAdjustable(false);
sect.setFrom(50);
sect.setTo(150);
sect.setBackColor(new java.awt.Color(255,165,0,255));
chart1.getAxisY().getSections().add(sect);
public static void PopulateNewConstructions(Chart chart1) { NewConstructions[] data = new NewConstructions[] { new NewConstructions(new java.util.GregorianCalendar(2012, 7, 1).getTime(), 88, 116, 351, 186 ), new NewConstructions(new java.util.GregorianCalendar(2012, 8, 1).getTime(), 75, 128, 376, 170 ), new NewConstructions(new java.util.GregorianCalendar(2012, 9, 1).getTime(), 79, 147, 424, 204 ), new NewConstructions(new java.util.GregorianCalendar(2012, 10, 1).getTime(), 75, 151, 425, 213 ), new NewConstructions(new java.util.GregorianCalendar(2012, 11, 1).getTime(), 68, 154, 449, 171 ), new NewConstructions(new java.util.GregorianCalendar(2012, 12, 1).getTime(), 115, 190, 465, 213 ), new NewConstructions(new java.util.GregorianCalendar(2013, 1, 1).getTime(), 87, 95, 483, 233 ), new NewConstructions(new java.util.GregorianCalendar(2013, 2, 1).getTime(), 106, 135, 505, 223 ), new NewConstructions(new java.util.GregorianCalendar(2013, 3, 1).getTime(), 94, 140, 554, 217 ), new NewConstructions(new java.util.GregorianCalendar(2013, 4, 1).getTime(), 79, 154, 412, 207 ), new NewConstructions(new java.util.GregorianCalendar(2013, 5, 1).getTime(), 101, 135, 482, 201 ), new NewConstructions(new java.util.GregorianCalendar(2013, 6, 1).getTime(), 82, 126, 431, 207 ) }; ObjectProvider objProvider = new ObjectProvider(data); chart1.getDataSourceSettings().setDataSource(objProvider); }public static class NewConstructions { public NewConstructions(java.util.Date date, double northeast, double midwest, double south, double west) { this.setDate(date); this.setNortheast(northeast); this.setMidwest(midwest); this.setSouth(south); this.setWest(west); } private java.util.Date privateDate = new java.util.Date(0); public final java.util.Date getDate() { return privateDate; } public final void setDate(java.util.Date value) { privateDate = value; } private double privateNortheast; public final double getNortheast() { return privateNortheast; } public final void setNortheast(double value) { privateNortheast = value; } private double privateMidwest; public final double getMidwest() { return privateMidwest; } public final void setMidwest(double value) { privateMidwest = value; } private double privateSouth; public final double getSouth() { return privateSouth; } public final void setSouth(double value) { privateSouth = value; } private double privateWest; public final double getWest() { return privateWest; } public final void setWest(double value) { privateWest = value; } }
- Parameters:
value-- See Also:
resetBackColor
-
getFontStyle
public java.util.EnumSet<FontStyle> getFontStyle()
Gets or sets additional font attributes to the axis section.
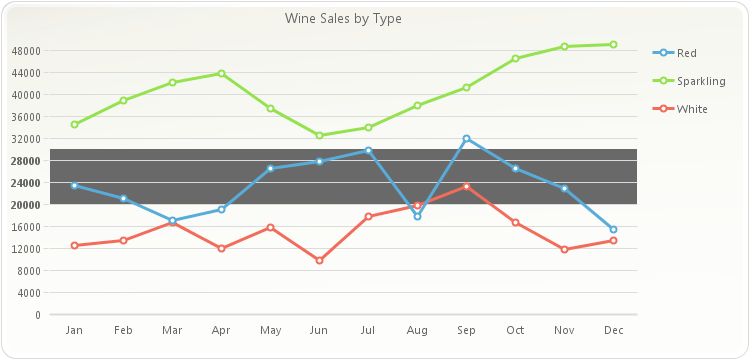
PopulateProductSales(chart1);
chart1.getTitles().add(new TitleDockable("Wine Sales by Type"));
AxisSection sect;
sect = new AxisSection();
sect.setAdjustable(false);
sect.setFrom(20000);
sect.setTo(30000);
sect.setBackColor(new java.awt.Color(105,105,105,255));
chart1.getAxisY().getSections().add(sect);
chart1.getAxisY().getSections().get(0).setFontStyle(EnumSet.of(FontStyle.BOLD));
public static void PopulateProductSales(Chart chart1) { ProductSales[] data = new ProductSales[]{ new ProductSales("Jan", 12560, 23400, 34500), new ProductSales("Feb", 13400, 21000, 38900), new ProductSales("Mar", 16700, 17000, 42100), new ProductSales("Apr", 12000, 19020, 43800), new ProductSales("May", 15800, 26500, 37540), new ProductSales("Jun", 9800, 27800, 32580), new ProductSales("Jul", 17800, 29820, 34000), new ProductSales("Aug", 19800, 17800, 38000), new ProductSales("Sep", 23200, 32000, 41300), new ProductSales("Oct", 16700, 26500, 46590), new ProductSales("Nov", 11800, 23000, 48700), new ProductSales("Dec", 13400, 15400, 49100) }; ObjectProvider objProvider = new ObjectProvider(data); chart1.getDataSourceSettings().setDataSource(objProvider); }public static class ProductSales { public ProductSales(String month, double white, double red, double sparkling) { this.setMonth(month); this.setWhite(white); this.setRed(red); this.setSparkling(sparkling); } private String privateMonth; public final String getMonth() { return privateMonth; } public final void setMonth(String value) { privateMonth = value; } private double privateWhite; public final double getWhite() { return privateWhite; } public final void setWhite(double value) { privateWhite = value; } private double privateRed; public final double getRed() { return privateRed; } public final void setRed(double value) { privateRed = value; } private double privateSparkling; public final double getSparkling() { return privateSparkling; } public final void setSparkling(double value) { privateSparkling = value; } }
- See Also:
resetFontStyle
-
setFontStyle
public void setFontStyle(java.util.EnumSet<FontStyle> value)
Gets or sets additional font attributes to the axis section.
PopulateProductSales(chart1);
chart1.getTitles().add(new TitleDockable("Wine Sales by Type"));
AxisSection sect;
sect = new AxisSection();
sect.setAdjustable(false);
sect.setFrom(20000);
sect.setTo(30000);
sect.setBackColor(new java.awt.Color(105,105,105,255));
chart1.getAxisY().getSections().add(sect);
chart1.getAxisY().getSections().get(0).setFontStyle(EnumSet.of(FontStyle.BOLD));
public static void PopulateProductSales(Chart chart1) { ProductSales[] data = new ProductSales[]{ new ProductSales("Jan", 12560, 23400, 34500), new ProductSales("Feb", 13400, 21000, 38900), new ProductSales("Mar", 16700, 17000, 42100), new ProductSales("Apr", 12000, 19020, 43800), new ProductSales("May", 15800, 26500, 37540), new ProductSales("Jun", 9800, 27800, 32580), new ProductSales("Jul", 17800, 29820, 34000), new ProductSales("Aug", 19800, 17800, 38000), new ProductSales("Sep", 23200, 32000, 41300), new ProductSales("Oct", 16700, 26500, 46590), new ProductSales("Nov", 11800, 23000, 48700), new ProductSales("Dec", 13400, 15400, 49100) }; ObjectProvider objProvider = new ObjectProvider(data); chart1.getDataSourceSettings().setDataSource(objProvider); }public static class ProductSales { public ProductSales(String month, double white, double red, double sparkling) { this.setMonth(month); this.setWhite(white); this.setRed(red); this.setSparkling(sparkling); } private String privateMonth; public final String getMonth() { return privateMonth; } public final void setMonth(String value) { privateMonth = value; } private double privateWhite; public final double getWhite() { return privateWhite; } public final void setWhite(double value) { privateWhite = value; } private double privateRed; public final double getRed() { return privateRed; } public final void setRed(double value) { privateRed = value; } private double privateSparkling; public final double getSparkling() { return privateSparkling; } public final void setSparkling(double value) { privateSparkling = value; } }
- Parameters:
value-- See Also:
resetFontStyle
-
setFrom
public void setFrom(AxisSectionCalculation value)
Gets or sets a value indicating the beginning value of the range for a selected AxisSection object.
The
setTomethod is used to specify the ending value of the section range for a selectedAxisSectionobject.The
AxisSectionBaseclass members are used to customize the mayor gridlines, minor gridlines, TextColor, and Link for an AxisSection object.The
setFontStylemethod is used to configure additional font attributes for the selected axis section.The
setSectionsmethod returns the AxisSection object which may be configured using the AxisSection andAxisSectionclass members.To configure the From value for the 1st axis section of the Y Axis:
chart1.getAxisY().getSections().get(0).setFrom(30);
- Parameters:
value-
-
getFrom
public AxisSectionValue getFrom()
Gets or sets a value indicating the beginning value of the range for a selected AxisSection object.
The
setTomethod is used to specify the ending value of the section range for a selectedAxisSectionobject.The
AxisSectionBaseclass members are used to customize the mayor gridlines, minor gridlines, TextColor, and Link for an AxisSection object.The
setFontStylemethod is used to configure additional font attributes for the selected axis section.The
setSectionsmethod returns the AxisSection object which may be configured using the AxisSection andAxisSectionclass members.To configure the From value for the 1st axis section of the Y Axis:
chart1.getAxisY().getSections().get(0).setFrom(30);
-
setFrom
public void setFrom(AxisSectionValue value)
Gets or sets a value indicating the beginning value of the range for a selected AxisSection object.
The
setTomethod is used to specify the ending value of the section range for a selectedAxisSectionobject.The
AxisSectionBaseclass members are used to customize the mayor gridlines, minor gridlines, TextColor, and Link for an AxisSection object.The
setFontStylemethod is used to configure additional font attributes for the selected axis section.The
setSectionsmethod returns the AxisSection object which may be configured using the AxisSection andAxisSectionclass members.To configure the From value for the 1st axis section of the Y Axis:
chart1.getAxisY().getSections().get(0).setFrom(30);
- Parameters:
value-
-
getFromDouble
public double getFromDouble()
Gets or sets a value indicating the beginning value of the range for a selected AxisSection object.
The
setTomethod is used to specify the ending value of the section range for a selectedAxisSectionobject.The
AxisSectionBaseclass members are used to customize the mayor gridlines, minor gridlines, TextColor, and Link for an AxisSection object.The
setFontStylemethod is used to configure additional font attributes for the selected axis section.The
setSectionsmethod returns the AxisSection object which may be configured using the AxisSection andAxisSectionclass members.To configure the From value for the 1st axis section of the Y Axis:
chart1.getAxisY().getSections().get(0).setFrom(30);
-
setFrom
public void setFrom(double value)
Gets or sets a value indicating the beginning value of the range for a selected AxisSection object.
The
setTomethod is used to specify the ending value of the section range for a selectedAxisSectionobject.The
AxisSectionBaseclass members are used to customize the mayor gridlines, minor gridlines, TextColor, and Link for an AxisSection object.The
setFontStylemethod is used to configure additional font attributes for the selected axis section.The
setSectionsmethod returns the AxisSection object which may be configured using the AxisSection andAxisSectionclass members.To configure the From value for the 1st axis section of the Y Axis:
chart1.getAxisY().getSections().get(0).setFrom(30);
- Parameters:
value-
-
getHighlight
public AxisSectionHighlightAttributes getHighlight()
Allows to highlight the selected axis section.AxisSection sect; sect = new AxisSection(((AxisSectionValue)0.0), ((AxisSectionValue)100.0), new java.awt.Color(255,0,0,255)); sect.getHighlight().setEnabled(true); chart1.getAxisY().getSections().add(sect);
-
getPoint
public int getPoint()
Description goes here
-
setPoint
public void setPoint(int value)
Description goes here- Parameters:
value-
-
getSeries
public SeriesReference getSeries()
Gets or sets a value indicating the series an AxisSection is associated with.
-
getText
public java.lang.String getText()
Description goes here
-
setText
public void setText(java.lang.String value)
Description goes here- Parameters:
value-
-
getTitle
public Title getTitle()
Used to set a title for the selected axis section
AxisSection sect;
sect = new AxisSection();
sect.setFrom(0);
sect.setTo(100);
sect.setBackColor(new java.awt.Color(255,0,0,255));
sect.getTitle().setText("Section Title");
chart1.getAxisX().getSections().add(sect);
-
setTo
public void setTo(AxisSectionCalculation value)
Gets or sets a value indicating the ending value of the range for a selected AxisSection object.
The
setFrommethod is used to specify the beginning value of the section range for a selectedAxisSectionobject.The
AxisSectionBaseclass members are used to customize the mayor gridlines, minor gridlines, textColor and Link for a AxisSection object.The
setFontStylemethod is used to configure additional font attributes for the selected axis section.The
setSectionsmethod returns the AxisSection object which may be configured using the AxisSection andAxisSectionclass members.To configure the To value for the 1st axis section of the Y Axis:
chart1.getAxisY().getSections().get(0).setTo(60);
- Parameters:
value-
-
getTo
public AxisSectionValue getTo()
Gets or sets a value indicating the ending value of the range for a selected AxisSection object.
The
setFrommethod is used to specify the beginning value of the section range for a selectedAxisSectionobject.The
AxisSectionBaseclass members are used to customize the mayor gridlines, minor gridlines, textColor and Link for a AxisSection object.The
setFontStylemethod is used to configure additional font attributes for the selected axis section.The
setSectionsmethod returns the AxisSection object which may be configured using the AxisSection andAxisSectionclass members.To configure the To value for the 1st axis section of the Y Axis:
chart1.getAxisY().getSections().get(0).setTo(60);
-
setTo
public void setTo(AxisSectionValue value)
Gets or sets a value indicating the ending value of the range for a selected AxisSection object.
The
setFrommethod is used to specify the beginning value of the section range for a selectedAxisSectionobject.The
AxisSectionBaseclass members are used to customize the mayor gridlines, minor gridlines, textColor and Link for a AxisSection object.The
setFontStylemethod is used to configure additional font attributes for the selected axis section.The
setSectionsmethod returns the AxisSection object which may be configured using the AxisSection andAxisSectionclass members.To configure the To value for the 1st axis section of the Y Axis:
chart1.getAxisY().getSections().get(0).setTo(60);
- Parameters:
value-
-
getToDouble
public double getToDouble()
Gets or sets a value indicating the ending value of the range for a selected AxisSection object.
The
setFrommethod is used to specify the beginning value of the section range for a selectedAxisSectionobject.The
AxisSectionBaseclass members are used to customize the mayor gridlines, minor gridlines, textColor and Link for a AxisSection object.The
setFontStylemethod is used to configure additional font attributes for the selected axis section.The
setSectionsmethod returns the AxisSection object which may be configured using the AxisSection andAxisSectionclass members.To configure the To value for the 1st axis section of the Y Axis:
chart1.getAxisY().getSections().get(0).setTo(60);
-
setTo
public void setTo(double value)
Gets or sets a value indicating the ending value of the range for a selected AxisSection object.
The
setFrommethod is used to specify the beginning value of the section range for a selectedAxisSectionobject.The
AxisSectionBaseclass members are used to customize the mayor gridlines, minor gridlines, textColor and Link for a AxisSection object.The
setFontStylemethod is used to configure additional font attributes for the selected axis section.The
setSectionsmethod returns the AxisSection object which may be configured using the AxisSection andAxisSectionclass members.To configure the To value for the 1st axis section of the Y Axis:
chart1.getAxisY().getSections().get(0).setTo(60);
- Parameters:
value-
-
isVisible
public boolean isVisible()
Shows or hides the selected axis section.
Hiding the axis section does not destroy or lose previous settings assigned by other methods.
To hide the axis section:
chart1.getAxisY().getSections().get(0).setVisible(false);
- See Also:
resetVisible
-
setVisible
public void setVisible(boolean value)
Shows or hides the selected axis section.
Hiding the axis section does not destroy or lose previous settings assigned by other methods.
To hide the axis section:
chart1.getAxisY().getSections().get(0).setVisible(false);
- Parameters:
value-- See Also:
resetVisible
-
resetAdjustable
public void resetAdjustable()
Set the property Adjustable to its default value.- See Also:
isAdjustable
-
resetBackColor
public void resetBackColor()
Set the property BackColor to its default value.- See Also:
setBackColor
-
resetFontStyle
public void resetFontStyle()
Set the property FontStyle to its default value.- See Also:
setFontStyle
-
resetVisible
public void resetVisible()
Set the property Visible to its default value.- See Also:
isVisible
-
-