- java.lang.Object
-
- com.softwarefx.chartfx.server.AxisScale
-
- Direct Known Subclasses:
- LinearizableAxisScale
public class AxisScale
extends java.lang.Object
This class is used to handle the visible axis Scales of a chart.
When zooming or scrolling in the chart the visible axis scales values changes reflecting the current max and min values.
-
-
Constructor Summary
Constructors Constructor and Description AxisScale()
-
Method Summary
Methods Modifier and Type Method and Description AxisgetAxis()Description goes heredouble[]getCustomSteps()Allows you to set a custom step for the selected scale.intgetFirstLabel()Gets or sets a value used to customize the first label displayed on a selected scale.DataUnitgetFrom()Gets or sets the From value assigned to the specified axis scalejava.util.DategetFromDateTime()Gets or sets the From value assigned to the specified axis scaledoublegetFromDouble()Gets or sets the From value assigned to the specified axis scaleTimeSpangetFromTimeSpan()Gets or sets the From value assigned to the specified axis scaleDataUnitgetLabelValue()Allows you to set and associate text labels to major tick marks in a numerical axis scale.java.util.DategetLabelValueDateTime()Allows you to set and associate text labels to major tick marks in a numerical axis scale.doublegetLabelValueDouble()Allows you to set and associate text labels to major tick marks in a numerical axis scale.TimeSpangetLabelValueTimeSpan()Allows you to set and associate text labels to major tick marks in a numerical axis scale.DataUnitgetMinorStep()Description goes herejava.util.DategetMinorStepDateTime()Description goes heredoublegetMinorStepDouble()Description goes hereTimeSpangetMinorStepTimeSpan()Description goes heredoublegetProportion()Specifies the value to divide the AxisScaledoublegetScaleUnit()Returns the scale unit of a selected scale.DataUnitgetStep()Specifies the interval of major tick marks and gridlines on the selected scale.java.util.DategetStepDateTime()Specifies the interval of major tick marks and gridlines on the selected scale.doublegetStepDouble()Specifies the interval of major tick marks and gridlines on the selected scale.TimeSpangetStepTimeSpan()Specifies the interval of major tick marks and gridlines on the selected scale.DataUnitgetTo()Gets or sets the To value assigned to the specified axis scale.java.util.DategetToDateTime()Gets or sets the To value assigned to the specified axis scale.doublegetToDouble()Gets or sets the To value assigned to the specified axis scale.TimeSpangetToTimeSpan()Gets or sets the To value assigned to the specified axis scale.booleanisAutoMinorStep()Specifies if the increment between minor tick marks and minor gridlines was automatically calculated.booleanisAutoStep()Specifies if the the interval of major tick marks and gridlines on the selected scale was automatically calculated.voidresetCustomSteps()Set the property CustomSteps to its default value.voidresetFirstLabel()Set the property FirstLabel to its default value.voidresetFrom()Set the property From to its default value.voidresetLabelValue()Set the property LabelValue to its default value.voidresetMinorStep()Set the property MinorStep to its default value.voidresetProportion()Set the property Proportion to its default value.voidresetScaleUnit()Set the property ScaleUnit to its default value.voidresetStep()Set the property Step to its default value.voidresetTo()Set the property To to its default value.voidsetCustomSteps(double[] value)Allows you to set a custom step for the selected scale.voidsetFirstLabel(int value)Gets or sets a value used to customize the first label displayed on a selected scale.voidsetFrom(DataUnit value)Gets or sets the From value assigned to the specified axis scalevoidsetFrom(java.util.Date value)Gets or sets the From value assigned to the specified axis scalevoidsetFrom(double value)Gets or sets the From value assigned to the specified axis scalevoidsetFrom(TimeSpan value)Gets or sets the From value assigned to the specified axis scalevoidsetLabelValue(DataUnit value)Allows you to set and associate text labels to major tick marks in a numerical axis scale.voidsetLabelValue(java.util.Date value)Allows you to set and associate text labels to major tick marks in a numerical axis scale.voidsetLabelValue(double value)Allows you to set and associate text labels to major tick marks in a numerical axis scale.voidsetLabelValue(TimeSpan value)Allows you to set and associate text labels to major tick marks in a numerical axis scale.voidsetMinorStep(DataUnit value)Description goes herevoidsetMinorStep(java.util.Date value)Description goes herevoidsetMinorStep(double value)Description goes herevoidsetMinorStep(TimeSpan value)Description goes herevoidsetProportion(double value)Specifies the value to divide the AxisScalevoidsetScaleUnit(double value)Returns or Sets the scale unit of a selected scale.voidsetStep(DataUnit value)Specifies the interval of major tick marks and gridlines on the selected scale.voidsetStep(java.util.Date value)Specifies the interval of major tick marks and gridlines on the selected scale.voidsetStep(double value)Specifies the interval of major tick marks and gridlines on the selected scale.voidsetStep(TimeSpan value)Specifies the interval of major tick marks and gridlines on the selected scale.voidsetTo(DataUnit value)Gets or sets the To value assigned to the specified axis scale.voidsetTo(java.util.Date value)Gets or sets the To value assigned to the specified axis scale.voidsetTo(double value)Gets or sets the To value assigned to the specified axis scale.voidsetTo(TimeSpan value)Gets or sets the To value assigned to the specified axis scale.
-
-
-
Method Detail
-
isAutoMinorStep
public boolean isAutoMinorStep()
Specifies if the increment between minor tick marks and minor gridlines was automatically calculated.
boolean isAutoMinorStep;
isAutoMinorStep = chart1.getAxisX().getScale().getIsAutoMinorStep();
-
isAutoStep
public boolean isAutoStep()
Specifies if the the interval of major tick marks and gridlines on the selected scale was automatically calculated.
boolean isAutoStep;
isAutoStep = chart1.getAxisX().getScale().getIsAutoStep();
-
getAxis
public Axis getAxis()
Description goes here
-
getCustomSteps
public double[] getCustomSteps()
Allows you to set a custom step for the selected scale.
The
setCustomStepsmethod holds an array of numbers (double) that specifies a series of step values for the selected scale.The step applied to the scale will begin to cycle if your chart contains enough points. For example, if you set the CustomStep to (5,10,20,30) the scale step would look like the following:
0,5,15,35,65,70,80,100,130,135,...
Below, the Y Axis custom step has been set to {250, 500, 1500, 3000}:
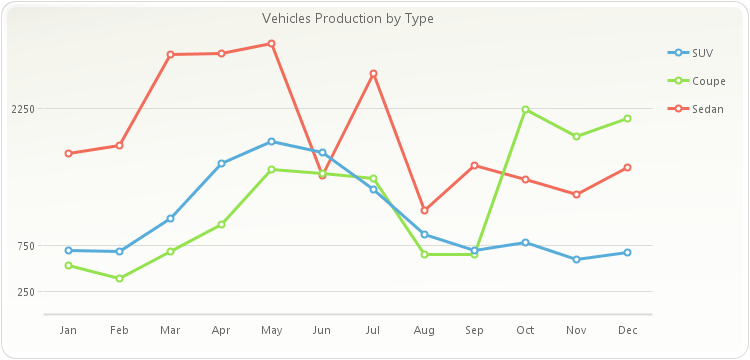
PopulateCarProduction(chart1);
chart1.getTitles().add(new TitleDockable("Vehicles Production by Type"));
double[] myStep;
myStep = new double[] {250, 500, 1500, 3000};
chart1.getAxisY().setCustomSteps(myStep);
public static void PopulateCarProduction(Chart chart1) { CarProduction[] production = new CarProduction[] { new CarProduction("Jan", 1760, 535, 695 ) , new CarProduction("Feb", 1849, 395, 688 ) , new CarProduction("Mar", 2831, 685, 1047 ) , new CarProduction("Apr", 2851, 984, 1652 ) , new CarProduction("May", 2961, 1579, 1889 ) , new CarProduction("Jun", 1519, 1539, 1766 ) , new CarProduction("Jul", 2633, 1489, 1361 ) , new CarProduction("Aug", 1140, 650, 874 ) , new CarProduction("Sep", 1626, 653, 693 ) , new CarProduction("Oct", 1478, 2236, 786 ) , new CarProduction("Nov", 1306, 1937, 599 ) , new CarProduction("Dec", 1607, 2138, 678 ) }; ObjectProvider objProvider = new ObjectProvider(production); chart1.getDataSourceSettings().setDataSource(objProvider); }public static class CarProduction { private CarProduction(String month, int sedan, int coupe, int SUV) { this.setMonth(month); this.setSedan(sedan); this.setCoupe(coupe); this.setSUV(SUV); } private String privateMonth; public final String getMonth() { return privateMonth; } public final void setMonth(String value) { privateMonth = value; } private int privateSedan; public final int getSedan() { return privateSedan; } public final void setSedan(int value) { privateSedan = value; } private int privateCoupe; public final int getCoupe() { return privateCoupe; } public final void setCoupe(int value) { privateCoupe = value; } private int privateSUV; public final int getSUV() { return privateSUV; } public final void setSUV(int value) { privateSUV = value; } }
- See Also:
resetCustomSteps
-
setCustomSteps
public void setCustomSteps(double[] value)
Allows you to set a custom step for the selected scale.
The
setCustomStepsmethod holds an array of numbers (double) that specifies a series of step values for the selected scale.The step applied to the scale will begin to cycle if your chart contains enough points. For example, if you set the CustomStep to (5,10,20,30) the scale step would look like the following:
0,5,15,35,65,70,80,100,130,135,...
Below, the Y Axis custom step has been set to {250, 500, 1500, 3000}:
PopulateCarProduction(chart1);
chart1.getTitles().add(new TitleDockable("Vehicles Production by Type"));
double[] myStep;
myStep = new double[] {250, 500, 1500, 3000};
chart1.getAxisY().setCustomSteps(myStep);
public static void PopulateCarProduction(Chart chart1) { CarProduction[] production = new CarProduction[] { new CarProduction("Jan", 1760, 535, 695 ) , new CarProduction("Feb", 1849, 395, 688 ) , new CarProduction("Mar", 2831, 685, 1047 ) , new CarProduction("Apr", 2851, 984, 1652 ) , new CarProduction("May", 2961, 1579, 1889 ) , new CarProduction("Jun", 1519, 1539, 1766 ) , new CarProduction("Jul", 2633, 1489, 1361 ) , new CarProduction("Aug", 1140, 650, 874 ) , new CarProduction("Sep", 1626, 653, 693 ) , new CarProduction("Oct", 1478, 2236, 786 ) , new CarProduction("Nov", 1306, 1937, 599 ) , new CarProduction("Dec", 1607, 2138, 678 ) }; ObjectProvider objProvider = new ObjectProvider(production); chart1.getDataSourceSettings().setDataSource(objProvider); }public static class CarProduction { private CarProduction(String month, int sedan, int coupe, int SUV) { this.setMonth(month); this.setSedan(sedan); this.setCoupe(coupe); this.setSUV(SUV); } private String privateMonth; public final String getMonth() { return privateMonth; } public final void setMonth(String value) { privateMonth = value; } private int privateSedan; public final int getSedan() { return privateSedan; } public final void setSedan(int value) { privateSedan = value; } private int privateCoupe; public final int getCoupe() { return privateCoupe; } public final void setCoupe(int value) { privateCoupe = value; } private int privateSUV; public final int getSUV() { return privateSUV; } public final void setSUV(int value) { privateSUV = value; } }
- Parameters:
value-- See Also:
resetCustomSteps
-
getFirstLabel
public int getFirstLabel()
Gets or sets a value used to customize the first label displayed on a selected scale.
The setting must be an integer specifying where you want labels to begin. The scale will then follow the
setStepassociated with it to display subsequent labels.When using this method in the X Axis of a chart with values ranging from 0 to 1, the axis'
setMinorStepis used to calculate which label is the first, second, third, etc. When X Axis values range bigger than 1, then the axissetStepis used for this calculation.Below, the first label in the X-Axis is set to 3:
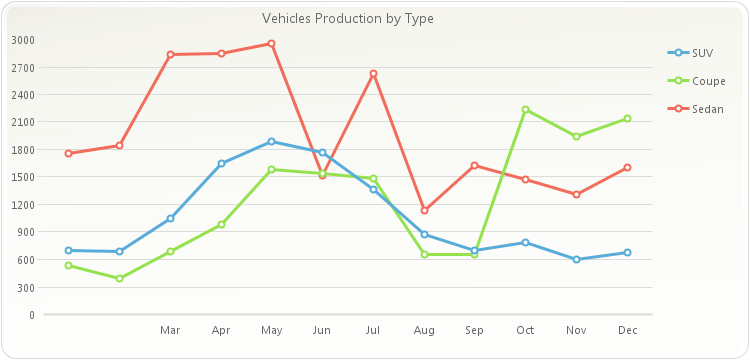
PopulateCarProduction(chart1);
chart1.getTitles().add(new TitleDockable("Vehicles Production by Type"));
chart1.getAxisX().setFirstLabel(3);
public static void PopulateCarProduction(Chart chart1) { CarProduction[] production = new CarProduction[] { new CarProduction("Jan", 1760, 535, 695 ) , new CarProduction("Feb", 1849, 395, 688 ) , new CarProduction("Mar", 2831, 685, 1047 ) , new CarProduction("Apr", 2851, 984, 1652 ) , new CarProduction("May", 2961, 1579, 1889 ) , new CarProduction("Jun", 1519, 1539, 1766 ) , new CarProduction("Jul", 2633, 1489, 1361 ) , new CarProduction("Aug", 1140, 650, 874 ) , new CarProduction("Sep", 1626, 653, 693 ) , new CarProduction("Oct", 1478, 2236, 786 ) , new CarProduction("Nov", 1306, 1937, 599 ) , new CarProduction("Dec", 1607, 2138, 678 ) }; ObjectProvider objProvider = new ObjectProvider(production); chart1.getDataSourceSettings().setDataSource(objProvider); }public static class CarProduction { private CarProduction(String month, int sedan, int coupe, int SUV) { this.setMonth(month); this.setSedan(sedan); this.setCoupe(coupe); this.setSUV(SUV); } private String privateMonth; public final String getMonth() { return privateMonth; } public final void setMonth(String value) { privateMonth = value; } private int privateSedan; public final int getSedan() { return privateSedan; } public final void setSedan(int value) { privateSedan = value; } private int privateCoupe; public final int getCoupe() { return privateCoupe; } public final void setCoupe(int value) { privateCoupe = value; } private int privateSUV; public final int getSUV() { return privateSUV; } public final void setSUV(int value) { privateSUV = value; } }
- See Also:
resetFirstLabel
-
setFirstLabel
public void setFirstLabel(int value)
Gets or sets a value used to customize the first label displayed on a selected scale.
The setting must be an integer specifying where you want labels to begin. The scale will then follow the
setStepassociated with it to display subsequent labels.When using this method in the X Axis of a chart with values ranging from 0 to 1, the axis'
setMinorStepis used to calculate which label is the first, second, third, etc. When X Axis values range bigger than 1, then the axissetStepis used for this calculation.Below, the first label in the X-Axis is set to 3:
PopulateCarProduction(chart1);
chart1.getTitles().add(new TitleDockable("Vehicles Production by Type"));
chart1.getAxisX().setFirstLabel(3);
public static void PopulateCarProduction(Chart chart1) { CarProduction[] production = new CarProduction[] { new CarProduction("Jan", 1760, 535, 695 ) , new CarProduction("Feb", 1849, 395, 688 ) , new CarProduction("Mar", 2831, 685, 1047 ) , new CarProduction("Apr", 2851, 984, 1652 ) , new CarProduction("May", 2961, 1579, 1889 ) , new CarProduction("Jun", 1519, 1539, 1766 ) , new CarProduction("Jul", 2633, 1489, 1361 ) , new CarProduction("Aug", 1140, 650, 874 ) , new CarProduction("Sep", 1626, 653, 693 ) , new CarProduction("Oct", 1478, 2236, 786 ) , new CarProduction("Nov", 1306, 1937, 599 ) , new CarProduction("Dec", 1607, 2138, 678 ) }; ObjectProvider objProvider = new ObjectProvider(production); chart1.getDataSourceSettings().setDataSource(objProvider); }public static class CarProduction { private CarProduction(String month, int sedan, int coupe, int SUV) { this.setMonth(month); this.setSedan(sedan); this.setCoupe(coupe); this.setSUV(SUV); } private String privateMonth; public final String getMonth() { return privateMonth; } public final void setMonth(String value) { privateMonth = value; } private int privateSedan; public final int getSedan() { return privateSedan; } public final void setSedan(int value) { privateSedan = value; } private int privateCoupe; public final int getCoupe() { return privateCoupe; } public final void setCoupe(int value) { privateCoupe = value; } private int privateSUV; public final int getSUV() { return privateSUV; } public final void setSUV(int value) { privateSUV = value; } }
- Parameters:
value-- See Also:
resetFirstLabel
-
getFromTimeSpan
public TimeSpan getFromTimeSpan()
Gets or sets the From value assigned to the specified axis scale
The AxisScale
setFrommethod can be applied to different axis types, so this method can be set to a categorical axis.If no From value is specified, will automatically set a From value according to the data provided, you can use this method to read or write this default value.
The value of the
setFrommethod must be smaller than the value of the To method.To set the From value of the primary X axis scale to a datetime:
chart1.getAxisX().getScale().setFrom(new DateTime(2006, 1, 15));
- See Also:
resetFrom
-
setFrom
public void setFrom(TimeSpan value)
Gets or sets the From value assigned to the specified axis scale
The AxisScale
setFrommethod can be applied to different axis types, so this method can be set to a categorical axis.If no From value is specified, will automatically set a From value according to the data provided, you can use this method to read or write this default value.
The value of the
setFrommethod must be smaller than the value of the To method.To set the From value of the primary X axis scale to a datetime:
chart1.getAxisX().getScale().setFrom(new DateTime(2006, 1, 15));
- Parameters:
value-- See Also:
resetFrom
-
getFrom
public DataUnit getFrom()
Gets or sets the From value assigned to the specified axis scale
The AxisScale
setFrommethod can be applied to different axis types, so this method can be set to a categorical axis.If no From value is specified, will automatically set a From value according to the data provided, you can use this method to read or write this default value.
The value of the
setFrommethod must be smaller than the value of the To method.To set the From value of the primary X axis scale to a datetime:
chart1.getAxisX().getScale().setFrom(new DateTime(2006, 1, 15));
- See Also:
resetFrom
-
setFrom
public void setFrom(DataUnit value)
Gets or sets the From value assigned to the specified axis scale
The AxisScale
setFrommethod can be applied to different axis types, so this method can be set to a categorical axis.If no From value is specified, will automatically set a From value according to the data provided, you can use this method to read or write this default value.
The value of the
setFrommethod must be smaller than the value of the To method.To set the From value of the primary X axis scale to a datetime:
chart1.getAxisX().getScale().setFrom(new DateTime(2006, 1, 15));
- Parameters:
value-- See Also:
resetFrom
-
getFromDouble
public double getFromDouble()
Gets or sets the From value assigned to the specified axis scale
The AxisScale
setFrommethod can be applied to different axis types, so this method can be set to a categorical axis.If no From value is specified, will automatically set a From value according to the data provided, you can use this method to read or write this default value.
The value of the
setFrommethod must be smaller than the value of the To method.To set the From value of the primary X axis scale to a datetime:
chart1.getAxisX().getScale().setFrom(new DateTime(2006, 1, 15));
- See Also:
resetFrom
-
setFrom
public void setFrom(double value)
Gets or sets the From value assigned to the specified axis scale
The AxisScale
setFrommethod can be applied to different axis types, so this method can be set to a categorical axis.If no From value is specified, will automatically set a From value according to the data provided, you can use this method to read or write this default value.
The value of the
setFrommethod must be smaller than the value of the To method.To set the From value of the primary X axis scale to a datetime:
chart1.getAxisX().getScale().setFrom(new DateTime(2006, 1, 15));
- Parameters:
value-- See Also:
resetFrom
-
getFromDateTime
public java.util.Date getFromDateTime()
Gets or sets the From value assigned to the specified axis scale
The AxisScale
setFrommethod can be applied to different axis types, so this method can be set to a categorical axis.If no From value is specified, will automatically set a From value according to the data provided, you can use this method to read or write this default value.
The value of the
setFrommethod must be smaller than the value of the To method.To set the From value of the primary X axis scale to a datetime:
chart1.getAxisX().getScale().setFrom(new DateTime(2006, 1, 15));
- See Also:
resetFrom
-
setFrom
public void setFrom(java.util.Date value)
Gets or sets the From value assigned to the specified axis scale
The AxisScale
setFrommethod can be applied to different axis types, so this method can be set to a categorical axis.If no From value is specified, will automatically set a From value according to the data provided, you can use this method to read or write this default value.
The value of the
setFrommethod must be smaller than the value of the To method.To set the From value of the primary X axis scale to a datetime:
chart1.getAxisX().getScale().setFrom(new DateTime(2006, 1, 15));
- Parameters:
value-- See Also:
resetFrom
-
getLabelValueTimeSpan
public TimeSpan getLabelValueTimeSpan()
Allows you to set and associate text labels to major tick marks in a numerical axis scale. This property can get or set the LabelValue assigned to any of the axes scales.
Normally, labels in a numerical axis scale are automatically controlled and displayed according to the
setMin,setMaxandsetStepmethods. In some cases, you'll need to associate text labels with a numerical axis scale(using thesetLabelsmethod), but when any of the scale values (Min, Max, Step, etc) change, these labels will no longer serve their purpose as the tick marks will be recalculated according to scale settings.For example, if you have a chart where the Y axis scale ranges from Min=0 to Max=100 and Step=25, you'll have 4 tick marks on 25,50,75 and 100. By default Chart FX will display numbers (as labels) associated with each tick mark.
Now let's say you want to associate text labels (instead of the number) with each tick mark in the Y axis scale and you use the Label method to set the following text labels: "Twenty-Five", "Fifty", "Seventy-Five", "One Hundred".
When you do this, everything will work out fine and the 4 tick marks will be labeled accordingly; however, if during the execution of your program or through user interaction, the Step suddenly changes from 25 to 12.5, you'll have 8 tick marks instead of 4 because you used the Label method with indexes 0,1,2 and 3, the "Fifty" tickmark will no longer correspond to the 50 value.
If you would have set the
setLabelValueDateTimemethod to 25, when the Step changes from 25 to 12.5 Chart FX will label every other tick mark and the labels will correspond to their initial setting.Label visual attributes like rotation, color and font are also accessible through the
setLabelAngle,setTextColor, andsetFontmethods, respectively.To set a LabelValue of 25 for the primary Y axis scale:
chart1.getAxisY().getScales().get(0).setLabelValue(25);
- See Also:
resetLabelValue
-
setLabelValue
public void setLabelValue(TimeSpan value)
Allows you to set and associate text labels to major tick marks in a numerical axis scale. This property can get or set the LabelValue assigned to any of the axes scales.
Normally, labels in a numerical axis scale are automatically controlled and displayed according to the
setMin,setMaxandsetStepmethods. In some cases, you'll need to associate text labels with a numerical axis scale(using thesetLabelsmethod), but when any of the scale values (Min, Max, Step, etc) change, these labels will no longer serve their purpose as the tick marks will be recalculated according to scale settings.For example, if you have a chart where the Y axis scale ranges from Min=0 to Max=100 and Step=25, you'll have 4 tick marks on 25,50,75 and 100. By default Chart FX will display numbers (as labels) associated with each tick mark.
Now let's say you want to associate text labels (instead of the number) with each tick mark in the Y axis scale and you use the Label method to set the following text labels: "Twenty-Five", "Fifty", "Seventy-Five", "One Hundred".
When you do this, everything will work out fine and the 4 tick marks will be labeled accordingly; however, if during the execution of your program or through user interaction, the Step suddenly changes from 25 to 12.5, you'll have 8 tick marks instead of 4 because you used the Label method with indexes 0,1,2 and 3, the "Fifty" tickmark will no longer correspond to the 50 value.
If you would have set the
setLabelValueDateTimemethod to 25, when the Step changes from 25 to 12.5 Chart FX will label every other tick mark and the labels will correspond to their initial setting.Label visual attributes like rotation, color and font are also accessible through the
setLabelAngle,setTextColor, andsetFontmethods, respectively.To set a LabelValue of 25 for the primary Y axis scale:
chart1.getAxisY().getScales().get(0).setLabelValue(25);
- Parameters:
value-- See Also:
resetLabelValue
-
getLabelValue
public DataUnit getLabelValue()
Allows you to set and associate text labels to major tick marks in a numerical axis scale. This property can get or set the LabelValue assigned to any of the axes scales.
Normally, labels in a numerical axis scale are automatically controlled and displayed according to the
setMin,setMaxandsetStepmethods. In some cases, you'll need to associate text labels with a numerical axis scale(using thesetLabelsmethod), but when any of the scale values (Min, Max, Step, etc) change, these labels will no longer serve their purpose as the tick marks will be recalculated according to scale settings.For example, if you have a chart where the Y axis scale ranges from Min=0 to Max=100 and Step=25, you'll have 4 tick marks on 25,50,75 and 100. By default Chart FX will display numbers (as labels) associated with each tick mark.
Now let's say you want to associate text labels (instead of the number) with each tick mark in the Y axis scale and you use the Label method to set the following text labels: "Twenty-Five", "Fifty", "Seventy-Five", "One Hundred".
When you do this, everything will work out fine and the 4 tick marks will be labeled accordingly; however, if during the execution of your program or through user interaction, the Step suddenly changes from 25 to 12.5, you'll have 8 tick marks instead of 4 because you used the Label method with indexes 0,1,2 and 3, the "Fifty" tickmark will no longer correspond to the 50 value.
If you would have set the
setLabelValueDateTimemethod to 25, when the Step changes from 25 to 12.5 Chart FX will label every other tick mark and the labels will correspond to their initial setting.Label visual attributes like rotation, color and font are also accessible through the
setLabelAngle,setTextColor, andsetFontmethods, respectively.To set a LabelValue of 25 for the primary Y axis scale:
chart1.getAxisY().getScales().get(0).setLabelValue(25);
- See Also:
resetLabelValue
-
setLabelValue
public void setLabelValue(DataUnit value)
Allows you to set and associate text labels to major tick marks in a numerical axis scale. This property can get or set the LabelValue assigned to any of the axes scales.
Normally, labels in a numerical axis scale are automatically controlled and displayed according to the
setMin,setMaxandsetStepmethods. In some cases, you'll need to associate text labels with a numerical axis scale(using thesetLabelsmethod), but when any of the scale values (Min, Max, Step, etc) change, these labels will no longer serve their purpose as the tick marks will be recalculated according to scale settings.For example, if you have a chart where the Y axis scale ranges from Min=0 to Max=100 and Step=25, you'll have 4 tick marks on 25,50,75 and 100. By default Chart FX will display numbers (as labels) associated with each tick mark.
Now let's say you want to associate text labels (instead of the number) with each tick mark in the Y axis scale and you use the Label method to set the following text labels: "Twenty-Five", "Fifty", "Seventy-Five", "One Hundred".
When you do this, everything will work out fine and the 4 tick marks will be labeled accordingly; however, if during the execution of your program or through user interaction, the Step suddenly changes from 25 to 12.5, you'll have 8 tick marks instead of 4 because you used the Label method with indexes 0,1,2 and 3, the "Fifty" tickmark will no longer correspond to the 50 value.
If you would have set the
setLabelValueDateTimemethod to 25, when the Step changes from 25 to 12.5 Chart FX will label every other tick mark and the labels will correspond to their initial setting.Label visual attributes like rotation, color and font are also accessible through the
setLabelAngle,setTextColor, andsetFontmethods, respectively.To set a LabelValue of 25 for the primary Y axis scale:
chart1.getAxisY().getScales().get(0).setLabelValue(25);
- Parameters:
value-- See Also:
resetLabelValue
-
getLabelValueDouble
public double getLabelValueDouble()
Allows you to set and associate text labels to major tick marks in a numerical axis scale. This property can get or set the LabelValue assigned to any of the axes scales.
Normally, labels in a numerical axis scale are automatically controlled and displayed according to the
setMin,setMaxandsetStepmethods. In some cases, you'll need to associate text labels with a numerical axis scale(using thesetLabelsmethod), but when any of the scale values (Min, Max, Step, etc) change, these labels will no longer serve their purpose as the tick marks will be recalculated according to scale settings.For example, if you have a chart where the Y axis scale ranges from Min=0 to Max=100 and Step=25, you'll have 4 tick marks on 25,50,75 and 100. By default Chart FX will display numbers (as labels) associated with each tick mark.
Now let's say you want to associate text labels (instead of the number) with each tick mark in the Y axis scale and you use the Label method to set the following text labels: "Twenty-Five", "Fifty", "Seventy-Five", "One Hundred".
When you do this, everything will work out fine and the 4 tick marks will be labeled accordingly; however, if during the execution of your program or through user interaction, the Step suddenly changes from 25 to 12.5, you'll have 8 tick marks instead of 4 because you used the Label method with indexes 0,1,2 and 3, the "Fifty" tickmark will no longer correspond to the 50 value.
If you would have set the
setLabelValueDateTimemethod to 25, when the Step changes from 25 to 12.5 Chart FX will label every other tick mark and the labels will correspond to their initial setting.Label visual attributes like rotation, color and font are also accessible through the
setLabelAngle,setTextColor, andsetFontmethods, respectively.To set a LabelValue of 25 for the primary Y axis scale:
chart1.getAxisY().getScales().get(0).setLabelValue(25);
- See Also:
resetLabelValue
-
setLabelValue
public void setLabelValue(double value)
Allows you to set and associate text labels to major tick marks in a numerical axis scale. This property can get or set the LabelValue assigned to any of the axes scales.
Normally, labels in a numerical axis scale are automatically controlled and displayed according to the
setMin,setMaxandsetStepmethods. In some cases, you'll need to associate text labels with a numerical axis scale(using thesetLabelsmethod), but when any of the scale values (Min, Max, Step, etc) change, these labels will no longer serve their purpose as the tick marks will be recalculated according to scale settings.For example, if you have a chart where the Y axis scale ranges from Min=0 to Max=100 and Step=25, you'll have 4 tick marks on 25,50,75 and 100. By default Chart FX will display numbers (as labels) associated with each tick mark.
Now let's say you want to associate text labels (instead of the number) with each tick mark in the Y axis scale and you use the Label method to set the following text labels: "Twenty-Five", "Fifty", "Seventy-Five", "One Hundred".
When you do this, everything will work out fine and the 4 tick marks will be labeled accordingly; however, if during the execution of your program or through user interaction, the Step suddenly changes from 25 to 12.5, you'll have 8 tick marks instead of 4 because you used the Label method with indexes 0,1,2 and 3, the "Fifty" tickmark will no longer correspond to the 50 value.
If you would have set the
setLabelValueDateTimemethod to 25, when the Step changes from 25 to 12.5 Chart FX will label every other tick mark and the labels will correspond to their initial setting.Label visual attributes like rotation, color and font are also accessible through the
setLabelAngle,setTextColor, andsetFontmethods, respectively.To set a LabelValue of 25 for the primary Y axis scale:
chart1.getAxisY().getScales().get(0).setLabelValue(25);
- Parameters:
value-- See Also:
resetLabelValue
-
getLabelValueDateTime
public java.util.Date getLabelValueDateTime()
Allows you to set and associate text labels to major tick marks in a numerical axis scale. This property can get or set the LabelValue assigned to any of the axes scales.
Normally, labels in a numerical axis scale are automatically controlled and displayed according to the
setMin,setMaxandsetStepmethods. In some cases, you'll need to associate text labels with a numerical axis scale(using thesetLabelsmethod), but when any of the scale values (Min, Max, Step, etc) change, these labels will no longer serve their purpose as the tick marks will be recalculated according to scale settings.For example, if you have a chart where the Y axis scale ranges from Min=0 to Max=100 and Step=25, you'll have 4 tick marks on 25,50,75 and 100. By default Chart FX will display numbers (as labels) associated with each tick mark.
Now let's say you want to associate text labels (instead of the number) with each tick mark in the Y axis scale and you use the Label method to set the following text labels: "Twenty-Five", "Fifty", "Seventy-Five", "One Hundred".
When you do this, everything will work out fine and the 4 tick marks will be labeled accordingly; however, if during the execution of your program or through user interaction, the Step suddenly changes from 25 to 12.5, you'll have 8 tick marks instead of 4 because you used the Label method with indexes 0,1,2 and 3, the "Fifty" tickmark will no longer correspond to the 50 value.
If you would have set the
setLabelValueDateTimemethod to 25, when the Step changes from 25 to 12.5 Chart FX will label every other tick mark and the labels will correspond to their initial setting.Label visual attributes like rotation, color and font are also accessible through the
setLabelAngle,setTextColor, andsetFontmethods, respectively.To set a LabelValue of 25 for the primary Y axis scale:
chart1.getAxisY().getScales().get(0).setLabelValue(25);
- See Also:
resetLabelValue
-
setLabelValue
public void setLabelValue(java.util.Date value)
Allows you to set and associate text labels to major tick marks in a numerical axis scale. This property can get or set the LabelValue assigned to any of the axes scales.
Normally, labels in a numerical axis scale are automatically controlled and displayed according to the
setMin,setMaxandsetStepmethods. In some cases, you'll need to associate text labels with a numerical axis scale(using thesetLabelsmethod), but when any of the scale values (Min, Max, Step, etc) change, these labels will no longer serve their purpose as the tick marks will be recalculated according to scale settings.For example, if you have a chart where the Y axis scale ranges from Min=0 to Max=100 and Step=25, you'll have 4 tick marks on 25,50,75 and 100. By default Chart FX will display numbers (as labels) associated with each tick mark.
Now let's say you want to associate text labels (instead of the number) with each tick mark in the Y axis scale and you use the Label method to set the following text labels: "Twenty-Five", "Fifty", "Seventy-Five", "One Hundred".
When you do this, everything will work out fine and the 4 tick marks will be labeled accordingly; however, if during the execution of your program or through user interaction, the Step suddenly changes from 25 to 12.5, you'll have 8 tick marks instead of 4 because you used the Label method with indexes 0,1,2 and 3, the "Fifty" tickmark will no longer correspond to the 50 value.
If you would have set the
setLabelValueDateTimemethod to 25, when the Step changes from 25 to 12.5 Chart FX will label every other tick mark and the labels will correspond to their initial setting.Label visual attributes like rotation, color and font are also accessible through the
setLabelAngle,setTextColor, andsetFontmethods, respectively.To set a LabelValue of 25 for the primary Y axis scale:
chart1.getAxisY().getScales().get(0).setLabelValue(25);
- Parameters:
value-- See Also:
resetLabelValue
-
getMinorStepTimeSpan
public TimeSpan getMinorStepTimeSpan()
Description goes here
- See Also:
resetMinorStep
-
setMinorStep
public void setMinorStep(TimeSpan value)
Description goes here
- Parameters:
value-- See Also:
resetMinorStep
-
getMinorStep
public DataUnit getMinorStep()
Description goes here
- See Also:
resetMinorStep
-
setMinorStep
public void setMinorStep(DataUnit value)
Description goes here
- Parameters:
value-- See Also:
resetMinorStep
-
getMinorStepDouble
public double getMinorStepDouble()
Description goes here
- See Also:
resetMinorStep
-
setMinorStep
public void setMinorStep(double value)
Description goes here
- Parameters:
value-- See Also:
resetMinorStep
-
getMinorStepDateTime
public java.util.Date getMinorStepDateTime()
Description goes here
- See Also:
resetMinorStep
-
setMinorStep
public void setMinorStep(java.util.Date value)
Description goes here
- Parameters:
value-- See Also:
resetMinorStep
-
getProportion
public double getProportion()
Specifies the value to divide the AxisScale
To show 2 numeric AxisScales in a 20/80 proportion:
LinearAxisScale linearAxisScale;
linearAxisScale = new LinearAxisScale();
linearAxisScale.setFrom(0);
linearAxisScale.setTo(10);
linearAxisScale.setProportion(0.2);
chart1.getAxisY().getScales().set(0, ((AxisScale)linearAxisScale));
linearAxisScale = new LinearAxisScale();
linearAxisScale.setFrom(11);
linearAxisScale.setTo(50);
linearAxisScale.setProportion(0.8);
chart1.getAxisY().getScales().add(((AxisScale)linearAxisScale));
- See Also:
resetProportion
-
setProportion
public void setProportion(double value)
Specifies the value to divide the AxisScale
To show 2 numeric AxisScales in a 20/80 proportion:
LinearAxisScale linearAxisScale;
linearAxisScale = new LinearAxisScale();
linearAxisScale.setFrom(0);
linearAxisScale.setTo(10);
linearAxisScale.setProportion(0.2);
chart1.getAxisY().getScales().set(0, ((AxisScale)linearAxisScale));
linearAxisScale = new LinearAxisScale();
linearAxisScale.setFrom(11);
linearAxisScale.setTo(50);
linearAxisScale.setProportion(0.8);
chart1.getAxisY().getScales().add(((AxisScale)linearAxisScale));
- Parameters:
value-- See Also:
resetProportion
-
getScaleUnit
public double getScaleUnit()
Returns the scale unit of a selected scale.
This constant is very useful when the values used on the Y axis are too big (e.g. 10,000,000) in this case you can use a 1,000,000 scale and the values on the Y axis will be divided by this scale.
The
setScaleUnitmethod is a member of the scale object; therefore, the scale object must be referenced in order to set the method correctly.To set the Scale Unit of the primary Y scale to 1000:
chart1.getAxisY().getScales().get(0).setScaleUnit(1000);
- See Also:
resetScaleUnit
-
setScaleUnit
public void setScaleUnit(double value)
Returns or Sets the scale unit of a selected scale.
This constant is very useful when the values used on the Y axis are too big (e.g. 10,000,000) in this case you can use a 1,000,000 scale and the values on the Y axis will be divided by this scale.
The
setScaleUnitmethod is a member of the scale object; therefore, the scale object must be referenced in order to set the method correctly.To set the Scale Unit of the primary Y scale to 1000:
chart1.getAxisY().getScales().get(0).setScaleUnit(1000);
- Parameters:
value-- See Also:
resetScaleUnit
-
getStepTimeSpan
public TimeSpan getStepTimeSpan()
Specifies the interval of major tick marks and gridlines on the selected scale. It also controls the gap or interval between labels in the selected scale.
Normally, you use this method to control the interval of labels, tick marks and gridlines in the selected scale. For example, if the selected axis scale ranges from 0 to 100 and you want to show labels, tick marks or gridlines every 10 units, then the appropriate setting for the
setStepmethod is 10.This method can also be used for a categorical axis. For example, if your X axis displays labels ranging from January to December and you set the
setStepmethod to 2, then the categorical axis will display legends every other month.You can also control a minor interval with the Minor
setStepmethod.If no Step value is specified, will automatically set a Step according to the data provided, you can use this method to read or write this default value.
The value of the
setStepmethod must be greater than the value of the MinorsetStepmethod.To set the step on the major interval to 15 days in a Date categorical Axis:
chart1.getAxisX().getScale().setStep((15 * (DataUnit.Day)));
- See Also:
resetStep
-
setStep
public void setStep(TimeSpan value)
Specifies the interval of major tick marks and gridlines on the selected scale. It also controls the gap or interval between labels in the selected scale.
Normally, you use this method to control the interval of labels, tick marks and gridlines in the selected scale. For example, if the selected axis scale ranges from 0 to 100 and you want to show labels, tick marks or gridlines every 10 units, then the appropriate setting for the
setStepmethod is 10.This method can also be used for a categorical axis. For example, if your X axis displays labels ranging from January to December and you set the
setStepmethod to 2, then the categorical axis will display legends every other month.You can also control a minor interval with the Minor
setStepmethod.If no Step value is specified, will automatically set a Step according to the data provided, you can use this method to read or write this default value.
The value of the
setStepmethod must be greater than the value of the MinorsetStepmethod.To set the step on the major interval to 15 days in a Date categorical Axis:
chart1.getAxisX().getScale().setStep((15 * (DataUnit.Day)));
- Parameters:
value-- See Also:
resetStep
-
getStep
public DataUnit getStep()
Specifies the interval of major tick marks and gridlines on the selected scale. It also controls the gap or interval between labels in the selected scale.
Normally, you use this method to control the interval of labels, tick marks and gridlines in the selected scale. For example, if the selected axis scale ranges from 0 to 100 and you want to show labels, tick marks or gridlines every 10 units, then the appropriate setting for the
setStepmethod is 10.This method can also be used for a categorical axis. For example, if your X axis displays labels ranging from January to December and you set the
setStepmethod to 2, then the categorical axis will display legends every other month.You can also control a minor interval with the Minor
setStepmethod.If no Step value is specified, will automatically set a Step according to the data provided, you can use this method to read or write this default value.
The value of the
setStepmethod must be greater than the value of the MinorsetStepmethod.To set the step on the major interval to 15 days in a Date categorical Axis:
chart1.getAxisX().getScale().setStep((15 * (DataUnit.Day)));
- See Also:
resetStep
-
setStep
public void setStep(DataUnit value)
Specifies the interval of major tick marks and gridlines on the selected scale. It also controls the gap or interval between labels in the selected scale.
Normally, you use this method to control the interval of labels, tick marks and gridlines in the selected scale. For example, if the selected axis scale ranges from 0 to 100 and you want to show labels, tick marks or gridlines every 10 units, then the appropriate setting for the
setStepmethod is 10.This method can also be used for a categorical axis. For example, if your X axis displays labels ranging from January to December and you set the
setStepmethod to 2, then the categorical axis will display legends every other month.You can also control a minor interval with the Minor
setStepmethod.If no Step value is specified, will automatically set a Step according to the data provided, you can use this method to read or write this default value.
The value of the
setStepmethod must be greater than the value of the MinorsetStepmethod.To set the step on the major interval to 15 days in a Date categorical Axis:
chart1.getAxisX().getScale().setStep((15 * (DataUnit.Day)));
- Parameters:
value-- See Also:
resetStep
-
getStepDouble
public double getStepDouble()
Specifies the interval of major tick marks and gridlines on the selected scale. It also controls the gap or interval between labels in the selected scale.
Normally, you use this method to control the interval of labels, tick marks and gridlines in the selected scale. For example, if the selected axis scale ranges from 0 to 100 and you want to show labels, tick marks or gridlines every 10 units, then the appropriate setting for the
setStepmethod is 10.This method can also be used for a categorical axis. For example, if your X axis displays labels ranging from January to December and you set the
setStepmethod to 2, then the categorical axis will display legends every other month.You can also control a minor interval with the Minor
setStepmethod.If no Step value is specified, will automatically set a Step according to the data provided, you can use this method to read or write this default value.
The value of the
setStepmethod must be greater than the value of the MinorsetStepmethod.To set the step on the major interval to 15 days in a Date categorical Axis:
chart1.getAxisX().getScale().setStep((15 * (DataUnit.Day)));
- See Also:
resetStep
-
setStep
public void setStep(double value)
Specifies the interval of major tick marks and gridlines on the selected scale. It also controls the gap or interval between labels in the selected scale.
Normally, you use this method to control the interval of labels, tick marks and gridlines in the selected scale. For example, if the selected axis scale ranges from 0 to 100 and you want to show labels, tick marks or gridlines every 10 units, then the appropriate setting for the
setStepmethod is 10.This method can also be used for a categorical axis. For example, if your X axis displays labels ranging from January to December and you set the
setStepmethod to 2, then the categorical axis will display legends every other month.You can also control a minor interval with the Minor
setStepmethod.If no Step value is specified, will automatically set a Step according to the data provided, you can use this method to read or write this default value.
The value of the
setStepmethod must be greater than the value of the MinorsetStepmethod.To set the step on the major interval to 15 days in a Date categorical Axis:
chart1.getAxisX().getScale().setStep((15 * (DataUnit.Day)));
- Parameters:
value-- See Also:
resetStep
-
getStepDateTime
public java.util.Date getStepDateTime()
Specifies the interval of major tick marks and gridlines on the selected scale. It also controls the gap or interval between labels in the selected scale.
Normally, you use this method to control the interval of labels, tick marks and gridlines in the selected scale. For example, if the selected axis scale ranges from 0 to 100 and you want to show labels, tick marks or gridlines every 10 units, then the appropriate setting for the
setStepmethod is 10.This method can also be used for a categorical axis. For example, if your X axis displays labels ranging from January to December and you set the
setStepmethod to 2, then the categorical axis will display legends every other month.You can also control a minor interval with the Minor
setStepmethod.If no Step value is specified, will automatically set a Step according to the data provided, you can use this method to read or write this default value.
The value of the
setStepmethod must be greater than the value of the MinorsetStepmethod.To set the step on the major interval to 15 days in a Date categorical Axis:
chart1.getAxisX().getScale().setStep((15 * (DataUnit.Day)));
- See Also:
resetStep
-
setStep
public void setStep(java.util.Date value)
Specifies the interval of major tick marks and gridlines on the selected scale. It also controls the gap or interval between labels in the selected scale.
Normally, you use this method to control the interval of labels, tick marks and gridlines in the selected scale. For example, if the selected axis scale ranges from 0 to 100 and you want to show labels, tick marks or gridlines every 10 units, then the appropriate setting for the
setStepmethod is 10.This method can also be used for a categorical axis. For example, if your X axis displays labels ranging from January to December and you set the
setStepmethod to 2, then the categorical axis will display legends every other month.You can also control a minor interval with the Minor
setStepmethod.If no Step value is specified, will automatically set a Step according to the data provided, you can use this method to read or write this default value.
The value of the
setStepmethod must be greater than the value of the MinorsetStepmethod.To set the step on the major interval to 15 days in a Date categorical Axis:
chart1.getAxisX().getScale().setStep((15 * (DataUnit.Day)));
- Parameters:
value-- See Also:
resetStep
-
getToTimeSpan
public TimeSpan getToTimeSpan()
Gets or sets the To value assigned to the specified axis scale.
The AxisScale To method can be applied to different axis types, so this method can be set to a categorical axis.
If no To value is specified, will automatically set a To value according to the data provided, you can use this method to read or write this default value.
The value of the To method must be greater than the value of the From method.
To set the To value of the primary X axis scale to a datetime:
chart1.getAxisX().getScale().setTo(new DateTime(2013, 2, 28));
- See Also:
resetTo
-
setTo
public void setTo(TimeSpan value)
Gets or sets the To value assigned to the specified axis scale.
The AxisScale To method can be applied to different axis types, so this method can be set to a categorical axis.
If no To value is specified, will automatically set a To value according to the data provided, you can use this method to read or write this default value.
The value of the To method must be greater than the value of the From method.
To set the To value of the primary X axis scale to a datetime:
chart1.getAxisX().getScale().setTo(new DateTime(2013, 2, 28));
- Parameters:
value-- See Also:
resetTo
-
getTo
public DataUnit getTo()
Gets or sets the To value assigned to the specified axis scale.
The AxisScale To method can be applied to different axis types, so this method can be set to a categorical axis.
If no To value is specified, will automatically set a To value according to the data provided, you can use this method to read or write this default value.
The value of the To method must be greater than the value of the From method.
To set the To value of the primary X axis scale to a datetime:
chart1.getAxisX().getScale().setTo(new DateTime(2013, 2, 28));
- See Also:
resetTo
-
setTo
public void setTo(DataUnit value)
Gets or sets the To value assigned to the specified axis scale.
The AxisScale To method can be applied to different axis types, so this method can be set to a categorical axis.
If no To value is specified, will automatically set a To value according to the data provided, you can use this method to read or write this default value.
The value of the To method must be greater than the value of the From method.
To set the To value of the primary X axis scale to a datetime:
chart1.getAxisX().getScale().setTo(new DateTime(2013, 2, 28));
- Parameters:
value-- See Also:
resetTo
-
getToDouble
public double getToDouble()
Gets or sets the To value assigned to the specified axis scale.
The AxisScale To method can be applied to different axis types, so this method can be set to a categorical axis.
If no To value is specified, will automatically set a To value according to the data provided, you can use this method to read or write this default value.
The value of the To method must be greater than the value of the From method.
To set the To value of the primary X axis scale to a datetime:
chart1.getAxisX().getScale().setTo(new DateTime(2013, 2, 28));
- See Also:
resetTo
-
setTo
public void setTo(double value)
Gets or sets the To value assigned to the specified axis scale.
The AxisScale To method can be applied to different axis types, so this method can be set to a categorical axis.
If no To value is specified, will automatically set a To value according to the data provided, you can use this method to read or write this default value.
The value of the To method must be greater than the value of the From method.
To set the To value of the primary X axis scale to a datetime:
chart1.getAxisX().getScale().setTo(new DateTime(2013, 2, 28));
- Parameters:
value-- See Also:
resetTo
-
getToDateTime
public java.util.Date getToDateTime()
Gets or sets the To value assigned to the specified axis scale.
The AxisScale To method can be applied to different axis types, so this method can be set to a categorical axis.
If no To value is specified, will automatically set a To value according to the data provided, you can use this method to read or write this default value.
The value of the To method must be greater than the value of the From method.
To set the To value of the primary X axis scale to a datetime:
chart1.getAxisX().getScale().setTo(new DateTime(2013, 2, 28));
- See Also:
resetTo
-
setTo
public void setTo(java.util.Date value)
Gets or sets the To value assigned to the specified axis scale.
The AxisScale To method can be applied to different axis types, so this method can be set to a categorical axis.
If no To value is specified, will automatically set a To value according to the data provided, you can use this method to read or write this default value.
The value of the To method must be greater than the value of the From method.
To set the To value of the primary X axis scale to a datetime:
chart1.getAxisX().getScale().setTo(new DateTime(2013, 2, 28));
- Parameters:
value-- See Also:
resetTo
-
resetCustomSteps
public void resetCustomSteps()
Set the property CustomSteps to its default value.- See Also:
setCustomSteps
-
resetFirstLabel
public void resetFirstLabel()
Set the property FirstLabel to its default value.- See Also:
setFirstLabel
-
resetFrom
public void resetFrom()
Set the property From to its default value.- See Also:
setFrom
-
resetLabelValue
public void resetLabelValue()
Set the property LabelValue to its default value.- See Also:
setLabelValue
-
resetMinorStep
public void resetMinorStep()
Set the property MinorStep to its default value.- See Also:
setMinorStep
-
resetProportion
public void resetProportion()
Set the property Proportion to its default value.- See Also:
setProportion
-
resetScaleUnit
public void resetScaleUnit()
Set the property ScaleUnit to its default value.- See Also:
setScaleUnit
-
resetStep
public void resetStep()
Set the property Step to its default value.- See Also:
setStep
-
resetTo
public void resetTo()
Set the property To to its default value.- See Also:
setTo
-
-