- java.lang.Object
-
- com.softwarefx.chartfx.server.AxisSectionBase
-
- com.softwarefx.chartfx.server.Axis
-
public class Axis
extends AxisSectionBase
This is the base class for the Axis object.
Axes are one of the most important aspects in a chart since they provide users with visual means to read and analyze data; therefore, a charting tool must provide mechanisms to manipulate axis settings programmatically.
Chart FX automatically configures the chart's axes accommodating the data that was used to populate the chart. This behavior will minimize the initial programming effort of customizing the chart's axes; however, in some cases, programmers will face complex needs like special labeling, scrolling, formatting, and scaling that must be addressed via code. To achieve this, Chart FX provides a powerful object-oriented API so programmers can customize virtually any axis setting.
It's important to be aware that Chart FX supports many different axes: The main Y-Axis, the Secondary Y-Axis and the X-Axis as illustrated in the following figure:
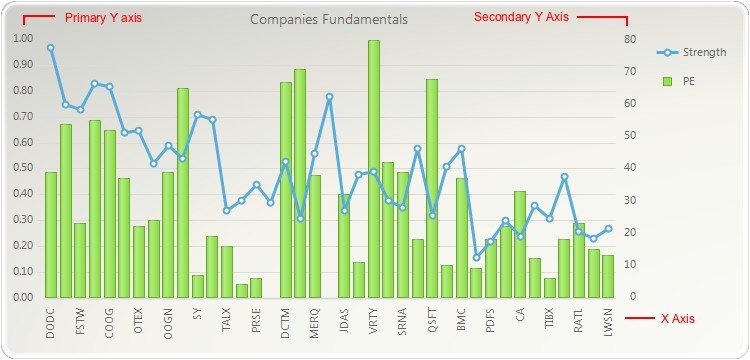
Normally, the X-Axis is a categorical axis (although it can also be a numerical axis in XY Plots) and the Y axes are numerical axes that you can independently control through different methods available in the axis object.
The
setAxesStylemethod of the Chart class is also used to change the style of all the axes surrounding the chart area.
-
-
Nested Class Summary
Nested Classes Modifier and Type Class and Description static classAxis.GetScrollViewArgsDescription goes herestatic interfaceAxis.SetLabelLayoutDelegateListenerDescription goes here
-
Constructor Summary
Constructors Constructor and Description Axis()
-
Method Summary
Methods Modifier and Type Method and Description voidadjustScale()Adjusts the selected axis to "nice" scale values.doublegetBaseline()Gets or sets the baseline of a chart.java.util.List<CustomGridLine>getCustomGridLines()Gets the collection of CustomGridLines that belong to the Chart.double[]getCustomSteps()Allows you to set a custom step for the selected axis.ValueFormatgetDataFormat()Used to format the data displayed on point labels, and tool tips shown at mouseover.intgetFirstLabel()Gets or sets the value used to customize the first label displayed on a selected axis.java.awt.FontgetFont()Allows you to change the label Font attributes of the selected axis.java.util.List<java.lang.String>getKeyLabels()Used to assign a key (short) legend to tickmarks in a categorical axis.shortgetLabelAngle()Sets the text rotation for the labels in the selected axis.java.util.List<java.lang.String>getLabels()Allows you to get or set the tick mark labels for the selected axis.ValueFormatgetLabelsFormat()Used to format the labels displayed on the selected axis.StringTrimminggetLabelTrimming()Gets or sets a StringTrimming value.DataUnitgetLabelValue()Allows you to set and associate text labels to major tick marks in a numerical axis.java.util.DategetLabelValueDateTime()Allows you to set and associate text labels to major tick marks in a numerical axis.doublegetLabelValueDouble()Allows you to set and associate text labels to major tick marks in a numerical axis.TimeSpangetLabelValueTimeSpan()Allows you to set and associate text labels to major tick marks in a numerical axis.LinegetLine()Allows you to apply supported Line class members to a selected axis line.doublegetLineSpacing()Gets or sets a value indicating the LineSpacing for an axis.doublegetLogBase()Description goes hereintgetMarginFromMax()Gets or sets a percentage value of a starting scroll position when the chart is scrollable.intgetMarginFromMin()Gets or sets a value specifying the margin width in pixels before the selected axis min value.DataUnitgetMax()Gets or sets the Max value assigned to the specified axis.java.util.DategetMaxDateTime()Gets or sets the Max value assigned to the specified axis.doublegetMaxDouble()Gets or sets the Max value assigned to the specified axis.intgetMaxSizePercentage()Allows you to specify the maximum percentage of the chart area the AxisX labels may occupy.TimeSpangetMaxTimeSpan()Gets or sets the Max value assigned to the specified axis.DataUnitgetMin()Gets or sets the Min value assigned to the specified axis.java.util.DategetMinDateTime()Gets or sets the Min value assigned to the specified axis.doublegetMinDouble()Gets or sets the Min value assigned to the specified axis.DataUnitgetMinorStep()Specifies the increment you want between minor tick marks and minor gridlines (if they are displayed) on the selected axis.java.util.DategetMinorStepDateTime()Specifies the increment you want between minor tick marks and minor gridlines (if they are displayed) on the selected axis.doublegetMinorStepDouble()Specifies the increment you want between minor tick marks and minor gridlines (if they are displayed) on the selected axis.TimeSpangetMinorStepTimeSpan()Specifies the increment you want between minor tick marks and minor gridlines (if they are displayed) on the selected axis.TimeSpangetMinTimeSpan()Gets or sets the Min value assigned to the specified axis.doublegetPixelsPerUnit()Gives you the ability to control how many pixels per unit are in the selected axis.AxisPositiongetPosition()Specifies the placement of the axis labels and tick marks relative to the chart.DataUnitgetScaleUnit()Returns the scale unit of a selected axis.java.util.DategetScaleUnitDateTime()Returns the scale unit of a selected axis.doublegetScaleUnitDouble()Returns the scale unit of a selected axis.TimeSpangetScaleUnitTimeSpan()Returns the scale unit of a selected axis.intgetScrollPosition()Description goes heredoublegetScrollPositionPercentage()Allows you to set the starting percentage scroll position, when a chart is scrollable.intgetScrollPositionPixel()Allows you to set the starting scroll position (in pixels) when a chart is scrollable.intgetScrollSize()Description goes herevoidgetScrollView(Axis.GetScrollViewArgs _p_)Used to retrieve values set by the SetScrollView method.DataUnitgetScrollViewMax()Description goes herejava.util.DategetScrollViewMaxDateTime()Description goes here.doublegetScrollViewMaxDouble()Description goes here.TimeSpangetScrollViewMaxTimeSpan()Description goes here.DataUnitgetScrollViewMin()Description goes herejava.util.DategetScrollViewMinDateTime()Description goes here.doublegetScrollViewMinDouble()Description goes here.TimeSpangetScrollViewMinTimeSpan()Description goes here.java.util.List<AxisSection>getSections()Returns a selected AxisSection object.intgetSeparation()Allows you to specify a gap in pixels between multiple axis.DataUnitgetStep()Specifies the interval of major tick marks and gridlines on the selected axis.java.util.DategetStepDateTime()Specifies the interval of major tick marks and gridlines on the selected axis.doublegetStepDouble()Specifies the interval of major tick marks and gridlines on the selected axis.TimeSpangetStepTimeSpan()Specifies the interval of major tick marks and gridlines on the selected axis.java.util.EnumSet<AxisStyles>getStyle()Allows you to add additional styles to the selected axis.TitlegetTitle()Gets or sets the title for a specific axis.booleanisAutoScale()Description goes herebooleanisAutoScroll()Enables or disables scrolling in an Axis.booleanisForceBaseline()Description goes herebooleanisForceZero()Gets or sets a boolean that determines whether or not to display the minimum value of a numerical axis as zero even if the data minimum value does not start at zero.booleanisHorizontal()Returns a boolean value specifying whether the selected axis is a horizontal or vertical axis.booleanisInverted()Sets a selected numerical axis max value lesser than the min value.booleanisNotify()Used to enable or disable the GetAxisLabel event so you can customize labels on the specified axis.booleanisStaggered()Alternates the level of the axis labels for the selected axis.booleanisVisible()Shows or hides the lines, labels, tick marks and grids for the selected axis.DataUnitpixelToValue(int pixel)Converts a position in pixels in the chart area to its representation on the respective axis.voidresetBaseline()Set the property Baseline to its default value.voidresetFont()Set the property Font to its default value.voidresetForceBaseline()Set the property ForceBaseline to its default value.voidresetInverted()Set the property Inverted to its default value.voidresetLabelAngle()Set the property LabelAngle to its default value.voidresetLabelTrimming()Set the property LabelTrimming to its default value.voidresetLineSpacing()Set the property LineSpacing to its default value.voidresetMarginFromMax()Set the property MarginFromMax to its default value.voidresetMarginFromMin()Set the property MarginFromMin to its default value.voidresetMax()Resets the value of the selected Axis.voidresetMaxSizePercentage()Set the property MaxSizePercentage to its default value.voidresetMin()Resets the value of the selected Axis.voidresetNotify()Set the property Notify to its default value.voidresetPixelsPerUnit()Set the property PixelsPerUnit to its default value.voidresetPosition()Set the property Position to its default value.voidresetScale()Prepares the selected axis to receive new data by resetting scale values.voidresetScale(boolean force)Prepares the selected axis to receive new data by resetting scale values.voidresetScrollPositionPixel()Set the property ScrollPositionPixel to its default value.voidresetSeparation()Set the property Separation to its default value.voidresetStaggered()Set the property Staggered to its default value.voidresetStyle()Set the property Style to its default value.voidresetTotalSizeInPixels()Set the property TotalSizeInPixels to its default value.voidresetVisible()Set the property Visible to its default value.voidresetZoomed()Set the property Zoomed to its default value.voidsetAutoScale(boolean value)Description goes herevoidsetAutoScroll(boolean value)Enables or disables scrolling in an Axis.voidsetBaseline(double value)Gets or sets the baseline of a chart.voidsetCustomSteps(double[] value)Allows you to set a custom step for the selected axis.voidsetFirstLabel(int value)Gets or sets the value used to customize the first label displayed on a selected axis.voidsetFont(java.awt.Font value)Allows you to change the label Font attributes of the selected axis.voidsetForceBaseline(boolean value)Description goes herevoidsetForceZero(boolean value)Gets or sets a boolean that determines whether or not to display the minimum value of a numerical axis as zero even if the data minimum value does not start at zero.voidsetInverted(boolean value)Sets a selected numerical axis max value lesser than the min value.voidsetLabelAngle(short value)Sets the text rotation for the labels in the selected axis.voidsetLabelTrimming(StringTrimming value)Gets or sets a StringTrimming value.voidsetLabelValue(DataUnit value)Allows you to set and associate text labels to major tick marks in a numerical axis.voidsetLabelValue(java.util.Date value)Allows you to set and associate text labels to major tick marks in a numerical axis.voidsetLabelValue(double value)Allows you to set and associate text labels to major tick marks in a numerical axis.voidsetLabelValue(TimeSpan value)Allows you to set and associate text labels to major tick marks in a numerical axis.voidsetLineSpacing(double value)Gets or sets a value indicating the LineSpacing for an axis.voidsetLogBase(double value)Description goes herevoidsetMarginFromMax(int value)Gets or sets a percentage value of a starting scroll position when the chart is scrollable.voidsetMarginFromMin(int value)Gets or sets a value specifying the margin width in pixels before the selected axis min value.voidsetMax(DataUnit value)Gets or sets the Max value assigned to the specified axis.voidsetMax(java.util.Date value)Gets or sets the Max value assigned to the specified axis.voidsetMax(double value)Gets or sets the Max value assigned to the specified axis.voidsetMax(TimeSpan value)Gets or sets the Max value assigned to the specified axis.voidsetMaxSizePercentage(int value)Allows you to specify the maximum percentage of the chart area the AxisX labels may occupy.voidsetMin(DataUnit value)Gets or sets the Min value assigned to the specified axis.voidsetMin(java.util.Date value)Gets or sets the Min value assigned to the specified axis.voidsetMin(double value)Gets or sets the Min value assigned to the specified axis.voidsetMin(TimeSpan value)Gets or sets the Min value assigned to the specified axis.voidsetMinorStep(DataUnit value)Specifies the increment you want between minor tick marks and minor gridlines (if they are displayed) on the selected axis.voidsetMinorStep(java.util.Date value)Specifies the increment you want between minor tick marks and minor gridlines (if they are displayed) on the selected axis.voidsetMinorStep(double value)Specifies the increment you want between minor tick marks and minor gridlines (if they are displayed) on the selected axis.voidsetMinorStep(TimeSpan value)Specifies the increment you want between minor tick marks and minor gridlines (if they are displayed) on the selected axis.voidsetNotify(boolean value)Used to enable or disable the GetAxisLabel event so you can customize labels on the specified axis.voidsetPixelsPerUnit(double value)Gives you the ability to control how many pixels per unit are in the selected axis.voidsetPosition(AxisPosition value)Specifies the placement of the axis labels and tick marks relative to the chart.voidsetScaleUnit(DataUnit value)Returns or Sets the scale unit of a selected axis.voidsetScaleUnit(java.util.Date value)Returns or Sets the scale unit of a selected axis.voidsetScaleUnit(double value)Returns or Sets the scale unit of a selected axis.voidsetScaleUnit(TimeSpan value)Returns or Sets the scale unit of a selected axis.voidsetScrollPosition(int value)Description goes herevoidsetScrollPositionPercentage(double value)Allows you to set the starting percentage scroll position, when a chart is scrollable.voidsetScrollPositionPixel(int value)Allows you to set the starting scroll position (in pixels) when a chart is scrollable.voidsetScrollView(DataUnit min, DataUnit max)Creates a scroll bar to view a portion of the selected axis.voidsetScrollView(java.util.Date min, java.util.Date max)Creates a scroll bar to view a portion of the selected axis.voidsetScrollView(double min, double max)Creates a scroll bar to view a portion of the selected axis.voidsetScrollView(TimeSpan min, TimeSpan max)Creates a scroll bar to view a portion of the selected axis.voidsetSeparation(int value)Allows you to specify a gap in pixels between multiple axis.voidsetStaggered(boolean value)Alternates the level of the axis labels for the selected axis.voidsetStep(DataUnit value)Specifies the interval of major tick marks and gridlines on the selected axis.voidsetStep(java.util.Date value)Specifies the interval of major tick marks and gridlines on the selected axis.voidsetStep(double value)Specifies the interval of major tick marks and gridlines on the selected axis.voidsetStep(TimeSpan value)Specifies the interval of major tick marks and gridlines on the selected axis.voidsetStyle(java.util.EnumSet<AxisStyles> value)Allows you to add additional styles to the selected axis.voidsetTitle(Title value)Gets or sets the title for a specific axis.voidsetVisible(boolean value)Shows or hides the lines, labels, tick marks and grids for the selected axis.intvalueToPixel(DataUnit value)Converts a value to its position in pixels on a selected axis.intvalueToPixel(java.util.Date value)Converts a value to its position in pixels on a selected axis.intvalueToPixel(double value)Converts a value to its position in pixels on a selected axis.intvalueToPixel(TimeSpan value)Converts a value to its position in pixels on a selected axis.voidzoom(DataUnit min, DataUnit max)Allows you to specify a min and max zoom value for a selected axis.voidzoom(java.util.Date min, java.util.Date max)Allows you to specify a min and max zoom value for a selected axis.voidzoom(double min, double max)Allows you to specify a min and max zoom value for a selected axis.voidzoom(TimeSpan min, TimeSpan max)Allows you to specify a min and max zoom value for a selected axis.voidzoomOff()Allows you to ignore any zoom attributes set using the Zoom method and return to the default axis view.-
Methods inherited from class com.softwarefx.chartfx.server.AxisSectionBase
getGrids, getLink, getTextColor, resetTextColor, setTextColor
-
-
-
-
Method Detail
-
isAutoScale
public boolean isAutoScale()
Description goes here
-
setAutoScale
public void setAutoScale(boolean value)
Description goes here- Parameters:
value-
-
isAutoScroll
public boolean isAutoScroll()
Enables or disables scrolling in an Axis.
When the axis is a categorical axis and the number of data points (or tick marks) do not fit in one screen, Chart FX will display a scroll bar so the end user can scroll through the data (maintaining the tick mark separation set with the
setPixelsPerUnitmethod). This is particularly useful when the labels associated with tick marks are long strings but still important to improve chart's readability or when a particular marker separation is important.In some other cases, having a scroll bar associated with the axis is not desired and you can use this method to force Chart FX to display all data points in one screen. If you have a large number of points or long strings associated with tick marks this could affect the chart's readability and you will need to reset the labels associated with the tick marks in the X axis.
This method controls the scroll bar when the axis is a categorical axis. If you want to show a scroll bar for a numerical axis, please refer to the
setPixelsPerUnitmethod or thesetScrollViewmethod.To scroll a chart, you may drag the scroll thumb with your mouse cursor.
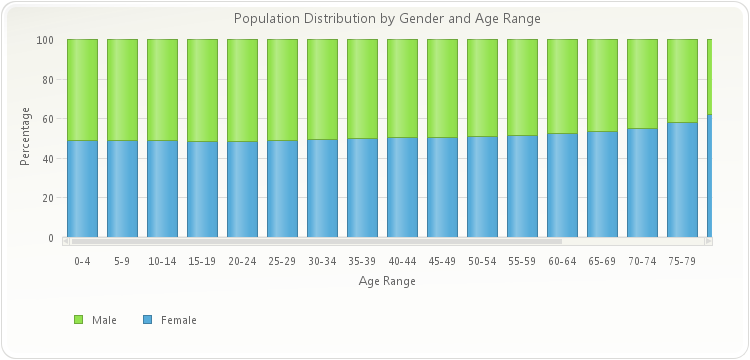
chart1.setGallery(Gallery.BAR);
chart1.getAllSeries().setStacked(Stacked.STACKED_100);
PopulatePopulationData(chart1);
chart1.getTitles().add(new TitleDockable("Population Distribution by Gender and Age Range"));
chart1.getAxisY().getTitle().setText("Percentage");
chart1.getAxisX().getTitle().setText("Age Range");
chart1.getLegendBox().setDock(DockArea.BOTTOM);
chart1.getAxisX().setAutoScroll(true);
public static void PopulatePopulationData(Chart chart1, String fieldNames) { PopulationData[] data = new PopulationData[]{ new PopulationData("0-4", 10471, 10024), new PopulationData("5-9", 9954, 9512), new PopulationData("10-14", 10670, 10167), new PopulationData("15-19", 10871, 10312), new PopulationData("20-24", 10719, 10178), new PopulationData("25-29", 10060, 9744), new PopulationData("30-34", 10021, 9864), new PopulationData("35-39", 10479, 10424), new PopulationData("40-44", 11294, 11454), new PopulationData("45-49", 11080, 11377), new PopulationData("50-54", 9772, 10212), new PopulationData("55-59", 8415, 8944), new PopulationData("60-64", 6203, 6814), new PopulationData("65-69", 4712, 5412), new PopulationData("70-74", 3804, 4697), new PopulationData("75-79", 3094, 4282), new PopulationData("80-84", 2117, 3459), new PopulationData("85-89", 1072, 2135), new PopulationData("90-94", 397, 1034), new PopulationData("95-99", 91, 321), new PopulationData("100+", 12, 58) }; ObjectProvider objProvider = new ObjectProvider(data); chart1.getDataSourceSettings().setDataSource(objProvider); if (fieldNames != "") { List<DataField> removeFields = new ArrayList<DataField>(); List<String> includeFields = Arrays.asList(fieldNames.split(",")); chart1.getDataSourceSettings().fillFromSchema(); for (DataField dataField : chart1.getDataSourceSettings().getDataFields()) { if (dataField.isMeasure() && !includeFields.contains(dataField.getDataPath())) { removeFields.add(dataField); } } for (DataField dataField : removeFields) { chart1.getDataSourceSettings().getDataFields().remove(dataField); } } } public static void PopulatePopulationData(Chart chart1) { PopulatePopulationData(chart1, ""); }public static class PopulationData { public PopulationData(String range, double male, double female) { this.setRange(range); this.setMale(male); this.setFemale(female); } private String privateRange; public final String getRange() { return privateRange; } public final void setRange(String value) { privateRange = value; } private double privateMale; public final double getMale() { return privateMale; } public final void setMale(double value) { privateMale = value; } private double privateFemale; public final double getFemale() { return privateFemale; } public final void setFemale(double value) { privateFemale = value; } }
-
setAutoScroll
public void setAutoScroll(boolean value)
Enables or disables scrolling in an Axis.
When the axis is a categorical axis and the number of data points (or tick marks) do not fit in one screen, Chart FX will display a scroll bar so the end user can scroll through the data (maintaining the tick mark separation set with the
setPixelsPerUnitmethod). This is particularly useful when the labels associated with tick marks are long strings but still important to improve chart's readability or when a particular marker separation is important.In some other cases, having a scroll bar associated with the axis is not desired and you can use this method to force Chart FX to display all data points in one screen. If you have a large number of points or long strings associated with tick marks this could affect the chart's readability and you will need to reset the labels associated with the tick marks in the X axis.
This method controls the scroll bar when the axis is a categorical axis. If you want to show a scroll bar for a numerical axis, please refer to the
setPixelsPerUnitmethod or thesetScrollViewmethod.To scroll a chart, you may drag the scroll thumb with your mouse cursor.
chart1.setGallery(Gallery.BAR);
chart1.getAllSeries().setStacked(Stacked.STACKED_100);
PopulatePopulationData(chart1);
chart1.getTitles().add(new TitleDockable("Population Distribution by Gender and Age Range"));
chart1.getAxisY().getTitle().setText("Percentage");
chart1.getAxisX().getTitle().setText("Age Range");
chart1.getLegendBox().setDock(DockArea.BOTTOM);
chart1.getAxisX().setAutoScroll(true);
public static void PopulatePopulationData(Chart chart1, String fieldNames) { PopulationData[] data = new PopulationData[]{ new PopulationData("0-4", 10471, 10024), new PopulationData("5-9", 9954, 9512), new PopulationData("10-14", 10670, 10167), new PopulationData("15-19", 10871, 10312), new PopulationData("20-24", 10719, 10178), new PopulationData("25-29", 10060, 9744), new PopulationData("30-34", 10021, 9864), new PopulationData("35-39", 10479, 10424), new PopulationData("40-44", 11294, 11454), new PopulationData("45-49", 11080, 11377), new PopulationData("50-54", 9772, 10212), new PopulationData("55-59", 8415, 8944), new PopulationData("60-64", 6203, 6814), new PopulationData("65-69", 4712, 5412), new PopulationData("70-74", 3804, 4697), new PopulationData("75-79", 3094, 4282), new PopulationData("80-84", 2117, 3459), new PopulationData("85-89", 1072, 2135), new PopulationData("90-94", 397, 1034), new PopulationData("95-99", 91, 321), new PopulationData("100+", 12, 58) }; ObjectProvider objProvider = new ObjectProvider(data); chart1.getDataSourceSettings().setDataSource(objProvider); if (fieldNames != "") { List<DataField> removeFields = new ArrayList<DataField>(); List<String> includeFields = Arrays.asList(fieldNames.split(",")); chart1.getDataSourceSettings().fillFromSchema(); for (DataField dataField : chart1.getDataSourceSettings().getDataFields()) { if (dataField.isMeasure() && !includeFields.contains(dataField.getDataPath())) { removeFields.add(dataField); } } for (DataField dataField : removeFields) { chart1.getDataSourceSettings().getDataFields().remove(dataField); } } } public static void PopulatePopulationData(Chart chart1) { PopulatePopulationData(chart1, ""); }public static class PopulationData { public PopulationData(String range, double male, double female) { this.setRange(range); this.setMale(male); this.setFemale(female); } private String privateRange; public final String getRange() { return privateRange; } public final void setRange(String value) { privateRange = value; } private double privateMale; public final double getMale() { return privateMale; } public final void setMale(double value) { privateMale = value; } private double privateFemale; public final double getFemale() { return privateFemale; } public final void setFemale(double value) { privateFemale = value; } }
- Parameters:
value-
-
getBaseline
public double getBaseline()
Gets or sets the baseline of a chart.
By default the base line of the axis is 0.
The baseline separate the positive values from the negative values. On a bar chart, for instance, the values below the baseline will be drawn as an upside-down bar.
To set the baseline of the Y axis to 20000:
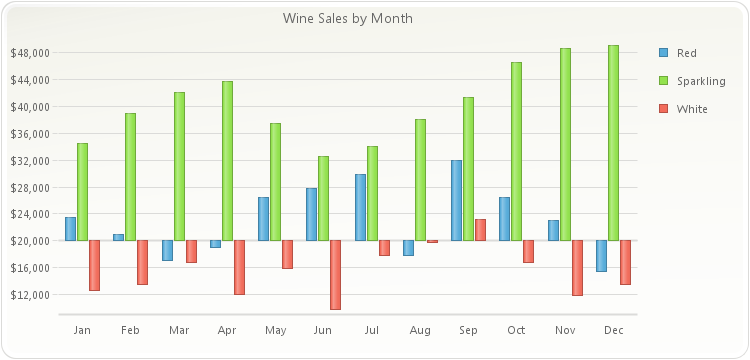
PopulateProductSales(chart1);
chart1.getTitles().add(new TitleDockable("Wine Sales by Month"));
chart1.setGallery(Gallery.BAR);
chart1.getAxisY().getLabelsFormat().setFormat(AxisFormat.CURRENCY);
chart1.getAxisY().setBaseline(20000);
public static void PopulateProductSales(Chart chart1) { ProductSales[] data = new ProductSales[]{ new ProductSales("Jan", 12560, 23400, 34500), new ProductSales("Feb", 13400, 21000, 38900), new ProductSales("Mar", 16700, 17000, 42100), new ProductSales("Apr", 12000, 19020, 43800), new ProductSales("May", 15800, 26500, 37540), new ProductSales("Jun", 9800, 27800, 32580), new ProductSales("Jul", 17800, 29820, 34000), new ProductSales("Aug", 19800, 17800, 38000), new ProductSales("Sep", 23200, 32000, 41300), new ProductSales("Oct", 16700, 26500, 46590), new ProductSales("Nov", 11800, 23000, 48700), new ProductSales("Dec", 13400, 15400, 49100) }; ObjectProvider objProvider = new ObjectProvider(data); chart1.getDataSourceSettings().setDataSource(objProvider); }public static class ProductSales { public ProductSales(String month, double white, double red, double sparkling) { this.setMonth(month); this.setWhite(white); this.setRed(red); this.setSparkling(sparkling); } private String privateMonth; public final String getMonth() { return privateMonth; } public final void setMonth(String value) { privateMonth = value; } private double privateWhite; public final double getWhite() { return privateWhite; } public final void setWhite(double value) { privateWhite = value; } private double privateRed; public final double getRed() { return privateRed; } public final void setRed(double value) { privateRed = value; } private double privateSparkling; public final double getSparkling() { return privateSparkling; } public final void setSparkling(double value) { privateSparkling = value; } }
- See Also:
resetBaseline
-
setBaseline
public void setBaseline(double value)
Gets or sets the baseline of a chart.
By default the base line of the axis is 0.
The baseline separate the positive values from the negative values. On a bar chart, for instance, the values below the baseline will be drawn as an upside-down bar.
To set the baseline of the Y axis to 20000:
PopulateProductSales(chart1);
chart1.getTitles().add(new TitleDockable("Wine Sales by Month"));
chart1.setGallery(Gallery.BAR);
chart1.getAxisY().getLabelsFormat().setFormat(AxisFormat.CURRENCY);
chart1.getAxisY().setBaseline(20000);
public static void PopulateProductSales(Chart chart1) { ProductSales[] data = new ProductSales[]{ new ProductSales("Jan", 12560, 23400, 34500), new ProductSales("Feb", 13400, 21000, 38900), new ProductSales("Mar", 16700, 17000, 42100), new ProductSales("Apr", 12000, 19020, 43800), new ProductSales("May", 15800, 26500, 37540), new ProductSales("Jun", 9800, 27800, 32580), new ProductSales("Jul", 17800, 29820, 34000), new ProductSales("Aug", 19800, 17800, 38000), new ProductSales("Sep", 23200, 32000, 41300), new ProductSales("Oct", 16700, 26500, 46590), new ProductSales("Nov", 11800, 23000, 48700), new ProductSales("Dec", 13400, 15400, 49100) }; ObjectProvider objProvider = new ObjectProvider(data); chart1.getDataSourceSettings().setDataSource(objProvider); }public static class ProductSales { public ProductSales(String month, double white, double red, double sparkling) { this.setMonth(month); this.setWhite(white); this.setRed(red); this.setSparkling(sparkling); } private String privateMonth; public final String getMonth() { return privateMonth; } public final void setMonth(String value) { privateMonth = value; } private double privateWhite; public final double getWhite() { return privateWhite; } public final void setWhite(double value) { privateWhite = value; } private double privateRed; public final double getRed() { return privateRed; } public final void setRed(double value) { privateRed = value; } private double privateSparkling; public final double getSparkling() { return privateSparkling; } public final void setSparkling(double value) { privateSparkling = value; } }
- Parameters:
value-- See Also:
resetBaseline
-
getCustomGridLines
public java.util.List<CustomGridLine> getCustomGridLines()
Gets the collection of CustomGridLines that belong to the Chart.
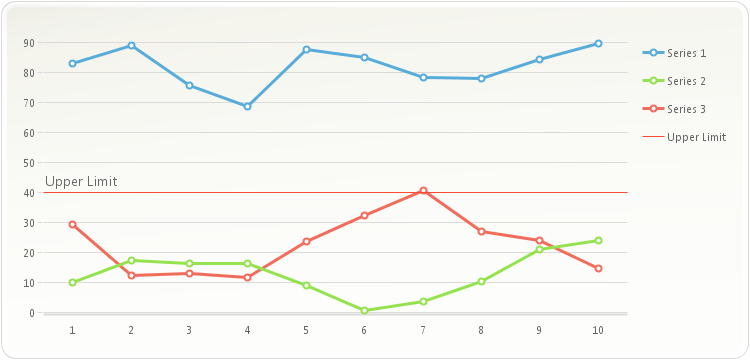
CustomGridLine c1;
c1 = new CustomGridLine(40.0, "Upper Limit");
chart1.getAxisY().getCustomGridLines().add(c1);
-
getCustomSteps
public double[] getCustomSteps()
Allows you to set a custom step for the selected axis.
The
setCustomStepsmethod holds an array of numbers (double) that specifies a series of step values for the selected axis.The step applied to the axis will begin to cycle if your chart contains enough points. For example, if you set the CustomStep to (5,10,20,30) the axis step would look like the following:
0,5,15,35,65,70,80,100,130,135,...
Below, the Y Axis custom step has been set to {5, 10, 20, 30}:
double[] myStep;
myStep = new double[] {5, 10, 20, 30};
chart1.getAxisY().setCustomSteps(myStep);
In the following sample a custom step is set for the Y axis:
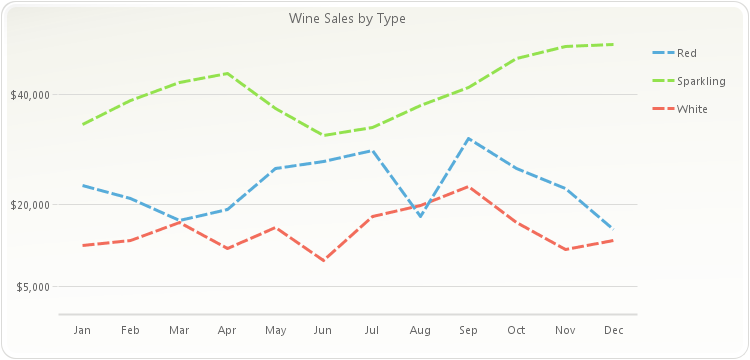
PopulateProductSales(chart1);
chart1.getTitles().add(new TitleDockable("Wine Sales by Type"));
chart1.getAxisY().getLabelsFormat().setFormat(AxisFormat.CURRENCY);
chart1.setGallery(Gallery.LINES);
chart1.getAllSeries().setMarkerShape(MarkerShape.NONE);
chart1.getAllSeries().getLine().setStyle(DashStyle.DASH);
double[] myStep;
myStep = new double[] {5000, 15000, 20000, 40000, 55000};
chart1.getAxisY().setCustomSteps(myStep);
public static void PopulateProductSales(Chart chart1) { ProductSales[] data = new ProductSales[]{ new ProductSales("Jan", 12560, 23400, 34500), new ProductSales("Feb", 13400, 21000, 38900), new ProductSales("Mar", 16700, 17000, 42100), new ProductSales("Apr", 12000, 19020, 43800), new ProductSales("May", 15800, 26500, 37540), new ProductSales("Jun", 9800, 27800, 32580), new ProductSales("Jul", 17800, 29820, 34000), new ProductSales("Aug", 19800, 17800, 38000), new ProductSales("Sep", 23200, 32000, 41300), new ProductSales("Oct", 16700, 26500, 46590), new ProductSales("Nov", 11800, 23000, 48700), new ProductSales("Dec", 13400, 15400, 49100) }; ObjectProvider objProvider = new ObjectProvider(data); chart1.getDataSourceSettings().setDataSource(objProvider); }public static class ProductSales { public ProductSales(String month, double white, double red, double sparkling) { this.setMonth(month); this.setWhite(white); this.setRed(red); this.setSparkling(sparkling); } private String privateMonth; public final String getMonth() { return privateMonth; } public final void setMonth(String value) { privateMonth = value; } private double privateWhite; public final double getWhite() { return privateWhite; } public final void setWhite(double value) { privateWhite = value; } private double privateRed; public final double getRed() { return privateRed; } public final void setRed(double value) { privateRed = value; } private double privateSparkling; public final double getSparkling() { return privateSparkling; } public final void setSparkling(double value) { privateSparkling = value; } }
-
setCustomSteps
public void setCustomSteps(double[] value)
Allows you to set a custom step for the selected axis.
The
setCustomStepsmethod holds an array of numbers (double) that specifies a series of step values for the selected axis.The step applied to the axis will begin to cycle if your chart contains enough points. For example, if you set the CustomStep to (5,10,20,30) the axis step would look like the following:
0,5,15,35,65,70,80,100,130,135,...
Below, the Y Axis custom step has been set to {5, 10, 20, 30}:
double[] myStep;
myStep = new double[] {5, 10, 20, 30};
chart1.getAxisY().setCustomSteps(myStep);
In the following sample a custom step is set for the Y axis:
PopulateProductSales(chart1);
chart1.getTitles().add(new TitleDockable("Wine Sales by Type"));
chart1.getAxisY().getLabelsFormat().setFormat(AxisFormat.CURRENCY);
chart1.setGallery(Gallery.LINES);
chart1.getAllSeries().setMarkerShape(MarkerShape.NONE);
chart1.getAllSeries().getLine().setStyle(DashStyle.DASH);
double[] myStep;
myStep = new double[] {5000, 15000, 20000, 40000, 55000};
chart1.getAxisY().setCustomSteps(myStep);
public static void PopulateProductSales(Chart chart1) { ProductSales[] data = new ProductSales[]{ new ProductSales("Jan", 12560, 23400, 34500), new ProductSales("Feb", 13400, 21000, 38900), new ProductSales("Mar", 16700, 17000, 42100), new ProductSales("Apr", 12000, 19020, 43800), new ProductSales("May", 15800, 26500, 37540), new ProductSales("Jun", 9800, 27800, 32580), new ProductSales("Jul", 17800, 29820, 34000), new ProductSales("Aug", 19800, 17800, 38000), new ProductSales("Sep", 23200, 32000, 41300), new ProductSales("Oct", 16700, 26500, 46590), new ProductSales("Nov", 11800, 23000, 48700), new ProductSales("Dec", 13400, 15400, 49100) }; ObjectProvider objProvider = new ObjectProvider(data); chart1.getDataSourceSettings().setDataSource(objProvider); }public static class ProductSales { public ProductSales(String month, double white, double red, double sparkling) { this.setMonth(month); this.setWhite(white); this.setRed(red); this.setSparkling(sparkling); } private String privateMonth; public final String getMonth() { return privateMonth; } public final void setMonth(String value) { privateMonth = value; } private double privateWhite; public final double getWhite() { return privateWhite; } public final void setWhite(double value) { privateWhite = value; } private double privateRed; public final double getRed() { return privateRed; } public final void setRed(double value) { privateRed = value; } private double privateSparkling; public final double getSparkling() { return privateSparkling; } public final void setSparkling(double value) { privateSparkling = value; } }
- Parameters:
value-
-
getDataFormat
public ValueFormat getDataFormat()
Used to format the data displayed on point labels, and tool tips shown at mouseover.
chart1.getAxisY().getDataFormat().setFormat(AxisFormat.CURRENCY);
-
getFirstLabel
public int getFirstLabel()
Gets or sets the value used to customize the first label displayed on a selected axis.
The setting must be an integer specifying where you want labels to begin. The axis will then follow the
setStepassociated with it to display subsequent labels.When using this method in the X Axis of a chart with values ranging from 0 to 1, the axis'
setMinorStepDateTimeis used to calculate which label is the first, second, third, etc. When X Axis values range bigger than 1, then the axissetStepis used for this calculation.Below, the first label in the X-Axis is set to 3:
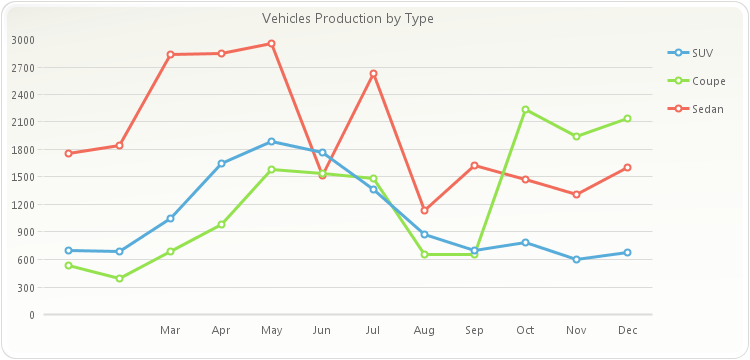
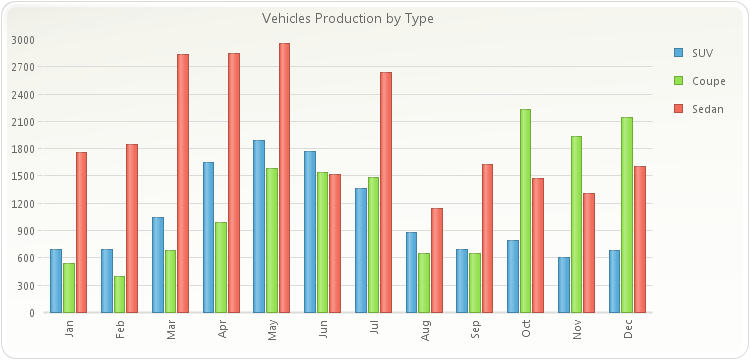
PopulateCarProduction(chart1);
chart1.getTitles().add(new TitleDockable("Vehicles Production by Type"));
chart1.getAxisX().setFirstLabel(3);
public static void PopulateCarProduction(Chart chart1) { CarProduction[] production = new CarProduction[] { new CarProduction("Jan", 1760, 535, 695 ) , new CarProduction("Feb", 1849, 395, 688 ) , new CarProduction("Mar", 2831, 685, 1047 ) , new CarProduction("Apr", 2851, 984, 1652 ) , new CarProduction("May", 2961, 1579, 1889 ) , new CarProduction("Jun", 1519, 1539, 1766 ) , new CarProduction("Jul", 2633, 1489, 1361 ) , new CarProduction("Aug", 1140, 650, 874 ) , new CarProduction("Sep", 1626, 653, 693 ) , new CarProduction("Oct", 1478, 2236, 786 ) , new CarProduction("Nov", 1306, 1937, 599 ) , new CarProduction("Dec", 1607, 2138, 678 ) }; ObjectProvider objProvider = new ObjectProvider(production); chart1.getDataSourceSettings().setDataSource(objProvider); }public static class CarProduction { private CarProduction(String month, int sedan, int coupe, int SUV) { this.setMonth(month); this.setSedan(sedan); this.setCoupe(coupe); this.setSUV(SUV); } private String privateMonth; public final String getMonth() { return privateMonth; } public final void setMonth(String value) { privateMonth = value; } private int privateSedan; public final int getSedan() { return privateSedan; } public final void setSedan(int value) { privateSedan = value; } private int privateCoupe; public final int getCoupe() { return privateCoupe; } public final void setCoupe(int value) { privateCoupe = value; } private int privateSUV; public final int getSUV() { return privateSUV; } public final void setSUV(int value) { privateSUV = value; } }
-
setFirstLabel
public void setFirstLabel(int value)
Gets or sets the value used to customize the first label displayed on a selected axis.
The setting must be an integer specifying where you want labels to begin. The axis will then follow the
setStepassociated with it to display subsequent labels.When using this method in the X Axis of a chart with values ranging from 0 to 1, the axis'
setMinorStepDateTimeis used to calculate which label is the first, second, third, etc. When X Axis values range bigger than 1, then the axissetStepis used for this calculation.Below, the first label in the X-Axis is set to 3:
PopulateCarProduction(chart1);
chart1.getTitles().add(new TitleDockable("Vehicles Production by Type"));
chart1.getAxisX().setFirstLabel(3);
public static void PopulateCarProduction(Chart chart1) { CarProduction[] production = new CarProduction[] { new CarProduction("Jan", 1760, 535, 695 ) , new CarProduction("Feb", 1849, 395, 688 ) , new CarProduction("Mar", 2831, 685, 1047 ) , new CarProduction("Apr", 2851, 984, 1652 ) , new CarProduction("May", 2961, 1579, 1889 ) , new CarProduction("Jun", 1519, 1539, 1766 ) , new CarProduction("Jul", 2633, 1489, 1361 ) , new CarProduction("Aug", 1140, 650, 874 ) , new CarProduction("Sep", 1626, 653, 693 ) , new CarProduction("Oct", 1478, 2236, 786 ) , new CarProduction("Nov", 1306, 1937, 599 ) , new CarProduction("Dec", 1607, 2138, 678 ) }; ObjectProvider objProvider = new ObjectProvider(production); chart1.getDataSourceSettings().setDataSource(objProvider); }public static class CarProduction { private CarProduction(String month, int sedan, int coupe, int SUV) { this.setMonth(month); this.setSedan(sedan); this.setCoupe(coupe); this.setSUV(SUV); } private String privateMonth; public final String getMonth() { return privateMonth; } public final void setMonth(String value) { privateMonth = value; } private int privateSedan; public final int getSedan() { return privateSedan; } public final void setSedan(int value) { privateSedan = value; } private int privateCoupe; public final int getCoupe() { return privateCoupe; } public final void setCoupe(int value) { privateCoupe = value; } private int privateSUV; public final int getSUV() { return privateSUV; } public final void setSUV(int value) { privateSUV = value; } }
- Parameters:
value-
-
getFont
public java.awt.Font getFont()
Allows you to change the label Font attributes of the selected axis.
The
setFontmethod is used to change the font settings for the labels in the selected axis; if you're trying to change the font settings for the axis title, please refer to thesetFontmethod of theTitleobject.When setting a font in Chart FX, you must create a new font object with the desired attributes and assign that object to the desired chart element every time you want to change the font.
For more information regarding the Font type, please refer to the Java Documentation.
Below, the Y axis labels font is set to "Arial" 14:
If you want to change the main Y axis labels font settings:
PopulateCarProduction(chart1);
chart1.getAxisY().setFont(new java.awt.Font("Arial",java.awt.Font.PLAIN, 14));
public static void PopulateCarProduction(Chart chart1) { CarProduction[] production = new CarProduction[] { new CarProduction("Jan", 1760, 535, 695 ) , new CarProduction("Feb", 1849, 395, 688 ) , new CarProduction("Mar", 2831, 685, 1047 ) , new CarProduction("Apr", 2851, 984, 1652 ) , new CarProduction("May", 2961, 1579, 1889 ) , new CarProduction("Jun", 1519, 1539, 1766 ) , new CarProduction("Jul", 2633, 1489, 1361 ) , new CarProduction("Aug", 1140, 650, 874 ) , new CarProduction("Sep", 1626, 653, 693 ) , new CarProduction("Oct", 1478, 2236, 786 ) , new CarProduction("Nov", 1306, 1937, 599 ) , new CarProduction("Dec", 1607, 2138, 678 ) }; ObjectProvider objProvider = new ObjectProvider(production); chart1.getDataSourceSettings().setDataSource(objProvider); }public static class CarProduction { private CarProduction(String month, int sedan, int coupe, int SUV) { this.setMonth(month); this.setSedan(sedan); this.setCoupe(coupe); this.setSUV(SUV); } private String privateMonth; public final String getMonth() { return privateMonth; } public final void setMonth(String value) { privateMonth = value; } private int privateSedan; public final int getSedan() { return privateSedan; } public final void setSedan(int value) { privateSedan = value; } private int privateCoupe; public final int getCoupe() { return privateCoupe; } public final void setCoupe(int value) { privateCoupe = value; } private int privateSUV; public final int getSUV() { return privateSUV; } public final void setSUV(int value) { privateSUV = value; } }
- See Also:
resetFont
-
setFont
public void setFont(java.awt.Font value)
Allows you to change the label Font attributes of the selected axis.
The
setFontmethod is used to change the font settings for the labels in the selected axis; if you're trying to change the font settings for the axis title, please refer to thesetFontmethod of theTitleobject.When setting a font in Chart FX, you must create a new font object with the desired attributes and assign that object to the desired chart element every time you want to change the font.
For more information regarding the Font type, please refer to the Java Documentation.
Below, the Y axis labels font is set to "Arial" 14:
If you want to change the main Y axis labels font settings:
PopulateCarProduction(chart1);
chart1.getAxisY().setFont(new java.awt.Font("Arial",java.awt.Font.PLAIN, 14));
public static void PopulateCarProduction(Chart chart1) { CarProduction[] production = new CarProduction[] { new CarProduction("Jan", 1760, 535, 695 ) , new CarProduction("Feb", 1849, 395, 688 ) , new CarProduction("Mar", 2831, 685, 1047 ) , new CarProduction("Apr", 2851, 984, 1652 ) , new CarProduction("May", 2961, 1579, 1889 ) , new CarProduction("Jun", 1519, 1539, 1766 ) , new CarProduction("Jul", 2633, 1489, 1361 ) , new CarProduction("Aug", 1140, 650, 874 ) , new CarProduction("Sep", 1626, 653, 693 ) , new CarProduction("Oct", 1478, 2236, 786 ) , new CarProduction("Nov", 1306, 1937, 599 ) , new CarProduction("Dec", 1607, 2138, 678 ) }; ObjectProvider objProvider = new ObjectProvider(production); chart1.getDataSourceSettings().setDataSource(objProvider); }public static class CarProduction { private CarProduction(String month, int sedan, int coupe, int SUV) { this.setMonth(month); this.setSedan(sedan); this.setCoupe(coupe); this.setSUV(SUV); } private String privateMonth; public final String getMonth() { return privateMonth; } public final void setMonth(String value) { privateMonth = value; } private int privateSedan; public final int getSedan() { return privateSedan; } public final void setSedan(int value) { privateSedan = value; } private int privateCoupe; public final int getCoupe() { return privateCoupe; } public final void setCoupe(int value) { privateCoupe = value; } private int privateSUV; public final int getSUV() { return privateSUV; } public final void setSUV(int value) { privateSUV = value; } }
- Parameters:
value-- See Also:
resetFont
-
isForceBaseline
public boolean isForceBaseline()
Description goes here
-
setForceBaseline
public void setForceBaseline(boolean value)
Description goes here- Parameters:
value-
-
isForceZero
public boolean isForceZero()
Gets or sets a boolean that determines whether or not to display the minimum value of a numerical axis as zero even if the data minimum value does not start at zero.
By default, Chart FX will set the minimum value of a numerical axis to zero even if the data set starts at a greater value. If you want Chart FX to automatically set the minimum value of the axis to the minimum value in the data passed, set this method to false.
This method applies to numerical axes only.
To force Chart FX to set the minimum value of the Y axis to the minimum value passed to the chart.
chart1.getAxisY().setForceZero(false);
- See Also:
resetForceZero
-
setForceZero
public void setForceZero(boolean value)
Gets or sets a boolean that determines whether or not to display the minimum value of a numerical axis as zero even if the data minimum value does not start at zero.
By default, Chart FX will set the minimum value of a numerical axis to zero even if the data set starts at a greater value. If you want Chart FX to automatically set the minimum value of the axis to the minimum value in the data passed, set this method to false.
This method applies to numerical axes only.
To force Chart FX to set the minimum value of the Y axis to the minimum value passed to the chart.
chart1.getAxisY().setForceZero(false);
- Parameters:
value-- See Also:
resetForceZero
-
isHorizontal
public boolean isHorizontal()
Returns a boolean value specifying whether the selected axis is a horizontal or vertical axis.
boolean isHorz;
isHorz = chart1.getAxesX().get(5).getHorizontal();
-
isInverted
public boolean isInverted()
Sets a selected numerical axis max value lesser than the min value.
This method should be applied to a numerical axis. Assignment to categorical axes will not have any effect.
This method can only be applied to the X Axis in an XY plot chart. In an XY plot, the X Axis is a numerical axis rather than categorical.
When a selected axis is inverted, the alignment of the categorical axis of the chart will be reversed to make the chart more readable.
Below, the Y Axis is set to be inverted:
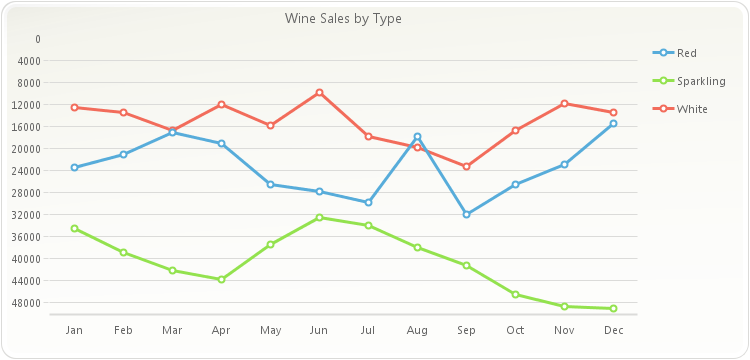
PopulateProductSales(chart1);
chart1.getTitles().add(new TitleDockable("Wine Sales by Type"));
chart1.getAxisY().setInverted(true);
public static void PopulateProductSales(Chart chart1) { ProductSales[] data = new ProductSales[]{ new ProductSales("Jan", 12560, 23400, 34500), new ProductSales("Feb", 13400, 21000, 38900), new ProductSales("Mar", 16700, 17000, 42100), new ProductSales("Apr", 12000, 19020, 43800), new ProductSales("May", 15800, 26500, 37540), new ProductSales("Jun", 9800, 27800, 32580), new ProductSales("Jul", 17800, 29820, 34000), new ProductSales("Aug", 19800, 17800, 38000), new ProductSales("Sep", 23200, 32000, 41300), new ProductSales("Oct", 16700, 26500, 46590), new ProductSales("Nov", 11800, 23000, 48700), new ProductSales("Dec", 13400, 15400, 49100) }; ObjectProvider objProvider = new ObjectProvider(data); chart1.getDataSourceSettings().setDataSource(objProvider); }public static class ProductSales { public ProductSales(String month, double white, double red, double sparkling) { this.setMonth(month); this.setWhite(white); this.setRed(red); this.setSparkling(sparkling); } private String privateMonth; public final String getMonth() { return privateMonth; } public final void setMonth(String value) { privateMonth = value; } private double privateWhite; public final double getWhite() { return privateWhite; } public final void setWhite(double value) { privateWhite = value; } private double privateRed; public final double getRed() { return privateRed; } public final void setRed(double value) { privateRed = value; } private double privateSparkling; public final double getSparkling() { return privateSparkling; } public final void setSparkling(double value) { privateSparkling = value; } }
- See Also:
resetInverted
-
setInverted
public void setInverted(boolean value)
Sets a selected numerical axis max value lesser than the min value.
This method should be applied to a numerical axis. Assignment to categorical axes will not have any effect.
This method can only be applied to the X Axis in an XY plot chart. In an XY plot, the X Axis is a numerical axis rather than categorical.
When a selected axis is inverted, the alignment of the categorical axis of the chart will be reversed to make the chart more readable.
Below, the Y Axis is set to be inverted:
PopulateProductSales(chart1);
chart1.getTitles().add(new TitleDockable("Wine Sales by Type"));
chart1.getAxisY().setInverted(true);
public static void PopulateProductSales(Chart chart1) { ProductSales[] data = new ProductSales[]{ new ProductSales("Jan", 12560, 23400, 34500), new ProductSales("Feb", 13400, 21000, 38900), new ProductSales("Mar", 16700, 17000, 42100), new ProductSales("Apr", 12000, 19020, 43800), new ProductSales("May", 15800, 26500, 37540), new ProductSales("Jun", 9800, 27800, 32580), new ProductSales("Jul", 17800, 29820, 34000), new ProductSales("Aug", 19800, 17800, 38000), new ProductSales("Sep", 23200, 32000, 41300), new ProductSales("Oct", 16700, 26500, 46590), new ProductSales("Nov", 11800, 23000, 48700), new ProductSales("Dec", 13400, 15400, 49100) }; ObjectProvider objProvider = new ObjectProvider(data); chart1.getDataSourceSettings().setDataSource(objProvider); }public static class ProductSales { public ProductSales(String month, double white, double red, double sparkling) { this.setMonth(month); this.setWhite(white); this.setRed(red); this.setSparkling(sparkling); } private String privateMonth; public final String getMonth() { return privateMonth; } public final void setMonth(String value) { privateMonth = value; } private double privateWhite; public final double getWhite() { return privateWhite; } public final void setWhite(double value) { privateWhite = value; } private double privateRed; public final double getRed() { return privateRed; } public final void setRed(double value) { privateRed = value; } private double privateSparkling; public final double getSparkling() { return privateSparkling; } public final void setSparkling(double value) { privateSparkling = value; } }
- Parameters:
value-- See Also:
resetInverted
-
getKeyLabels
public java.util.List<java.lang.String> getKeyLabels()
Used to assign a key (short) legend to tickmarks in a categorical axis.
chart1.getAxisX().getKeyLabels().set(0, "Jan");
-
getLabelAngle
public short getLabelAngle()
Sets the text rotation for the labels in the selected axis.
This method uses an integer (degrees) ranging from [-90,90], depending on the rotation angle you want to set. Set this method to 90 to show labels vertically.
In order to set this method, you must make sure that the font type associated with the axis is a True Type Font.
Use a positive number to rotate the labels from lower left to upper right. Use negative degrees to rotate the text from upper left to lower right.
If you would like to change the angle of PointLabels, you can use the
setAnglemethod of thePointLabelAttributesclass.Below, the X axis label angle is set to 90:
PopulateCarProduction(chart1);
chart1.getTitles().add(new TitleDockable("Vehicles Production by Type"));
chart1.setGallery(Gallery.BAR);
chart1.getAxisX().setLabelAngle((short)90);
public static void PopulateCarProduction(Chart chart1) { CarProduction[] production = new CarProduction[] { new CarProduction("Jan", 1760, 535, 695 ) , new CarProduction("Feb", 1849, 395, 688 ) , new CarProduction("Mar", 2831, 685, 1047 ) , new CarProduction("Apr", 2851, 984, 1652 ) , new CarProduction("May", 2961, 1579, 1889 ) , new CarProduction("Jun", 1519, 1539, 1766 ) , new CarProduction("Jul", 2633, 1489, 1361 ) , new CarProduction("Aug", 1140, 650, 874 ) , new CarProduction("Sep", 1626, 653, 693 ) , new CarProduction("Oct", 1478, 2236, 786 ) , new CarProduction("Nov", 1306, 1937, 599 ) , new CarProduction("Dec", 1607, 2138, 678 ) }; ObjectProvider objProvider = new ObjectProvider(production); chart1.getDataSourceSettings().setDataSource(objProvider); }public static class CarProduction { private CarProduction(String month, int sedan, int coupe, int SUV) { this.setMonth(month); this.setSedan(sedan); this.setCoupe(coupe); this.setSUV(SUV); } private String privateMonth; public final String getMonth() { return privateMonth; } public final void setMonth(String value) { privateMonth = value; } private int privateSedan; public final int getSedan() { return privateSedan; } public final void setSedan(int value) { privateSedan = value; } private int privateCoupe; public final int getCoupe() { return privateCoupe; } public final void setCoupe(int value) { privateCoupe = value; } private int privateSUV; public final int getSUV() { return privateSUV; } public final void setSUV(int value) { privateSUV = value; } }
- See Also:
resetLabelAngle
-
setLabelAngle
public void setLabelAngle(short value)
Sets the text rotation for the labels in the selected axis.
This method uses an integer (degrees) ranging from [-90,90], depending on the rotation angle you want to set. Set this method to 90 to show labels vertically.
In order to set this method, you must make sure that the font type associated with the axis is a True Type Font.
Use a positive number to rotate the labels from lower left to upper right. Use negative degrees to rotate the text from upper left to lower right.
If you would like to change the angle of PointLabels, you can use the
setAnglemethod of thePointLabelAttributesclass.Below, the X axis label angle is set to 90:
PopulateCarProduction(chart1);
chart1.getTitles().add(new TitleDockable("Vehicles Production by Type"));
chart1.setGallery(Gallery.BAR);
chart1.getAxisX().setLabelAngle((short)90);
public static void PopulateCarProduction(Chart chart1) { CarProduction[] production = new CarProduction[] { new CarProduction("Jan", 1760, 535, 695 ) , new CarProduction("Feb", 1849, 395, 688 ) , new CarProduction("Mar", 2831, 685, 1047 ) , new CarProduction("Apr", 2851, 984, 1652 ) , new CarProduction("May", 2961, 1579, 1889 ) , new CarProduction("Jun", 1519, 1539, 1766 ) , new CarProduction("Jul", 2633, 1489, 1361 ) , new CarProduction("Aug", 1140, 650, 874 ) , new CarProduction("Sep", 1626, 653, 693 ) , new CarProduction("Oct", 1478, 2236, 786 ) , new CarProduction("Nov", 1306, 1937, 599 ) , new CarProduction("Dec", 1607, 2138, 678 ) }; ObjectProvider objProvider = new ObjectProvider(production); chart1.getDataSourceSettings().setDataSource(objProvider); }public static class CarProduction { private CarProduction(String month, int sedan, int coupe, int SUV) { this.setMonth(month); this.setSedan(sedan); this.setCoupe(coupe); this.setSUV(SUV); } private String privateMonth; public final String getMonth() { return privateMonth; } public final void setMonth(String value) { privateMonth = value; } private int privateSedan; public final int getSedan() { return privateSedan; } public final void setSedan(int value) { privateSedan = value; } private int privateCoupe; public final int getCoupe() { return privateCoupe; } public final void setCoupe(int value) { privateCoupe = value; } private int privateSUV; public final int getSUV() { return privateSUV; } public final void setSUV(int value) { privateSUV = value; } }
- Parameters:
value-- See Also:
resetLabelAngle
-
getLabelTrimming
public StringTrimming getLabelTrimming()
Gets or sets a StringTrimming value.
The
setLabelTrimmingmethod trims characters from a string that does not completely fit into a layout rectangle.- See Also:
resetLabelTrimming
-
setLabelTrimming
public void setLabelTrimming(StringTrimming value)
Gets or sets a StringTrimming value.
The
setLabelTrimmingmethod trims characters from a string that does not completely fit into a layout rectangle.- Parameters:
value-- See Also:
resetLabelTrimming
-
getLabelValueTimeSpan
public TimeSpan getLabelValueTimeSpan()
Allows you to set and associate text labels to major tick marks in a numerical axis. This property can get or set the LabelValue assigned to any of the axes.
Normally, labels in a numerical axis are automatically controlled and displayed according to the
setMin,setMaxandsetStepmethods. In some cases, you'll need to associate text labels with a numerical axis (using thesetLabelsmethod), but when any of the scale values (Min, Max, Step, etc) change, these labels will no longer serve their purpose as the tick marks will be recalculated according to scale settings.For example, if you have a chart where the Y axis ranges from Min=0 to Max=100 and Step=25, you'll have 4 tick marks on 25, 50, 75 and 100. By default Chart FX will display numbers (as labels) associated with each tick mark.
Now let's say you want to associate text labels (instead of the number) with each tick mark in the Y axis and you use the
setLabelsmethod to set the following text labels: "Twenty-Five", "Fifty", "Seventy-Five", "One Hundred".When you do this, everything will work out fine and the 4 tick marks will be labeled accordingly; however, if during the execution of your program or through user interaction, the Step suddenly changes from 25 to 12.5, you'll have 8 tick marks instead of 4 because you used the
setLabelsmethod with indexes 0, 1, 2 and 3, the "Fifty" tickmark will no longer correspond to the 50 value.If you would have set the
setLabelValuemethod to 25, when the Step changes from 25 to 12.5 Chart FXwill label every other tick mark and the labels will correspond to their initial setting.Label visual attributes like rotation, color and font are also accessible through the
setLabelAngle,setTextColor, andsetFontmethods, respectively.To set a LabelValue of 25 for the primary Y axis:
chart1.getAxisY().setLabelValue(25);
-
setLabelValue
public void setLabelValue(TimeSpan value)
Allows you to set and associate text labels to major tick marks in a numerical axis. This property can get or set the LabelValue assigned to any of the axes.
Normally, labels in a numerical axis are automatically controlled and displayed according to the
setMin,setMaxandsetStepmethods. In some cases, you'll need to associate text labels with a numerical axis (using thesetLabelsmethod), but when any of the scale values (Min, Max, Step, etc) change, these labels will no longer serve their purpose as the tick marks will be recalculated according to scale settings.For example, if you have a chart where the Y axis ranges from Min=0 to Max=100 and Step=25, you'll have 4 tick marks on 25, 50, 75 and 100. By default Chart FX will display numbers (as labels) associated with each tick mark.
Now let's say you want to associate text labels (instead of the number) with each tick mark in the Y axis and you use the
setLabelsmethod to set the following text labels: "Twenty-Five", "Fifty", "Seventy-Five", "One Hundred".When you do this, everything will work out fine and the 4 tick marks will be labeled accordingly; however, if during the execution of your program or through user interaction, the Step suddenly changes from 25 to 12.5, you'll have 8 tick marks instead of 4 because you used the
setLabelsmethod with indexes 0, 1, 2 and 3, the "Fifty" tickmark will no longer correspond to the 50 value.If you would have set the
setLabelValuemethod to 25, when the Step changes from 25 to 12.5 Chart FXwill label every other tick mark and the labels will correspond to their initial setting.Label visual attributes like rotation, color and font are also accessible through the
setLabelAngle,setTextColor, andsetFontmethods, respectively.To set a LabelValue of 25 for the primary Y axis:
chart1.getAxisY().setLabelValue(25);
- Parameters:
value-
-
getLabelValue
public DataUnit getLabelValue()
Allows you to set and associate text labels to major tick marks in a numerical axis. This property can get or set the LabelValue assigned to any of the axes.
Normally, labels in a numerical axis are automatically controlled and displayed according to the
setMin,setMaxandsetStepmethods. In some cases, you'll need to associate text labels with a numerical axis (using thesetLabelsmethod), but when any of the scale values (Min, Max, Step, etc) change, these labels will no longer serve their purpose as the tick marks will be recalculated according to scale settings.For example, if you have a chart where the Y axis ranges from Min=0 to Max=100 and Step=25, you'll have 4 tick marks on 25, 50, 75 and 100. By default Chart FX will display numbers (as labels) associated with each tick mark.
Now let's say you want to associate text labels (instead of the number) with each tick mark in the Y axis and you use the
setLabelsmethod to set the following text labels: "Twenty-Five", "Fifty", "Seventy-Five", "One Hundred".When you do this, everything will work out fine and the 4 tick marks will be labeled accordingly; however, if during the execution of your program or through user interaction, the Step suddenly changes from 25 to 12.5, you'll have 8 tick marks instead of 4 because you used the
setLabelsmethod with indexes 0, 1, 2 and 3, the "Fifty" tickmark will no longer correspond to the 50 value.If you would have set the
setLabelValuemethod to 25, when the Step changes from 25 to 12.5 Chart FXwill label every other tick mark and the labels will correspond to their initial setting.Label visual attributes like rotation, color and font are also accessible through the
setLabelAngle,setTextColor, andsetFontmethods, respectively.To set a LabelValue of 25 for the primary Y axis:
chart1.getAxisY().setLabelValue(25);
-
setLabelValue
public void setLabelValue(DataUnit value)
Allows you to set and associate text labels to major tick marks in a numerical axis. This property can get or set the LabelValue assigned to any of the axes.
Normally, labels in a numerical axis are automatically controlled and displayed according to the
setMin,setMaxandsetStepmethods. In some cases, you'll need to associate text labels with a numerical axis (using thesetLabelsmethod), but when any of the scale values (Min, Max, Step, etc) change, these labels will no longer serve their purpose as the tick marks will be recalculated according to scale settings.For example, if you have a chart where the Y axis ranges from Min=0 to Max=100 and Step=25, you'll have 4 tick marks on 25, 50, 75 and 100. By default Chart FX will display numbers (as labels) associated with each tick mark.
Now let's say you want to associate text labels (instead of the number) with each tick mark in the Y axis and you use the
setLabelsmethod to set the following text labels: "Twenty-Five", "Fifty", "Seventy-Five", "One Hundred".When you do this, everything will work out fine and the 4 tick marks will be labeled accordingly; however, if during the execution of your program or through user interaction, the Step suddenly changes from 25 to 12.5, you'll have 8 tick marks instead of 4 because you used the
setLabelsmethod with indexes 0, 1, 2 and 3, the "Fifty" tickmark will no longer correspond to the 50 value.If you would have set the
setLabelValuemethod to 25, when the Step changes from 25 to 12.5 Chart FXwill label every other tick mark and the labels will correspond to their initial setting.Label visual attributes like rotation, color and font are also accessible through the
setLabelAngle,setTextColor, andsetFontmethods, respectively.To set a LabelValue of 25 for the primary Y axis:
chart1.getAxisY().setLabelValue(25);
- Parameters:
value-
-
getLabelValueDouble
public double getLabelValueDouble()
Allows you to set and associate text labels to major tick marks in a numerical axis. This property can get or set the LabelValue assigned to any of the axes.
Normally, labels in a numerical axis are automatically controlled and displayed according to the
setMin,setMaxandsetStepmethods. In some cases, you'll need to associate text labels with a numerical axis (using thesetLabelsmethod), but when any of the scale values (Min, Max, Step, etc) change, these labels will no longer serve their purpose as the tick marks will be recalculated according to scale settings.For example, if you have a chart where the Y axis ranges from Min=0 to Max=100 and Step=25, you'll have 4 tick marks on 25, 50, 75 and 100. By default Chart FX will display numbers (as labels) associated with each tick mark.
Now let's say you want to associate text labels (instead of the number) with each tick mark in the Y axis and you use the
setLabelsmethod to set the following text labels: "Twenty-Five", "Fifty", "Seventy-Five", "One Hundred".When you do this, everything will work out fine and the 4 tick marks will be labeled accordingly; however, if during the execution of your program or through user interaction, the Step suddenly changes from 25 to 12.5, you'll have 8 tick marks instead of 4 because you used the
setLabelsmethod with indexes 0, 1, 2 and 3, the "Fifty" tickmark will no longer correspond to the 50 value.If you would have set the
setLabelValuemethod to 25, when the Step changes from 25 to 12.5 Chart FXwill label every other tick mark and the labels will correspond to their initial setting.Label visual attributes like rotation, color and font are also accessible through the
setLabelAngle,setTextColor, andsetFontmethods, respectively.To set a LabelValue of 25 for the primary Y axis:
chart1.getAxisY().setLabelValue(25);
-
setLabelValue
public void setLabelValue(double value)
Allows you to set and associate text labels to major tick marks in a numerical axis. This property can get or set the LabelValue assigned to any of the axes.
Normally, labels in a numerical axis are automatically controlled and displayed according to the
setMin,setMaxandsetStepmethods. In some cases, you'll need to associate text labels with a numerical axis (using thesetLabelsmethod), but when any of the scale values (Min, Max, Step, etc) change, these labels will no longer serve their purpose as the tick marks will be recalculated according to scale settings.For example, if you have a chart where the Y axis ranges from Min=0 to Max=100 and Step=25, you'll have 4 tick marks on 25, 50, 75 and 100. By default Chart FX will display numbers (as labels) associated with each tick mark.
Now let's say you want to associate text labels (instead of the number) with each tick mark in the Y axis and you use the
setLabelsmethod to set the following text labels: "Twenty-Five", "Fifty", "Seventy-Five", "One Hundred".When you do this, everything will work out fine and the 4 tick marks will be labeled accordingly; however, if during the execution of your program or through user interaction, the Step suddenly changes from 25 to 12.5, you'll have 8 tick marks instead of 4 because you used the
setLabelsmethod with indexes 0, 1, 2 and 3, the "Fifty" tickmark will no longer correspond to the 50 value.If you would have set the
setLabelValuemethod to 25, when the Step changes from 25 to 12.5 Chart FXwill label every other tick mark and the labels will correspond to their initial setting.Label visual attributes like rotation, color and font are also accessible through the
setLabelAngle,setTextColor, andsetFontmethods, respectively.To set a LabelValue of 25 for the primary Y axis:
chart1.getAxisY().setLabelValue(25);
- Parameters:
value-
-
getLabelValueDateTime
public java.util.Date getLabelValueDateTime()
Allows you to set and associate text labels to major tick marks in a numerical axis. This property can get or set the LabelValue assigned to any of the axes.
Normally, labels in a numerical axis are automatically controlled and displayed according to the
setMin,setMaxandsetStepmethods. In some cases, you'll need to associate text labels with a numerical axis (using thesetLabelsmethod), but when any of the scale values (Min, Max, Step, etc) change, these labels will no longer serve their purpose as the tick marks will be recalculated according to scale settings.For example, if you have a chart where the Y axis ranges from Min=0 to Max=100 and Step=25, you'll have 4 tick marks on 25, 50, 75 and 100. By default Chart FX will display numbers (as labels) associated with each tick mark.
Now let's say you want to associate text labels (instead of the number) with each tick mark in the Y axis and you use the
setLabelsmethod to set the following text labels: "Twenty-Five", "Fifty", "Seventy-Five", "One Hundred".When you do this, everything will work out fine and the 4 tick marks will be labeled accordingly; however, if during the execution of your program or through user interaction, the Step suddenly changes from 25 to 12.5, you'll have 8 tick marks instead of 4 because you used the
setLabelsmethod with indexes 0, 1, 2 and 3, the "Fifty" tickmark will no longer correspond to the 50 value.If you would have set the
setLabelValuemethod to 25, when the Step changes from 25 to 12.5 Chart FXwill label every other tick mark and the labels will correspond to their initial setting.Label visual attributes like rotation, color and font are also accessible through the
setLabelAngle,setTextColor, andsetFontmethods, respectively.To set a LabelValue of 25 for the primary Y axis:
chart1.getAxisY().setLabelValue(25);
-
setLabelValue
public void setLabelValue(java.util.Date value)
Allows you to set and associate text labels to major tick marks in a numerical axis. This property can get or set the LabelValue assigned to any of the axes.
Normally, labels in a numerical axis are automatically controlled and displayed according to the
setMin,setMaxandsetStepmethods. In some cases, you'll need to associate text labels with a numerical axis (using thesetLabelsmethod), but when any of the scale values (Min, Max, Step, etc) change, these labels will no longer serve their purpose as the tick marks will be recalculated according to scale settings.For example, if you have a chart where the Y axis ranges from Min=0 to Max=100 and Step=25, you'll have 4 tick marks on 25, 50, 75 and 100. By default Chart FX will display numbers (as labels) associated with each tick mark.
Now let's say you want to associate text labels (instead of the number) with each tick mark in the Y axis and you use the
setLabelsmethod to set the following text labels: "Twenty-Five", "Fifty", "Seventy-Five", "One Hundred".When you do this, everything will work out fine and the 4 tick marks will be labeled accordingly; however, if during the execution of your program or through user interaction, the Step suddenly changes from 25 to 12.5, you'll have 8 tick marks instead of 4 because you used the
setLabelsmethod with indexes 0, 1, 2 and 3, the "Fifty" tickmark will no longer correspond to the 50 value.If you would have set the
setLabelValuemethod to 25, when the Step changes from 25 to 12.5 Chart FXwill label every other tick mark and the labels will correspond to their initial setting.Label visual attributes like rotation, color and font are also accessible through the
setLabelAngle,setTextColor, andsetFontmethods, respectively.To set a LabelValue of 25 for the primary Y axis:
chart1.getAxisY().setLabelValue(25);
- Parameters:
value-
-
getLabels
public java.util.List<java.lang.String> getLabels()
Allows you to get or set the tick mark labels for the selected axis.
Axis axis;
axis = chart1.getAxisX();
axis.getLabels().set((short)0, "January");
axis.getLabels().set((short)1, "February");
axis.getLabels().set((short)2, "March");
axis.getLabels().set((short)3, "April");
axis.getLabels().set((short)4, "May");
axis.getLabels().set((short)5, "June");
axis.getLabels().set((short)6, "July");
axis.getLabels().set((short)7, "August");
axis.getLabels().set((short)8, "September");
axis.getLabels().set((short)9, "October");
axis.getLabels().set((short)10, "November");
axis.getLabels().set((short)11, "December");
chart1.getAxisY().getLabels().set((short)0, "Custom Label");
-
getLabelsFormat
public ValueFormat getLabelsFormat()
Used to format the labels displayed on the selected axis.
chart1.getAxisY().getLabelsFormat().setFormat(AxisFormat.CURRENCY);
-
getLine
public Line getLine()
Allows you to apply supported Line class members to a selected axis line.
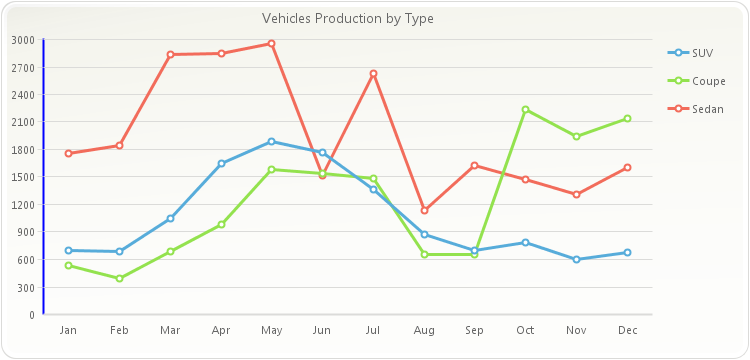
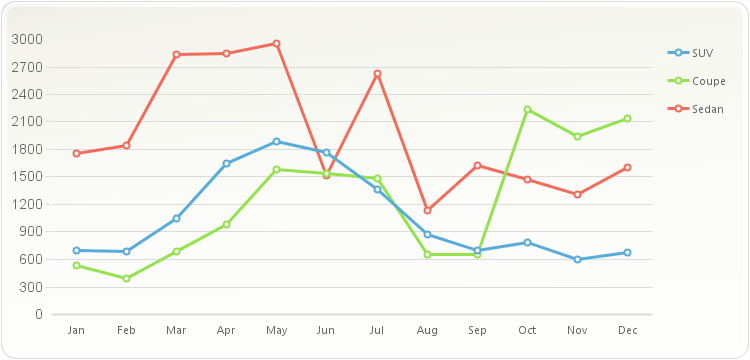
PopulateCarProduction(chart1);
chart1.getTitles().add(new TitleDockable("Vehicles Production by Type"));
chart1.setAxesStyle(AxesStyle.MATH);
chart1.getAxisY().getLine().setColor(new java.awt.Color(0,0,255,255));
public static void PopulateCarProduction(Chart chart1) { CarProduction[] production = new CarProduction[] { new CarProduction("Jan", 1760, 535, 695 ) , new CarProduction("Feb", 1849, 395, 688 ) , new CarProduction("Mar", 2831, 685, 1047 ) , new CarProduction("Apr", 2851, 984, 1652 ) , new CarProduction("May", 2961, 1579, 1889 ) , new CarProduction("Jun", 1519, 1539, 1766 ) , new CarProduction("Jul", 2633, 1489, 1361 ) , new CarProduction("Aug", 1140, 650, 874 ) , new CarProduction("Sep", 1626, 653, 693 ) , new CarProduction("Oct", 1478, 2236, 786 ) , new CarProduction("Nov", 1306, 1937, 599 ) , new CarProduction("Dec", 1607, 2138, 678 ) }; ObjectProvider objProvider = new ObjectProvider(production); chart1.getDataSourceSettings().setDataSource(objProvider); }public static class CarProduction { private CarProduction(String month, int sedan, int coupe, int SUV) { this.setMonth(month); this.setSedan(sedan); this.setCoupe(coupe); this.setSUV(SUV); } private String privateMonth; public final String getMonth() { return privateMonth; } public final void setMonth(String value) { privateMonth = value; } private int privateSedan; public final int getSedan() { return privateSedan; } public final void setSedan(int value) { privateSedan = value; } private int privateCoupe; public final int getCoupe() { return privateCoupe; } public final void setCoupe(int value) { privateCoupe = value; } private int privateSUV; public final int getSUV() { return privateSUV; } public final void setSUV(int value) { privateSUV = value; } }
-
getLineSpacing
public double getLineSpacing()
Gets or sets a value indicating the LineSpacing for an axis.
This method specifies the LineSpacing for vertical axes. The labels in the selected axis will never be painted less than the configured LineSpacing.
Setting the
setLineSpacingmethod to 2 will instruct the axis to use double line spacing. Setting the value to 1 instructs the chart to use single line spacing. The default value is 1.5.To configure an Axis to use double line spacing:
chart1.getAxisY().setLineSpacing(2);
- See Also:
resetLineSpacing
-
setLineSpacing
public void setLineSpacing(double value)
Gets or sets a value indicating the LineSpacing for an axis.
This method specifies the LineSpacing for vertical axes. The labels in the selected axis will never be painted less than the configured LineSpacing.
Setting the
setLineSpacingmethod to 2 will instruct the axis to use double line spacing. Setting the value to 1 instructs the chart to use single line spacing. The default value is 1.5.To configure an Axis to use double line spacing:
chart1.getAxisY().setLineSpacing(2);
- Parameters:
value-- See Also:
resetLineSpacing
-
getLogBase
public double getLogBase()
Description goes here
-
setLogBase
public void setLogBase(double value)
Description goes here- Parameters:
value-
-
getMarginFromMax
public int getMarginFromMax()
Gets or sets a percentage value of a starting scroll position when the chart is scrollable.
This method controls the width of an axis margin in pixels after the axis max value. In an X axis, the margin is to the right of the chart. In a Y axis, the margin is at the top of the chart.
This method is useful when need to create space after the chart max value.
The
setMarginFromMaxmethod should not be greather than the chart width or height, otherwise, all chart datapoints will be shrunk to comply with the MarginFromMax value.To set the margin from max value of the X axis to 100:
chart1.getAxisX().setMarginFromMax(100);
- See Also:
resetMarginFromMax
-
setMarginFromMax
public void setMarginFromMax(int value)
Gets or sets a percentage value of a starting scroll position when the chart is scrollable.
This method controls the width of an axis margin in pixels after the axis max value. In an X axis, the margin is to the right of the chart. In a Y axis, the margin is at the top of the chart.
This method is useful when need to create space after the chart max value.
The
setMarginFromMaxmethod should not be greather than the chart width or height, otherwise, all chart datapoints will be shrunk to comply with the MarginFromMax value.To set the margin from max value of the X axis to 100:
chart1.getAxisX().setMarginFromMax(100);
- Parameters:
value-- See Also:
resetMarginFromMax
-
getMarginFromMin
public int getMarginFromMin()
Gets or sets a value specifying the margin width in pixels before the selected axis min value.
This method controls the width of an axis margin in pixels before the axis min value. In an X axis, the margin is to the left of the chart. In a Y axis, the margin is at the bottom of the chart.
This method is useful when need to create space before the chart min value.
The
setMarginFromMinmethod should not be greather than the chart width or height, otherwise all chart datapoints will be shrunk to comply with the MarginFromMin value.To set the margin from min value of the X axis to 100:
chart1.getAxisX().setMarginFromMin(100);
- See Also:
resetMarginFromMin
-
setMarginFromMin
public void setMarginFromMin(int value)
Gets or sets a value specifying the margin width in pixels before the selected axis min value.
This method controls the width of an axis margin in pixels before the axis min value. In an X axis, the margin is to the left of the chart. In a Y axis, the margin is at the bottom of the chart.
This method is useful when need to create space before the chart min value.
The
setMarginFromMinmethod should not be greather than the chart width or height, otherwise all chart datapoints will be shrunk to comply with the MarginFromMin value.To set the margin from min value of the X axis to 100:
chart1.getAxisX().setMarginFromMin(100);
- Parameters:
value-- See Also:
resetMarginFromMin
-
getMaxTimeSpan
public TimeSpan getMaxTimeSpan()
Gets or sets the Max value assigned to the specified axis.
The
setMaxmethod can be applied only to a numerical axis, a categorical axis will ignore this setting.The
setMaxmethod is a member of the axis object, therefore the axis object must be referenced in order to properly access thesetMaxmethod.If no Max value is specified, Chart FX will automatically set a maximum value according to the data provided, you can use this method to rewrite this default value.
Resetting the data contained in a chart will not automatically set a new Max value unless the
recalculateScalemethod is called or theisAutoScalemethod is set to true.The value of the
setMaxmethod must be greater than the value of the Min method.There is no automatic method for aligning a main and secondary axis, it is required that you set the Min and Max in order to align them manually. The generic algorithm used to find these values is the following:
Axis.Max = OtherAxis.Max/(OtherAxis.Min / Axis.Min)
To set the Max value of the primary Y axis to 10:
chart1.getAxisY().setMax(10);
-
setMax
public void setMax(TimeSpan value)
Gets or sets the Max value assigned to the specified axis.
The
setMaxmethod can be applied only to a numerical axis, a categorical axis will ignore this setting.The
setMaxmethod is a member of the axis object, therefore the axis object must be referenced in order to properly access thesetMaxmethod.If no Max value is specified, Chart FX will automatically set a maximum value according to the data provided, you can use this method to rewrite this default value.
Resetting the data contained in a chart will not automatically set a new Max value unless the
recalculateScalemethod is called or theisAutoScalemethod is set to true.The value of the
setMaxmethod must be greater than the value of the Min method.There is no automatic method for aligning a main and secondary axis, it is required that you set the Min and Max in order to align them manually. The generic algorithm used to find these values is the following:
Axis.Max = OtherAxis.Max/(OtherAxis.Min / Axis.Min)
To set the Max value of the primary Y axis to 10:
chart1.getAxisY().setMax(10);
- Parameters:
value-
-
getMax
public DataUnit getMax()
Gets or sets the Max value assigned to the specified axis.
The
setMaxmethod can be applied only to a numerical axis, a categorical axis will ignore this setting.The
setMaxmethod is a member of the axis object, therefore the axis object must be referenced in order to properly access thesetMaxmethod.If no Max value is specified, Chart FX will automatically set a maximum value according to the data provided, you can use this method to rewrite this default value.
Resetting the data contained in a chart will not automatically set a new Max value unless the
recalculateScalemethod is called or theisAutoScalemethod is set to true.The value of the
setMaxmethod must be greater than the value of the Min method.There is no automatic method for aligning a main and secondary axis, it is required that you set the Min and Max in order to align them manually. The generic algorithm used to find these values is the following:
Axis.Max = OtherAxis.Max/(OtherAxis.Min / Axis.Min)
To set the Max value of the primary Y axis to 10:
chart1.getAxisY().setMax(10);
-
setMax
public void setMax(DataUnit value)
Gets or sets the Max value assigned to the specified axis.
The
setMaxmethod can be applied only to a numerical axis, a categorical axis will ignore this setting.The
setMaxmethod is a member of the axis object, therefore the axis object must be referenced in order to properly access thesetMaxmethod.If no Max value is specified, Chart FX will automatically set a maximum value according to the data provided, you can use this method to rewrite this default value.
Resetting the data contained in a chart will not automatically set a new Max value unless the
recalculateScalemethod is called or theisAutoScalemethod is set to true.The value of the
setMaxmethod must be greater than the value of the Min method.There is no automatic method for aligning a main and secondary axis, it is required that you set the Min and Max in order to align them manually. The generic algorithm used to find these values is the following:
Axis.Max = OtherAxis.Max/(OtherAxis.Min / Axis.Min)
To set the Max value of the primary Y axis to 10:
chart1.getAxisY().setMax(10);
- Parameters:
value-
-
getMaxDouble
public double getMaxDouble()
Gets or sets the Max value assigned to the specified axis.
The
setMaxmethod can be applied only to a numerical axis, a categorical axis will ignore this setting.The
setMaxmethod is a member of the axis object, therefore the axis object must be referenced in order to properly access thesetMaxmethod.If no Max value is specified, Chart FX will automatically set a maximum value according to the data provided, you can use this method to rewrite this default value.
Resetting the data contained in a chart will not automatically set a new Max value unless the
recalculateScalemethod is called or theisAutoScalemethod is set to true.The value of the
setMaxmethod must be greater than the value of the Min method.There is no automatic method for aligning a main and secondary axis, it is required that you set the Min and Max in order to align them manually. The generic algorithm used to find these values is the following:
Axis.Max = OtherAxis.Max/(OtherAxis.Min / Axis.Min)
To set the Max value of the primary Y axis to 10:
chart1.getAxisY().setMax(10);
-
setMax
public void setMax(double value)
Gets or sets the Max value assigned to the specified axis.
The
setMaxmethod can be applied only to a numerical axis, a categorical axis will ignore this setting.The
setMaxmethod is a member of the axis object, therefore the axis object must be referenced in order to properly access thesetMaxmethod.If no Max value is specified, Chart FX will automatically set a maximum value according to the data provided, you can use this method to rewrite this default value.
Resetting the data contained in a chart will not automatically set a new Max value unless the
recalculateScalemethod is called or theisAutoScalemethod is set to true.The value of the
setMaxmethod must be greater than the value of the Min method.There is no automatic method for aligning a main and secondary axis, it is required that you set the Min and Max in order to align them manually. The generic algorithm used to find these values is the following:
Axis.Max = OtherAxis.Max/(OtherAxis.Min / Axis.Min)
To set the Max value of the primary Y axis to 10:
chart1.getAxisY().setMax(10);
- Parameters:
value-
-
getMaxDateTime
public java.util.Date getMaxDateTime()
Gets or sets the Max value assigned to the specified axis.
The
setMaxmethod can be applied only to a numerical axis, a categorical axis will ignore this setting.The
setMaxmethod is a member of the axis object, therefore the axis object must be referenced in order to properly access thesetMaxmethod.If no Max value is specified, Chart FX will automatically set a maximum value according to the data provided, you can use this method to rewrite this default value.
Resetting the data contained in a chart will not automatically set a new Max value unless the
recalculateScalemethod is called or theisAutoScalemethod is set to true.The value of the
setMaxmethod must be greater than the value of the Min method.There is no automatic method for aligning a main and secondary axis, it is required that you set the Min and Max in order to align them manually. The generic algorithm used to find these values is the following:
Axis.Max = OtherAxis.Max/(OtherAxis.Min / Axis.Min)
To set the Max value of the primary Y axis to 10:
chart1.getAxisY().setMax(10);
-
setMax
public void setMax(java.util.Date value)
Gets or sets the Max value assigned to the specified axis.
The
setMaxmethod can be applied only to a numerical axis, a categorical axis will ignore this setting.The
setMaxmethod is a member of the axis object, therefore the axis object must be referenced in order to properly access thesetMaxmethod.If no Max value is specified, Chart FX will automatically set a maximum value according to the data provided, you can use this method to rewrite this default value.
Resetting the data contained in a chart will not automatically set a new Max value unless the
recalculateScalemethod is called or theisAutoScalemethod is set to true.The value of the
setMaxmethod must be greater than the value of the Min method.There is no automatic method for aligning a main and secondary axis, it is required that you set the Min and Max in order to align them manually. The generic algorithm used to find these values is the following:
Axis.Max = OtherAxis.Max/(OtherAxis.Min / Axis.Min)
To set the Max value of the primary Y axis to 10:
chart1.getAxisY().setMax(10);
- Parameters:
value-
-
getMaxSizePercentage
public int getMaxSizePercentage()
Allows you to specify the maximum percentage of the chart area the AxisX labels may occupy.
This method is particularly useful when plotting angled or vertical labels along the x-axis; since the labels may be too long thus shrinking the plotted area of the chart, you may want to set the
setMaxSizePercentagemethod to increase it.This method may be configured with values ranging from 0 - 100. Specifying 0 will instruct Chart FX to try hiding the labels area and cover it by the chart.
- See Also:
resetMaxSizePercentage
-
setMaxSizePercentage
public void setMaxSizePercentage(int value)
Allows you to specify the maximum percentage of the chart area the AxisX labels may occupy.
This method is particularly useful when plotting angled or vertical labels along the x-axis; since the labels may be too long thus shrinking the plotted area of the chart, you may want to set the
setMaxSizePercentagemethod to increase it.This method may be configured with values ranging from 0 - 100. Specifying 0 will instruct Chart FX to try hiding the labels area and cover it by the chart.
- Parameters:
value-- See Also:
resetMaxSizePercentage
-
getMinTimeSpan
public TimeSpan getMinTimeSpan()
Gets or sets the Min value assigned to the specified axis.
The
setMinmethod can be applied only to a numerical axis, a categorical axis will ignore this setting.The
setMinmethod is a member of the axis object, therefore the axis object must be referenced in order to properly access thesetMinmethod.If no Min value is specified, Chart FX will automatically set a minimum value according to the data provided, you can use this method to read or write this default value.
Changing the data contained in a chart will not automatically set a new Min value unless the
recalculateScalemethod is called or theisAutoScalemethod is set to true.The value of the
setMinmethod must be lesser than the value of the Max method.There is no automatic method for aligning a main and secondary axis, it is required that you set the Min and Max in order to align them manually. The generic algorithm used to find these values is the following:
Axis.Min = OtherAxis.Min/(OtherAxis.Max / Axis.Max)
To set the Min value of the primary Y axis to 10:
chart1.getAxisY().setMin(10);
-
setMin
public void setMin(TimeSpan value)
Gets or sets the Min value assigned to the specified axis.
The
setMinmethod can be applied only to a numerical axis, a categorical axis will ignore this setting.The
setMinmethod is a member of the axis object, therefore the axis object must be referenced in order to properly access thesetMinmethod.If no Min value is specified, Chart FX will automatically set a minimum value according to the data provided, you can use this method to read or write this default value.
Changing the data contained in a chart will not automatically set a new Min value unless the
recalculateScalemethod is called or theisAutoScalemethod is set to true.The value of the
setMinmethod must be lesser than the value of the Max method.There is no automatic method for aligning a main and secondary axis, it is required that you set the Min and Max in order to align them manually. The generic algorithm used to find these values is the following:
Axis.Min = OtherAxis.Min/(OtherAxis.Max / Axis.Max)
To set the Min value of the primary Y axis to 10:
chart1.getAxisY().setMin(10);
- Parameters:
value-
-
getMin
public DataUnit getMin()
Gets or sets the Min value assigned to the specified axis.
The
setMinmethod can be applied only to a numerical axis, a categorical axis will ignore this setting.The
setMinmethod is a member of the axis object, therefore the axis object must be referenced in order to properly access thesetMinmethod.If no Min value is specified, Chart FX will automatically set a minimum value according to the data provided, you can use this method to read or write this default value.
Changing the data contained in a chart will not automatically set a new Min value unless the
recalculateScalemethod is called or theisAutoScalemethod is set to true.The value of the
setMinmethod must be lesser than the value of the Max method.There is no automatic method for aligning a main and secondary axis, it is required that you set the Min and Max in order to align them manually. The generic algorithm used to find these values is the following:
Axis.Min = OtherAxis.Min/(OtherAxis.Max / Axis.Max)
To set the Min value of the primary Y axis to 10:
chart1.getAxisY().setMin(10);
-
setMin
public void setMin(DataUnit value)
Gets or sets the Min value assigned to the specified axis.
The
setMinmethod can be applied only to a numerical axis, a categorical axis will ignore this setting.The
setMinmethod is a member of the axis object, therefore the axis object must be referenced in order to properly access thesetMinmethod.If no Min value is specified, Chart FX will automatically set a minimum value according to the data provided, you can use this method to read or write this default value.
Changing the data contained in a chart will not automatically set a new Min value unless the
recalculateScalemethod is called or theisAutoScalemethod is set to true.The value of the
setMinmethod must be lesser than the value of the Max method.There is no automatic method for aligning a main and secondary axis, it is required that you set the Min and Max in order to align them manually. The generic algorithm used to find these values is the following:
Axis.Min = OtherAxis.Min/(OtherAxis.Max / Axis.Max)
To set the Min value of the primary Y axis to 10:
chart1.getAxisY().setMin(10);
- Parameters:
value-
-
getMinDouble
public double getMinDouble()
Gets or sets the Min value assigned to the specified axis.
The
setMinmethod can be applied only to a numerical axis, a categorical axis will ignore this setting.The
setMinmethod is a member of the axis object, therefore the axis object must be referenced in order to properly access thesetMinmethod.If no Min value is specified, Chart FX will automatically set a minimum value according to the data provided, you can use this method to read or write this default value.
Changing the data contained in a chart will not automatically set a new Min value unless the
recalculateScalemethod is called or theisAutoScalemethod is set to true.The value of the
setMinmethod must be lesser than the value of the Max method.There is no automatic method for aligning a main and secondary axis, it is required that you set the Min and Max in order to align them manually. The generic algorithm used to find these values is the following:
Axis.Min = OtherAxis.Min/(OtherAxis.Max / Axis.Max)
To set the Min value of the primary Y axis to 10:
chart1.getAxisY().setMin(10);
-
setMin
public void setMin(double value)
Gets or sets the Min value assigned to the specified axis.
The
setMinmethod can be applied only to a numerical axis, a categorical axis will ignore this setting.The
setMinmethod is a member of the axis object, therefore the axis object must be referenced in order to properly access thesetMinmethod.If no Min value is specified, Chart FX will automatically set a minimum value according to the data provided, you can use this method to read or write this default value.
Changing the data contained in a chart will not automatically set a new Min value unless the
recalculateScalemethod is called or theisAutoScalemethod is set to true.The value of the
setMinmethod must be lesser than the value of the Max method.There is no automatic method for aligning a main and secondary axis, it is required that you set the Min and Max in order to align them manually. The generic algorithm used to find these values is the following:
Axis.Min = OtherAxis.Min/(OtherAxis.Max / Axis.Max)
To set the Min value of the primary Y axis to 10:
chart1.getAxisY().setMin(10);
- Parameters:
value-
-
getMinDateTime
public java.util.Date getMinDateTime()
Gets or sets the Min value assigned to the specified axis.
The
setMinmethod can be applied only to a numerical axis, a categorical axis will ignore this setting.The
setMinmethod is a member of the axis object, therefore the axis object must be referenced in order to properly access thesetMinmethod.If no Min value is specified, Chart FX will automatically set a minimum value according to the data provided, you can use this method to read or write this default value.
Changing the data contained in a chart will not automatically set a new Min value unless the
recalculateScalemethod is called or theisAutoScalemethod is set to true.The value of the
setMinmethod must be lesser than the value of the Max method.There is no automatic method for aligning a main and secondary axis, it is required that you set the Min and Max in order to align them manually. The generic algorithm used to find these values is the following:
Axis.Min = OtherAxis.Min/(OtherAxis.Max / Axis.Max)
To set the Min value of the primary Y axis to 10:
chart1.getAxisY().setMin(10);
-
setMin
public void setMin(java.util.Date value)
Gets or sets the Min value assigned to the specified axis.
The
setMinmethod can be applied only to a numerical axis, a categorical axis will ignore this setting.The
setMinmethod is a member of the axis object, therefore the axis object must be referenced in order to properly access thesetMinmethod.If no Min value is specified, Chart FX will automatically set a minimum value according to the data provided, you can use this method to read or write this default value.
Changing the data contained in a chart will not automatically set a new Min value unless the
recalculateScalemethod is called or theisAutoScalemethod is set to true.The value of the
setMinmethod must be lesser than the value of the Max method.There is no automatic method for aligning a main and secondary axis, it is required that you set the Min and Max in order to align them manually. The generic algorithm used to find these values is the following:
Axis.Min = OtherAxis.Min/(OtherAxis.Max / Axis.Max)
To set the Min value of the primary Y axis to 10:
chart1.getAxisY().setMin(10);
- Parameters:
value-
-
getMinorStepTimeSpan
public TimeSpan getMinorStepTimeSpan()
Specifies the increment you want between minor tick marks and minor gridlines (if they are displayed) on the selected axis.
This method is used to control the interval of minor tick marks and gridlines in the selected axis. For example, if the selected axis ranges from 0-100 and you have specified a
setStepvalue of 10, labels and gridlines will appear at 10, 20, 30, etc. If you would like to have 5 minor tick marks in each major interval, set the MinorStep to 2. Please note the values for the Step and MinorStep methods are data related.Labels will not appear at minor tick marks.
The value of the
setMinorStepDateTimemethod must be lesser than the value of thesetStepmethod.When using the
setFirstLabelmethod in the X Axis of a chart with values ranging from 0 to 1, the axis' MinorStep is used to calculate which label is the first, second, third, etc. When X Axis values range bigger than 1, then the axissetStepis used for this calcuation.Below, the Y axis minor step is set to 100:
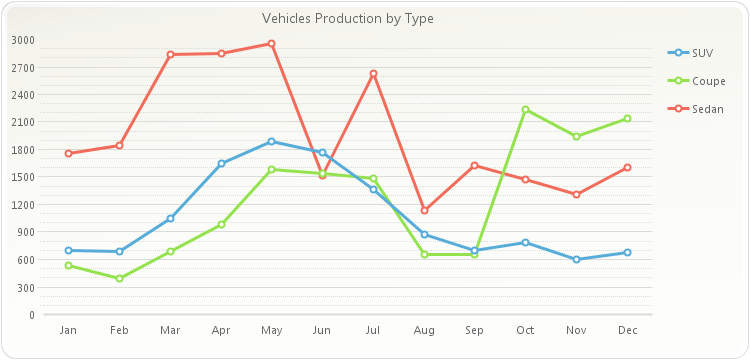
PopulateCarProduction(chart1);
chart1.getTitles().add(new TitleDockable("Vehicles Production by Type"));
chart1.getAxisY().getGrids().getMinor().setVisible(true);
chart1.getAxisY().getGrids().getMinor().setStyle(DashStyle.DOT);
chart1.getAxisY().setMinorStep(100);
public static void PopulateCarProduction(Chart chart1) { CarProduction[] production = new CarProduction[] { new CarProduction("Jan", 1760, 535, 695 ) , new CarProduction("Feb", 1849, 395, 688 ) , new CarProduction("Mar", 2831, 685, 1047 ) , new CarProduction("Apr", 2851, 984, 1652 ) , new CarProduction("May", 2961, 1579, 1889 ) , new CarProduction("Jun", 1519, 1539, 1766 ) , new CarProduction("Jul", 2633, 1489, 1361 ) , new CarProduction("Aug", 1140, 650, 874 ) , new CarProduction("Sep", 1626, 653, 693 ) , new CarProduction("Oct", 1478, 2236, 786 ) , new CarProduction("Nov", 1306, 1937, 599 ) , new CarProduction("Dec", 1607, 2138, 678 ) }; ObjectProvider objProvider = new ObjectProvider(production); chart1.getDataSourceSettings().setDataSource(objProvider); }public static class CarProduction { private CarProduction(String month, int sedan, int coupe, int SUV) { this.setMonth(month); this.setSedan(sedan); this.setCoupe(coupe); this.setSUV(SUV); } private String privateMonth; public final String getMonth() { return privateMonth; } public final void setMonth(String value) { privateMonth = value; } private int privateSedan; public final int getSedan() { return privateSedan; } public final void setSedan(int value) { privateSedan = value; } private int privateCoupe; public final int getCoupe() { return privateCoupe; } public final void setCoupe(int value) { privateCoupe = value; } private int privateSUV; public final int getSUV() { return privateSUV; } public final void setSUV(int value) { privateSUV = value; } }
-
setMinorStep
public void setMinorStep(TimeSpan value)
Specifies the increment you want between minor tick marks and minor gridlines (if they are displayed) on the selected axis.
This method is used to control the interval of minor tick marks and gridlines in the selected axis. For example, if the selected axis ranges from 0-100 and you have specified a
setStepvalue of 10, labels and gridlines will appear at 10, 20, 30, etc. If you would like to have 5 minor tick marks in each major interval, set the MinorStep to 2. Please note the values for the Step and MinorStep methods are data related.Labels will not appear at minor tick marks.
The value of the
setMinorStepDateTimemethod must be lesser than the value of thesetStepmethod.When using the
setFirstLabelmethod in the X Axis of a chart with values ranging from 0 to 1, the axis' MinorStep is used to calculate which label is the first, second, third, etc. When X Axis values range bigger than 1, then the axissetStepis used for this calcuation.Below, the Y axis minor step is set to 100:
PopulateCarProduction(chart1);
chart1.getTitles().add(new TitleDockable("Vehicles Production by Type"));
chart1.getAxisY().getGrids().getMinor().setVisible(true);
chart1.getAxisY().getGrids().getMinor().setStyle(DashStyle.DOT);
chart1.getAxisY().setMinorStep(100);
public static void PopulateCarProduction(Chart chart1) { CarProduction[] production = new CarProduction[] { new CarProduction("Jan", 1760, 535, 695 ) , new CarProduction("Feb", 1849, 395, 688 ) , new CarProduction("Mar", 2831, 685, 1047 ) , new CarProduction("Apr", 2851, 984, 1652 ) , new CarProduction("May", 2961, 1579, 1889 ) , new CarProduction("Jun", 1519, 1539, 1766 ) , new CarProduction("Jul", 2633, 1489, 1361 ) , new CarProduction("Aug", 1140, 650, 874 ) , new CarProduction("Sep", 1626, 653, 693 ) , new CarProduction("Oct", 1478, 2236, 786 ) , new CarProduction("Nov", 1306, 1937, 599 ) , new CarProduction("Dec", 1607, 2138, 678 ) }; ObjectProvider objProvider = new ObjectProvider(production); chart1.getDataSourceSettings().setDataSource(objProvider); }public static class CarProduction { private CarProduction(String month, int sedan, int coupe, int SUV) { this.setMonth(month); this.setSedan(sedan); this.setCoupe(coupe); this.setSUV(SUV); } private String privateMonth; public final String getMonth() { return privateMonth; } public final void setMonth(String value) { privateMonth = value; } private int privateSedan; public final int getSedan() { return privateSedan; } public final void setSedan(int value) { privateSedan = value; } private int privateCoupe; public final int getCoupe() { return privateCoupe; } public final void setCoupe(int value) { privateCoupe = value; } private int privateSUV; public final int getSUV() { return privateSUV; } public final void setSUV(int value) { privateSUV = value; } }
- Parameters:
value-
-
getMinorStep
public DataUnit getMinorStep()
Specifies the increment you want between minor tick marks and minor gridlines (if they are displayed) on the selected axis.
This method is used to control the interval of minor tick marks and gridlines in the selected axis. For example, if the selected axis ranges from 0-100 and you have specified a
setStepvalue of 10, labels and gridlines will appear at 10, 20, 30, etc. If you would like to have 5 minor tick marks in each major interval, set the MinorStep to 2. Please note the values for the Step and MinorStep methods are data related.Labels will not appear at minor tick marks.
The value of the
setMinorStepDateTimemethod must be lesser than the value of thesetStepmethod.When using the
setFirstLabelmethod in the X Axis of a chart with values ranging from 0 to 1, the axis' MinorStep is used to calculate which label is the first, second, third, etc. When X Axis values range bigger than 1, then the axissetStepis used for this calcuation.Below, the Y axis minor step is set to 100:
PopulateCarProduction(chart1);
chart1.getTitles().add(new TitleDockable("Vehicles Production by Type"));
chart1.getAxisY().getGrids().getMinor().setVisible(true);
chart1.getAxisY().getGrids().getMinor().setStyle(DashStyle.DOT);
chart1.getAxisY().setMinorStep(100);
public static void PopulateCarProduction(Chart chart1) { CarProduction[] production = new CarProduction[] { new CarProduction("Jan", 1760, 535, 695 ) , new CarProduction("Feb", 1849, 395, 688 ) , new CarProduction("Mar", 2831, 685, 1047 ) , new CarProduction("Apr", 2851, 984, 1652 ) , new CarProduction("May", 2961, 1579, 1889 ) , new CarProduction("Jun", 1519, 1539, 1766 ) , new CarProduction("Jul", 2633, 1489, 1361 ) , new CarProduction("Aug", 1140, 650, 874 ) , new CarProduction("Sep", 1626, 653, 693 ) , new CarProduction("Oct", 1478, 2236, 786 ) , new CarProduction("Nov", 1306, 1937, 599 ) , new CarProduction("Dec", 1607, 2138, 678 ) }; ObjectProvider objProvider = new ObjectProvider(production); chart1.getDataSourceSettings().setDataSource(objProvider); }public static class CarProduction { private CarProduction(String month, int sedan, int coupe, int SUV) { this.setMonth(month); this.setSedan(sedan); this.setCoupe(coupe); this.setSUV(SUV); } private String privateMonth; public final String getMonth() { return privateMonth; } public final void setMonth(String value) { privateMonth = value; } private int privateSedan; public final int getSedan() { return privateSedan; } public final void setSedan(int value) { privateSedan = value; } private int privateCoupe; public final int getCoupe() { return privateCoupe; } public final void setCoupe(int value) { privateCoupe = value; } private int privateSUV; public final int getSUV() { return privateSUV; } public final void setSUV(int value) { privateSUV = value; } }
-
setMinorStep
public void setMinorStep(DataUnit value)
Specifies the increment you want between minor tick marks and minor gridlines (if they are displayed) on the selected axis.
This method is used to control the interval of minor tick marks and gridlines in the selected axis. For example, if the selected axis ranges from 0-100 and you have specified a
setStepvalue of 10, labels and gridlines will appear at 10, 20, 30, etc. If you would like to have 5 minor tick marks in each major interval, set the MinorStep to 2. Please note the values for the Step and MinorStep methods are data related.Labels will not appear at minor tick marks.
The value of the
setMinorStepDateTimemethod must be lesser than the value of thesetStepmethod.When using the
setFirstLabelmethod in the X Axis of a chart with values ranging from 0 to 1, the axis' MinorStep is used to calculate which label is the first, second, third, etc. When X Axis values range bigger than 1, then the axissetStepis used for this calcuation.Below, the Y axis minor step is set to 100:
PopulateCarProduction(chart1);
chart1.getTitles().add(new TitleDockable("Vehicles Production by Type"));
chart1.getAxisY().getGrids().getMinor().setVisible(true);
chart1.getAxisY().getGrids().getMinor().setStyle(DashStyle.DOT);
chart1.getAxisY().setMinorStep(100);
public static void PopulateCarProduction(Chart chart1) { CarProduction[] production = new CarProduction[] { new CarProduction("Jan", 1760, 535, 695 ) , new CarProduction("Feb", 1849, 395, 688 ) , new CarProduction("Mar", 2831, 685, 1047 ) , new CarProduction("Apr", 2851, 984, 1652 ) , new CarProduction("May", 2961, 1579, 1889 ) , new CarProduction("Jun", 1519, 1539, 1766 ) , new CarProduction("Jul", 2633, 1489, 1361 ) , new CarProduction("Aug", 1140, 650, 874 ) , new CarProduction("Sep", 1626, 653, 693 ) , new CarProduction("Oct", 1478, 2236, 786 ) , new CarProduction("Nov", 1306, 1937, 599 ) , new CarProduction("Dec", 1607, 2138, 678 ) }; ObjectProvider objProvider = new ObjectProvider(production); chart1.getDataSourceSettings().setDataSource(objProvider); }public static class CarProduction { private CarProduction(String month, int sedan, int coupe, int SUV) { this.setMonth(month); this.setSedan(sedan); this.setCoupe(coupe); this.setSUV(SUV); } private String privateMonth; public final String getMonth() { return privateMonth; } public final void setMonth(String value) { privateMonth = value; } private int privateSedan; public final int getSedan() { return privateSedan; } public final void setSedan(int value) { privateSedan = value; } private int privateCoupe; public final int getCoupe() { return privateCoupe; } public final void setCoupe(int value) { privateCoupe = value; } private int privateSUV; public final int getSUV() { return privateSUV; } public final void setSUV(int value) { privateSUV = value; } }
- Parameters:
value-
-
getMinorStepDouble
public double getMinorStepDouble()
Specifies the increment you want between minor tick marks and minor gridlines (if they are displayed) on the selected axis.
This method is used to control the interval of minor tick marks and gridlines in the selected axis. For example, if the selected axis ranges from 0-100 and you have specified a
setStepvalue of 10, labels and gridlines will appear at 10, 20, 30, etc. If you would like to have 5 minor tick marks in each major interval, set the MinorStep to 2. Please note the values for the Step and MinorStep methods are data related.Labels will not appear at minor tick marks.
The value of the
setMinorStepDateTimemethod must be lesser than the value of thesetStepmethod.When using the
setFirstLabelmethod in the X Axis of a chart with values ranging from 0 to 1, the axis' MinorStep is used to calculate which label is the first, second, third, etc. When X Axis values range bigger than 1, then the axissetStepis used for this calcuation.Below, the Y axis minor step is set to 100:
PopulateCarProduction(chart1);
chart1.getTitles().add(new TitleDockable("Vehicles Production by Type"));
chart1.getAxisY().getGrids().getMinor().setVisible(true);
chart1.getAxisY().getGrids().getMinor().setStyle(DashStyle.DOT);
chart1.getAxisY().setMinorStep(100);
public static void PopulateCarProduction(Chart chart1) { CarProduction[] production = new CarProduction[] { new CarProduction("Jan", 1760, 535, 695 ) , new CarProduction("Feb", 1849, 395, 688 ) , new CarProduction("Mar", 2831, 685, 1047 ) , new CarProduction("Apr", 2851, 984, 1652 ) , new CarProduction("May", 2961, 1579, 1889 ) , new CarProduction("Jun", 1519, 1539, 1766 ) , new CarProduction("Jul", 2633, 1489, 1361 ) , new CarProduction("Aug", 1140, 650, 874 ) , new CarProduction("Sep", 1626, 653, 693 ) , new CarProduction("Oct", 1478, 2236, 786 ) , new CarProduction("Nov", 1306, 1937, 599 ) , new CarProduction("Dec", 1607, 2138, 678 ) }; ObjectProvider objProvider = new ObjectProvider(production); chart1.getDataSourceSettings().setDataSource(objProvider); }public static class CarProduction { private CarProduction(String month, int sedan, int coupe, int SUV) { this.setMonth(month); this.setSedan(sedan); this.setCoupe(coupe); this.setSUV(SUV); } private String privateMonth; public final String getMonth() { return privateMonth; } public final void setMonth(String value) { privateMonth = value; } private int privateSedan; public final int getSedan() { return privateSedan; } public final void setSedan(int value) { privateSedan = value; } private int privateCoupe; public final int getCoupe() { return privateCoupe; } public final void setCoupe(int value) { privateCoupe = value; } private int privateSUV; public final int getSUV() { return privateSUV; } public final void setSUV(int value) { privateSUV = value; } }
-
setMinorStep
public void setMinorStep(double value)
Specifies the increment you want between minor tick marks and minor gridlines (if they are displayed) on the selected axis.
This method is used to control the interval of minor tick marks and gridlines in the selected axis. For example, if the selected axis ranges from 0-100 and you have specified a
setStepvalue of 10, labels and gridlines will appear at 10, 20, 30, etc. If you would like to have 5 minor tick marks in each major interval, set the MinorStep to 2. Please note the values for the Step and MinorStep methods are data related.Labels will not appear at minor tick marks.
The value of the
setMinorStepDateTimemethod must be lesser than the value of thesetStepmethod.When using the
setFirstLabelmethod in the X Axis of a chart with values ranging from 0 to 1, the axis' MinorStep is used to calculate which label is the first, second, third, etc. When X Axis values range bigger than 1, then the axissetStepis used for this calcuation.Below, the Y axis minor step is set to 100:
PopulateCarProduction(chart1);
chart1.getTitles().add(new TitleDockable("Vehicles Production by Type"));
chart1.getAxisY().getGrids().getMinor().setVisible(true);
chart1.getAxisY().getGrids().getMinor().setStyle(DashStyle.DOT);
chart1.getAxisY().setMinorStep(100);
public static void PopulateCarProduction(Chart chart1) { CarProduction[] production = new CarProduction[] { new CarProduction("Jan", 1760, 535, 695 ) , new CarProduction("Feb", 1849, 395, 688 ) , new CarProduction("Mar", 2831, 685, 1047 ) , new CarProduction("Apr", 2851, 984, 1652 ) , new CarProduction("May", 2961, 1579, 1889 ) , new CarProduction("Jun", 1519, 1539, 1766 ) , new CarProduction("Jul", 2633, 1489, 1361 ) , new CarProduction("Aug", 1140, 650, 874 ) , new CarProduction("Sep", 1626, 653, 693 ) , new CarProduction("Oct", 1478, 2236, 786 ) , new CarProduction("Nov", 1306, 1937, 599 ) , new CarProduction("Dec", 1607, 2138, 678 ) }; ObjectProvider objProvider = new ObjectProvider(production); chart1.getDataSourceSettings().setDataSource(objProvider); }public static class CarProduction { private CarProduction(String month, int sedan, int coupe, int SUV) { this.setMonth(month); this.setSedan(sedan); this.setCoupe(coupe); this.setSUV(SUV); } private String privateMonth; public final String getMonth() { return privateMonth; } public final void setMonth(String value) { privateMonth = value; } private int privateSedan; public final int getSedan() { return privateSedan; } public final void setSedan(int value) { privateSedan = value; } private int privateCoupe; public final int getCoupe() { return privateCoupe; } public final void setCoupe(int value) { privateCoupe = value; } private int privateSUV; public final int getSUV() { return privateSUV; } public final void setSUV(int value) { privateSUV = value; } }
- Parameters:
value-
-
getMinorStepDateTime
public java.util.Date getMinorStepDateTime()
Specifies the increment you want between minor tick marks and minor gridlines (if they are displayed) on the selected axis.
This method is used to control the interval of minor tick marks and gridlines in the selected axis. For example, if the selected axis ranges from 0-100 and you have specified a
setStepvalue of 10, labels and gridlines will appear at 10, 20, 30, etc. If you would like to have 5 minor tick marks in each major interval, set the MinorStep to 2. Please note the values for the Step and MinorStep methods are data related.Labels will not appear at minor tick marks.
The value of the
setMinorStepDateTimemethod must be lesser than the value of thesetStepmethod.When using the
setFirstLabelmethod in the X Axis of a chart with values ranging from 0 to 1, the axis' MinorStep is used to calculate which label is the first, second, third, etc. When X Axis values range bigger than 1, then the axissetStepis used for this calcuation.Below, the Y axis minor step is set to 100:
PopulateCarProduction(chart1);
chart1.getTitles().add(new TitleDockable("Vehicles Production by Type"));
chart1.getAxisY().getGrids().getMinor().setVisible(true);
chart1.getAxisY().getGrids().getMinor().setStyle(DashStyle.DOT);
chart1.getAxisY().setMinorStep(100);
public static void PopulateCarProduction(Chart chart1) { CarProduction[] production = new CarProduction[] { new CarProduction("Jan", 1760, 535, 695 ) , new CarProduction("Feb", 1849, 395, 688 ) , new CarProduction("Mar", 2831, 685, 1047 ) , new CarProduction("Apr", 2851, 984, 1652 ) , new CarProduction("May", 2961, 1579, 1889 ) , new CarProduction("Jun", 1519, 1539, 1766 ) , new CarProduction("Jul", 2633, 1489, 1361 ) , new CarProduction("Aug", 1140, 650, 874 ) , new CarProduction("Sep", 1626, 653, 693 ) , new CarProduction("Oct", 1478, 2236, 786 ) , new CarProduction("Nov", 1306, 1937, 599 ) , new CarProduction("Dec", 1607, 2138, 678 ) }; ObjectProvider objProvider = new ObjectProvider(production); chart1.getDataSourceSettings().setDataSource(objProvider); }public static class CarProduction { private CarProduction(String month, int sedan, int coupe, int SUV) { this.setMonth(month); this.setSedan(sedan); this.setCoupe(coupe); this.setSUV(SUV); } private String privateMonth; public final String getMonth() { return privateMonth; } public final void setMonth(String value) { privateMonth = value; } private int privateSedan; public final int getSedan() { return privateSedan; } public final void setSedan(int value) { privateSedan = value; } private int privateCoupe; public final int getCoupe() { return privateCoupe; } public final void setCoupe(int value) { privateCoupe = value; } private int privateSUV; public final int getSUV() { return privateSUV; } public final void setSUV(int value) { privateSUV = value; } }
-
setMinorStep
public void setMinorStep(java.util.Date value)
Specifies the increment you want between minor tick marks and minor gridlines (if they are displayed) on the selected axis.
This method is used to control the interval of minor tick marks and gridlines in the selected axis. For example, if the selected axis ranges from 0-100 and you have specified a
setStepvalue of 10, labels and gridlines will appear at 10, 20, 30, etc. If you would like to have 5 minor tick marks in each major interval, set the MinorStep to 2. Please note the values for the Step and MinorStep methods are data related.Labels will not appear at minor tick marks.
The value of the
setMinorStepDateTimemethod must be lesser than the value of thesetStepmethod.When using the
setFirstLabelmethod in the X Axis of a chart with values ranging from 0 to 1, the axis' MinorStep is used to calculate which label is the first, second, third, etc. When X Axis values range bigger than 1, then the axissetStepis used for this calcuation.Below, the Y axis minor step is set to 100:
PopulateCarProduction(chart1);
chart1.getTitles().add(new TitleDockable("Vehicles Production by Type"));
chart1.getAxisY().getGrids().getMinor().setVisible(true);
chart1.getAxisY().getGrids().getMinor().setStyle(DashStyle.DOT);
chart1.getAxisY().setMinorStep(100);
public static void PopulateCarProduction(Chart chart1) { CarProduction[] production = new CarProduction[] { new CarProduction("Jan", 1760, 535, 695 ) , new CarProduction("Feb", 1849, 395, 688 ) , new CarProduction("Mar", 2831, 685, 1047 ) , new CarProduction("Apr", 2851, 984, 1652 ) , new CarProduction("May", 2961, 1579, 1889 ) , new CarProduction("Jun", 1519, 1539, 1766 ) , new CarProduction("Jul", 2633, 1489, 1361 ) , new CarProduction("Aug", 1140, 650, 874 ) , new CarProduction("Sep", 1626, 653, 693 ) , new CarProduction("Oct", 1478, 2236, 786 ) , new CarProduction("Nov", 1306, 1937, 599 ) , new CarProduction("Dec", 1607, 2138, 678 ) }; ObjectProvider objProvider = new ObjectProvider(production); chart1.getDataSourceSettings().setDataSource(objProvider); }public static class CarProduction { private CarProduction(String month, int sedan, int coupe, int SUV) { this.setMonth(month); this.setSedan(sedan); this.setCoupe(coupe); this.setSUV(SUV); } private String privateMonth; public final String getMonth() { return privateMonth; } public final void setMonth(String value) { privateMonth = value; } private int privateSedan; public final int getSedan() { return privateSedan; } public final void setSedan(int value) { privateSedan = value; } private int privateCoupe; public final int getCoupe() { return privateCoupe; } public final void setCoupe(int value) { privateCoupe = value; } private int privateSUV; public final int getSUV() { return privateSUV; } public final void setSUV(int value) { privateSUV = value; } }
- Parameters:
value-
-
isNotify
public boolean isNotify()
Used to enable or disable the GetAxisLabel event so you can customize labels on the specified axis.
This method also applies to the
addGetPointLabelListenerevent. TheaddGetPointLabelListenerevent is raised when point labels are painted for a data series, AND the series is associated to a Y axis which Notify is set to true.If this method is set to false, the
addGetAxisLabelListeneroraddGetPointLabelListenerevents will not be raised. When set to true, it is possible for the developer to handle these events.To force Chart FX to generate the GetAxisLabel event for the primary Y axis:
chart1.getAxisY().setNotify(true);
- See Also:
resetNotify
-
setNotify
public void setNotify(boolean value)
Used to enable or disable the GetAxisLabel event so you can customize labels on the specified axis.
This method also applies to the
addGetPointLabelListenerevent. TheaddGetPointLabelListenerevent is raised when point labels are painted for a data series, AND the series is associated to a Y axis which Notify is set to true.If this method is set to false, the
addGetAxisLabelListeneroraddGetPointLabelListenerevents will not be raised. When set to true, it is possible for the developer to handle these events.To force Chart FX to generate the GetAxisLabel event for the primary Y axis:
chart1.getAxisY().setNotify(true);
- Parameters:
value-- See Also:
resetNotify
-
getPixelsPerUnit
public double getPixelsPerUnit()
Gives you the ability to control how many pixels per unit are in the selected axis. This property is very useful if you want a scroll bar in the selected axis.
The
setAxisY2does not support scrolling capabilities; therefore, this method is not supported for the Secondary Y axis.If the
isAutoScrollmethod is set to false, the PixelsPerUnit will not have any effect on the axis. Make sure that theisAutoScrollmethod is set to true when using thesetPixelsPerUnitmethod.The
setPixelsPerUnitmethod is very useful when you want to create a scroll bar associated with the selected axis or to increase the separation between tick marks. Its effect varies depending on the type of axis that is applied to. Below is a description of the PixelPerUnit based on the type of axis used:Categorical Axis:
When you set a PixelsPerUnit to a categorical axis (e.g. X Axis) the value is an integer that will set the separation (physical distance measured in pixels) between major tick marks. The default PixelsPerUnit value for the X axis (when categorical) is 30 pixels. You may want to change the PixelsPerUnit value for a categorical axis when:
1) The labels associated with the chart are too long and do not fit in the allotted space. In this particular case the PixelsPerUnit should be increased. What will happen is that if all points do not fit in one screen, a scroll bar will be shown.
2) You want to fit more points in one screen. In this particular case the PixelsPerUnit should be decreased. You must be careful with labels associated with each tick mark if the PixelsPerUnit is too small.
3) You want to view a specific amount of points per screen. In this particular case we recommend the use of the
setScrollViewmethod as it will allow you to set these values without any calculations on your part.4) If you don't want to show a scroll bar, you may set the PixelsPerUnit to zero (0). This will remove the scroll bar and will set the appropriate PixelsPerUnit to fit all values in one screen.
Numerical Axis:
When applied to a numerical axis (e.g. Y Axis), the
setPixelsPerUnitmethod is very useful to display a scroll bar and allow users to scroll through data without affecting the scale (Min, Max, Step) of the axis.Because a numerical axis can be displayed in different units (currency, scientific, date, etc) it is sometimes difficult to imagine what a PixelsPerUnit measures. This concept is even more complex when we take into consideration that a numerical axis ranges in different values (millions, thousands, fractions, etc).
When applied to a numerical axis, the PixelsPerUnit value is no longer an integer. The general rule of thumb is to take the size allotted to the chart (in pixels) divide it by the Maximum in the numeric axis and then divide that number by the number of pages you want the scroll bar to have.
For example, if you have a 400 pixels chart that ranges between Min=0 and Max=1 million and you want to create a scroll bar that contains 5 pages, the PixelsPerUnit should be set to:
PixelsPerUnit = (400/1000000)/5 = 0.00008, this means there are 0.00008 pixels per unit in the y axis.
On the other hand, if the same chart would have ranged between 0 and 1, the PixelsPerUnit setting must be calculated as follows:
PixelsPerUnit = (400/1)/5 = 80
Setting the PixelsPerUnit to zero(0) will remove the scroll bar and let calculate the appropriate PixelsPerUnit value.
In the following chart, the X axis PixelsPerUnit has been set to 120:
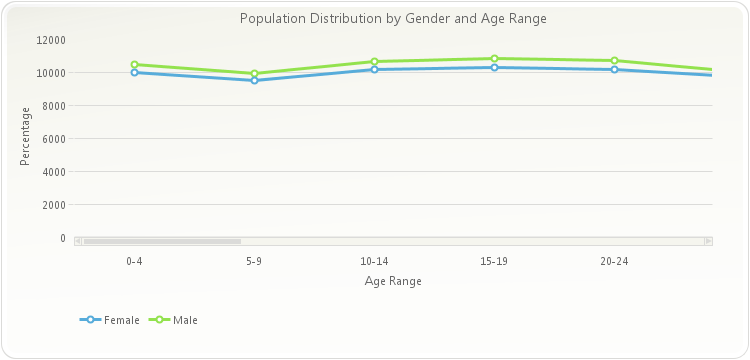
PopulatePopulationData(chart1);
chart1.getTitles().add(new TitleDockable("Population Distribution by Gender and Age Range"));
chart1.getAxisY().getTitle().setText("Percentage");
chart1.getAxisX().getTitle().setText("Age Range");
chart1.getLegendBox().setDock(DockArea.BOTTOM);
chart1.getAxisX().setAutoScroll(true);
chart1.getAxisX().setPixelsPerUnit(120);
public static void PopulatePopulationData(Chart chart1, String fieldNames) { PopulationData[] data = new PopulationData[]{ new PopulationData("0-4", 10471, 10024), new PopulationData("5-9", 9954, 9512), new PopulationData("10-14", 10670, 10167), new PopulationData("15-19", 10871, 10312), new PopulationData("20-24", 10719, 10178), new PopulationData("25-29", 10060, 9744), new PopulationData("30-34", 10021, 9864), new PopulationData("35-39", 10479, 10424), new PopulationData("40-44", 11294, 11454), new PopulationData("45-49", 11080, 11377), new PopulationData("50-54", 9772, 10212), new PopulationData("55-59", 8415, 8944), new PopulationData("60-64", 6203, 6814), new PopulationData("65-69", 4712, 5412), new PopulationData("70-74", 3804, 4697), new PopulationData("75-79", 3094, 4282), new PopulationData("80-84", 2117, 3459), new PopulationData("85-89", 1072, 2135), new PopulationData("90-94", 397, 1034), new PopulationData("95-99", 91, 321), new PopulationData("100+", 12, 58) }; ObjectProvider objProvider = new ObjectProvider(data); chart1.getDataSourceSettings().setDataSource(objProvider); if (fieldNames != "") { List<DataField> removeFields = new ArrayList<DataField>(); List<String> includeFields = Arrays.asList(fieldNames.split(",")); chart1.getDataSourceSettings().fillFromSchema(); for (DataField dataField : chart1.getDataSourceSettings().getDataFields()) { if (dataField.isMeasure() && !includeFields.contains(dataField.getDataPath())) { removeFields.add(dataField); } } for (DataField dataField : removeFields) { chart1.getDataSourceSettings().getDataFields().remove(dataField); } } } public static void PopulatePopulationData(Chart chart1) { PopulatePopulationData(chart1, ""); }public static class PopulationData { public PopulationData(String range, double male, double female) { this.setRange(range); this.setMale(male); this.setFemale(female); } private String privateRange; public final String getRange() { return privateRange; } public final void setRange(String value) { privateRange = value; } private double privateMale; public final double getMale() { return privateMale; } public final void setMale(double value) { privateMale = value; } private double privateFemale; public final double getFemale() { return privateFemale; } public final void setFemale(double value) { privateFemale = value; } }
- See Also:
resetPixelsPerUnit
-
setPixelsPerUnit
public void setPixelsPerUnit(double value)
Gives you the ability to control how many pixels per unit are in the selected axis. This property is very useful if you want a scroll bar in the selected axis.
The
setAxisY2does not support scrolling capabilities; therefore, this method is not supported for the Secondary Y axis.If the
isAutoScrollmethod is set to false, the PixelsPerUnit will not have any effect on the axis. Make sure that theisAutoScrollmethod is set to true when using thesetPixelsPerUnitmethod.The
setPixelsPerUnitmethod is very useful when you want to create a scroll bar associated with the selected axis or to increase the separation between tick marks. Its effect varies depending on the type of axis that is applied to. Below is a description of the PixelPerUnit based on the type of axis used:Categorical Axis:
When you set a PixelsPerUnit to a categorical axis (e.g. X Axis) the value is an integer that will set the separation (physical distance measured in pixels) between major tick marks. The default PixelsPerUnit value for the X axis (when categorical) is 30 pixels. You may want to change the PixelsPerUnit value for a categorical axis when:
1) The labels associated with the chart are too long and do not fit in the allotted space. In this particular case the PixelsPerUnit should be increased. What will happen is that if all points do not fit in one screen, a scroll bar will be shown.
2) You want to fit more points in one screen. In this particular case the PixelsPerUnit should be decreased. You must be careful with labels associated with each tick mark if the PixelsPerUnit is too small.
3) You want to view a specific amount of points per screen. In this particular case we recommend the use of the
setScrollViewmethod as it will allow you to set these values without any calculations on your part.4) If you don't want to show a scroll bar, you may set the PixelsPerUnit to zero (0). This will remove the scroll bar and will set the appropriate PixelsPerUnit to fit all values in one screen.
Numerical Axis:
When applied to a numerical axis (e.g. Y Axis), the
setPixelsPerUnitmethod is very useful to display a scroll bar and allow users to scroll through data without affecting the scale (Min, Max, Step) of the axis.Because a numerical axis can be displayed in different units (currency, scientific, date, etc) it is sometimes difficult to imagine what a PixelsPerUnit measures. This concept is even more complex when we take into consideration that a numerical axis ranges in different values (millions, thousands, fractions, etc).
When applied to a numerical axis, the PixelsPerUnit value is no longer an integer. The general rule of thumb is to take the size allotted to the chart (in pixels) divide it by the Maximum in the numeric axis and then divide that number by the number of pages you want the scroll bar to have.
For example, if you have a 400 pixels chart that ranges between Min=0 and Max=1 million and you want to create a scroll bar that contains 5 pages, the PixelsPerUnit should be set to:
PixelsPerUnit = (400/1000000)/5 = 0.00008, this means there are 0.00008 pixels per unit in the y axis.
On the other hand, if the same chart would have ranged between 0 and 1, the PixelsPerUnit setting must be calculated as follows:
PixelsPerUnit = (400/1)/5 = 80
Setting the PixelsPerUnit to zero(0) will remove the scroll bar and let calculate the appropriate PixelsPerUnit value.
In the following chart, the X axis PixelsPerUnit has been set to 120:
PopulatePopulationData(chart1);
chart1.getTitles().add(new TitleDockable("Population Distribution by Gender and Age Range"));
chart1.getAxisY().getTitle().setText("Percentage");
chart1.getAxisX().getTitle().setText("Age Range");
chart1.getLegendBox().setDock(DockArea.BOTTOM);
chart1.getAxisX().setAutoScroll(true);
chart1.getAxisX().setPixelsPerUnit(120);
public static void PopulatePopulationData(Chart chart1, String fieldNames) { PopulationData[] data = new PopulationData[]{ new PopulationData("0-4", 10471, 10024), new PopulationData("5-9", 9954, 9512), new PopulationData("10-14", 10670, 10167), new PopulationData("15-19", 10871, 10312), new PopulationData("20-24", 10719, 10178), new PopulationData("25-29", 10060, 9744), new PopulationData("30-34", 10021, 9864), new PopulationData("35-39", 10479, 10424), new PopulationData("40-44", 11294, 11454), new PopulationData("45-49", 11080, 11377), new PopulationData("50-54", 9772, 10212), new PopulationData("55-59", 8415, 8944), new PopulationData("60-64", 6203, 6814), new PopulationData("65-69", 4712, 5412), new PopulationData("70-74", 3804, 4697), new PopulationData("75-79", 3094, 4282), new PopulationData("80-84", 2117, 3459), new PopulationData("85-89", 1072, 2135), new PopulationData("90-94", 397, 1034), new PopulationData("95-99", 91, 321), new PopulationData("100+", 12, 58) }; ObjectProvider objProvider = new ObjectProvider(data); chart1.getDataSourceSettings().setDataSource(objProvider); if (fieldNames != "") { List<DataField> removeFields = new ArrayList<DataField>(); List<String> includeFields = Arrays.asList(fieldNames.split(",")); chart1.getDataSourceSettings().fillFromSchema(); for (DataField dataField : chart1.getDataSourceSettings().getDataFields()) { if (dataField.isMeasure() && !includeFields.contains(dataField.getDataPath())) { removeFields.add(dataField); } } for (DataField dataField : removeFields) { chart1.getDataSourceSettings().getDataFields().remove(dataField); } } } public static void PopulatePopulationData(Chart chart1) { PopulatePopulationData(chart1, ""); }public static class PopulationData { public PopulationData(String range, double male, double female) { this.setRange(range); this.setMale(male); this.setFemale(female); } private String privateRange; public final String getRange() { return privateRange; } public final void setRange(String value) { privateRange = value; } private double privateMale; public final double getMale() { return privateMale; } public final void setMale(double value) { privateMale = value; } private double privateFemale; public final double getFemale() { return privateFemale; } public final void setFemale(double value) { privateFemale = value; } }
- Parameters:
value-- See Also:
resetPixelsPerUnit
-
getPosition
public AxisPosition getPosition()
Specifies the placement of the axis labels and tick marks relative to the chart.
The
setPositionmethod is a member of the axis object; therefore, the axis object must be referenced in order to set the method correctly. Multiple axes may be created using the AxesX and the AxesY methods of theChartclass.Both X and Y axes have the Axis Position set to Far position in order to switch their default locations:
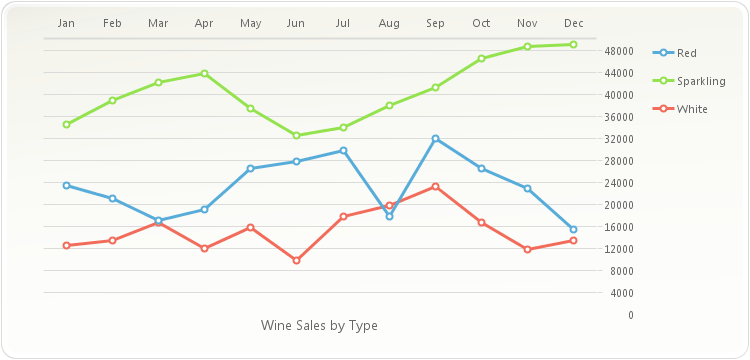
PopulateProductSales(chart1);
chart1.getTitles().add(new TitleDockable("Wine Sales by Type"));
chart1.getTitles().get(0).setDock(DockArea.BOTTOM);
chart1.getAxisX().setPosition(AxisPosition.FAR);
chart1.getAxisY().setPosition(AxisPosition.FAR);
public static void PopulateProductSales(Chart chart1) { ProductSales[] data = new ProductSales[]{ new ProductSales("Jan", 12560, 23400, 34500), new ProductSales("Feb", 13400, 21000, 38900), new ProductSales("Mar", 16700, 17000, 42100), new ProductSales("Apr", 12000, 19020, 43800), new ProductSales("May", 15800, 26500, 37540), new ProductSales("Jun", 9800, 27800, 32580), new ProductSales("Jul", 17800, 29820, 34000), new ProductSales("Aug", 19800, 17800, 38000), new ProductSales("Sep", 23200, 32000, 41300), new ProductSales("Oct", 16700, 26500, 46590), new ProductSales("Nov", 11800, 23000, 48700), new ProductSales("Dec", 13400, 15400, 49100) }; ObjectProvider objProvider = new ObjectProvider(data); chart1.getDataSourceSettings().setDataSource(objProvider); }public static class ProductSales { public ProductSales(String month, double white, double red, double sparkling) { this.setMonth(month); this.setWhite(white); this.setRed(red); this.setSparkling(sparkling); } private String privateMonth; public final String getMonth() { return privateMonth; } public final void setMonth(String value) { privateMonth = value; } private double privateWhite; public final double getWhite() { return privateWhite; } public final void setWhite(double value) { privateWhite = value; } private double privateRed; public final double getRed() { return privateRed; } public final void setRed(double value) { privateRed = value; } private double privateSparkling; public final double getSparkling() { return privateSparkling; } public final void setSparkling(double value) { privateSparkling = value; } }
- See Also:
resetPosition
-
setPosition
public void setPosition(AxisPosition value)
Specifies the placement of the axis labels and tick marks relative to the chart.
The
setPositionmethod is a member of the axis object; therefore, the axis object must be referenced in order to set the method correctly. Multiple axes may be created using the AxesX and the AxesY methods of theChartclass.Both X and Y axes have the Axis Position set to Far position in order to switch their default locations:
PopulateProductSales(chart1);
chart1.getTitles().add(new TitleDockable("Wine Sales by Type"));
chart1.getTitles().get(0).setDock(DockArea.BOTTOM);
chart1.getAxisX().setPosition(AxisPosition.FAR);
chart1.getAxisY().setPosition(AxisPosition.FAR);
public static void PopulateProductSales(Chart chart1) { ProductSales[] data = new ProductSales[]{ new ProductSales("Jan", 12560, 23400, 34500), new ProductSales("Feb", 13400, 21000, 38900), new ProductSales("Mar", 16700, 17000, 42100), new ProductSales("Apr", 12000, 19020, 43800), new ProductSales("May", 15800, 26500, 37540), new ProductSales("Jun", 9800, 27800, 32580), new ProductSales("Jul", 17800, 29820, 34000), new ProductSales("Aug", 19800, 17800, 38000), new ProductSales("Sep", 23200, 32000, 41300), new ProductSales("Oct", 16700, 26500, 46590), new ProductSales("Nov", 11800, 23000, 48700), new ProductSales("Dec", 13400, 15400, 49100) }; ObjectProvider objProvider = new ObjectProvider(data); chart1.getDataSourceSettings().setDataSource(objProvider); }public static class ProductSales { public ProductSales(String month, double white, double red, double sparkling) { this.setMonth(month); this.setWhite(white); this.setRed(red); this.setSparkling(sparkling); } private String privateMonth; public final String getMonth() { return privateMonth; } public final void setMonth(String value) { privateMonth = value; } private double privateWhite; public final double getWhite() { return privateWhite; } public final void setWhite(double value) { privateWhite = value; } private double privateRed; public final double getRed() { return privateRed; } public final void setRed(double value) { privateRed = value; } private double privateSparkling; public final double getSparkling() { return privateSparkling; } public final void setSparkling(double value) { privateSparkling = value; } }
- Parameters:
value-- See Also:
resetPosition
-
getScaleUnitTimeSpan
public TimeSpan getScaleUnitTimeSpan()
Returns the scale unit of a selected axis.
This constant is very useful when the values used on the Y axis are too big (e.g. 10,000,000) in this case you can use a 1,000,000 scale and the values on the Y axis will be divided by this scale.
The
setScaleUnitmethod is a member of the axis object; therefore, the axis object must be referenced in order to set the method correctly.To set the Scale Unit of the primary Y axis to 1000:
chart1.getAxisY().setScaleUnit(1000);
-
setScaleUnit
public void setScaleUnit(TimeSpan value)
Returns or Sets the scale unit of a selected axis.
This constant is very useful when the values used on the Y axis are too big (e.g. 10,000,000) in this case you can use a 1,000,000 scale and the values on the Y axis will be divided by this scale.
The
setScaleUnitmethod is a member of the axis object; therefore, the axis object must be referenced in order to set the method correctly.To set the Scale Unit of the primary Y axis to 1000:
chart1.getAxisY().setScaleUnit(1000);
- Parameters:
value-
-
getScaleUnit
public DataUnit getScaleUnit()
Returns the scale unit of a selected axis.
This constant is very useful when the values used on the Y axis are too big (e.g. 10,000,000) in this case you can use a 1,000,000 scale and the values on the Y axis will be divided by this scale.
The
setScaleUnitmethod is a member of the axis object; therefore, the axis object must be referenced in order to set the method correctly.To set the Scale Unit of the primary Y axis to 1000:
chart1.getAxisY().setScaleUnit(1000);
-
setScaleUnit
public void setScaleUnit(DataUnit value)
Returns or Sets the scale unit of a selected axis.
This constant is very useful when the values used on the Y axis are too big (e.g. 10,000,000) in this case you can use a 1,000,000 scale and the values on the Y axis will be divided by this scale.
The
setScaleUnitmethod is a member of the axis object; therefore, the axis object must be referenced in order to set the method correctly.To set the Scale Unit of the primary Y axis to 1000:
chart1.getAxisY().setScaleUnit(1000);
- Parameters:
value-
-
getScaleUnitDouble
public double getScaleUnitDouble()
Returns the scale unit of a selected axis.
This constant is very useful when the values used on the Y axis are too big (e.g. 10,000,000) in this case you can use a 1,000,000 scale and the values on the Y axis will be divided by this scale.
The
setScaleUnitmethod is a member of the axis object; therefore, the axis object must be referenced in order to set the method correctly.To set the Scale Unit of the primary Y axis to 1000:
chart1.getAxisY().setScaleUnit(1000);
-
setScaleUnit
public void setScaleUnit(double value)
Returns or Sets the scale unit of a selected axis.
This constant is very useful when the values used on the Y axis are too big (e.g. 10,000,000) in this case you can use a 1,000,000 scale and the values on the Y axis will be divided by this scale.
The
setScaleUnitmethod is a member of the axis object; therefore, the axis object must be referenced in order to set the method correctly.To set the Scale Unit of the primary Y axis to 1000:
chart1.getAxisY().setScaleUnit(1000);
- Parameters:
value-
-
getScaleUnitDateTime
public java.util.Date getScaleUnitDateTime()
Returns the scale unit of a selected axis.
This constant is very useful when the values used on the Y axis are too big (e.g. 10,000,000) in this case you can use a 1,000,000 scale and the values on the Y axis will be divided by this scale.
The
setScaleUnitmethod is a member of the axis object; therefore, the axis object must be referenced in order to set the method correctly.To set the Scale Unit of the primary Y axis to 1000:
chart1.getAxisY().setScaleUnit(1000);
-
setScaleUnit
public void setScaleUnit(java.util.Date value)
Returns or Sets the scale unit of a selected axis.
This constant is very useful when the values used on the Y axis are too big (e.g. 10,000,000) in this case you can use a 1,000,000 scale and the values on the Y axis will be divided by this scale.
The
setScaleUnitmethod is a member of the axis object; therefore, the axis object must be referenced in order to set the method correctly.To set the Scale Unit of the primary Y axis to 1000:
chart1.getAxisY().setScaleUnit(1000);
- Parameters:
value-
-
getScrollPosition
public int getScrollPosition()
Description goes here
-
setScrollPosition
public void setScrollPosition(int value)
Description goes here- Parameters:
value-
-
getScrollPositionPercentage
public double getScrollPositionPercentage()
Allows you to set the starting percentage scroll position, when a chart is scrollable.
The
isAutoScrollmethod of the chart must be set to true in order for the ScrollPositionPercentage to be properly used.The chart selected axis is divided in a percentage, when 0% representing the axis min value and 100% representing the axis max value.
When you set the ScrollPositionPercentage, the first point showed in the chart will be the point located in the equivalent percentage.
You can set the scroll range using the
setScrollViewmethod.Set the scroll position for the Y axis in the 50% of the scroll bar:
chart1.getAxisY().setScrollPositionPercentage(0.5);
-
setScrollPositionPercentage
public void setScrollPositionPercentage(double value)
Allows you to set the starting percentage scroll position, when a chart is scrollable.
The
isAutoScrollmethod of the chart must be set to true in order for the ScrollPositionPercentage to be properly used.The chart selected axis is divided in a percentage, when 0% representing the axis min value and 100% representing the axis max value.
When you set the ScrollPositionPercentage, the first point showed in the chart will be the point located in the equivalent percentage.
You can set the scroll range using the
setScrollViewmethod.Set the scroll position for the Y axis in the 50% of the scroll bar:
chart1.getAxisY().setScrollPositionPercentage(0.5);
- Parameters:
value-
-
getScrollPositionPixel
public int getScrollPositionPixel()
Allows you to set the starting scroll position (in pixels) when a chart is scrollable.
The
isAutoScrollmethod of the chart must be set to true in order for the ScrollPositionPixel to be properly used.The value range varies from 0 to the number of pixels the axis has.
The number of pixels for the axis can be calculated multiplying the number of points by the
setPixelsPerUnit.
Set the scroll position for the X axis on pixel 500:
chart1.getAxisX().setScrollPositionPixel(500);
- See Also:
resetScrollPositionPixel
-
setScrollPositionPixel
public void setScrollPositionPixel(int value)
Allows you to set the starting scroll position (in pixels) when a chart is scrollable.
The
isAutoScrollmethod of the chart must be set to true in order for the ScrollPositionPixel to be properly used.The value range varies from 0 to the number of pixels the axis has.
The number of pixels for the axis can be calculated multiplying the number of points by the
setPixelsPerUnit.
Set the scroll position for the X axis on pixel 500:
chart1.getAxisX().setScrollPositionPixel(500);
- Parameters:
value-- See Also:
resetScrollPositionPixel
-
getScrollSize
public int getScrollSize()
Description goes here
-
getScrollViewMaxTimeSpan
public TimeSpan getScrollViewMaxTimeSpan()
Description goes here. This member is an Implicit conversion from ScrollViewMax member.
-
getScrollViewMax
public DataUnit getScrollViewMax()
Description goes here
-
getScrollViewMaxDouble
public double getScrollViewMaxDouble()
Description goes here. This member is an Implicit conversion from ScrollViewMax member.
-
getScrollViewMaxDateTime
public java.util.Date getScrollViewMaxDateTime()
Description goes here. This member is an Implicit conversion from ScrollViewMax member.
-
getScrollViewMinTimeSpan
public TimeSpan getScrollViewMinTimeSpan()
Description goes here. This member is an Implicit conversion from ScrollViewMin member.
-
getScrollViewMin
public DataUnit getScrollViewMin()
Description goes here
-
getScrollViewMinDouble
public double getScrollViewMinDouble()
Description goes here. This member is an Implicit conversion from ScrollViewMin member.
-
getScrollViewMinDateTime
public java.util.Date getScrollViewMinDateTime()
Description goes here. This member is an Implicit conversion from ScrollViewMin member.
-
getSections
public java.util.List<AxisSection> getSections()
Returns a selected AxisSection object.
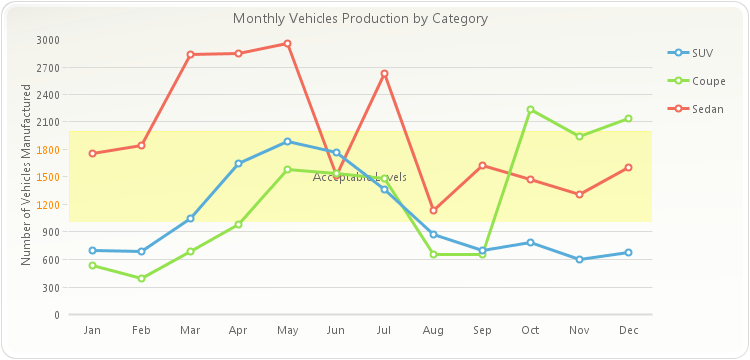
PopulateCarProduction(chart1);
chart1.getTitles().add(new TitleDockable("Monthly Vehicles Production by Category"));
chart1.getAxisY().getTitle().setText("Number of Vehicles Manufactured");
AxisSection section;
section = new AxisSection();
chart1.getAxisY().getSections().add(section);
section.setBackColor(new java.awt.Color( 255, 255, 0,64));
section.setFrom(1000);
section.setTo(2000);
section.getGrids().getMajor().setVisible(false);
section.setTextColor(new java.awt.Color(255,140,0,255));
section.getTitle().setText("Acceptable Levels");
/*  This line is required to avoid showing the sections on the legend box. Any section with a title will *\/
/*  appear by default on the legend box *\/
chart1.getLegendBox().getItemAttributes().get(((ILegendBoxItemCollection)chart1.getAxisY().getSections())).setVisible(false);
public static void PopulateCarProduction(Chart chart1) { CarProduction[] production = new CarProduction[] { new CarProduction("Jan", 1760, 535, 695 ) , new CarProduction("Feb", 1849, 395, 688 ) , new CarProduction("Mar", 2831, 685, 1047 ) , new CarProduction("Apr", 2851, 984, 1652 ) , new CarProduction("May", 2961, 1579, 1889 ) , new CarProduction("Jun", 1519, 1539, 1766 ) , new CarProduction("Jul", 2633, 1489, 1361 ) , new CarProduction("Aug", 1140, 650, 874 ) , new CarProduction("Sep", 1626, 653, 693 ) , new CarProduction("Oct", 1478, 2236, 786 ) , new CarProduction("Nov", 1306, 1937, 599 ) , new CarProduction("Dec", 1607, 2138, 678 ) }; ObjectProvider objProvider = new ObjectProvider(production); chart1.getDataSourceSettings().setDataSource(objProvider); }public static class CarProduction { private CarProduction(String month, int sedan, int coupe, int SUV) { this.setMonth(month); this.setSedan(sedan); this.setCoupe(coupe); this.setSUV(SUV); } private String privateMonth; public final String getMonth() { return privateMonth; } public final void setMonth(String value) { privateMonth = value; } private int privateSedan; public final int getSedan() { return privateSedan; } public final void setSedan(int value) { privateSedan = value; } private int privateCoupe; public final int getCoupe() { return privateCoupe; } public final void setCoupe(int value) { privateCoupe = value; } private int privateSUV; public final int getSUV() { return privateSUV; } public final void setSUV(int value) { privateSUV = value; } }
-
getSeparation
public int getSeparation()
Allows you to specify a gap in pixels between multiple axis.
This method is useful when multiple axes are configured and you need to create space for readability.
To configure a 5 pixel separation on the secondary Y axis:
Axis axisY2;
axisY2 = chart1.getAxesY().get(1);
axisY2.setSeparation(5);
- See Also:
resetSeparation
-
setSeparation
public void setSeparation(int value)
Allows you to specify a gap in pixels between multiple axis.
This method is useful when multiple axes are configured and you need to create space for readability.
To configure a 5 pixel separation on the secondary Y axis:
Axis axisY2;
axisY2 = chart1.getAxesY().get(1);
axisY2.setSeparation(5);
- Parameters:
value-- See Also:
resetSeparation
-
isStaggered
public boolean isStaggered()
Alternates the level of the axis labels for the selected axis.
Staggering axis labels can help improve chart readability when axis label strings are long.
To stagger axis labels on two levels:
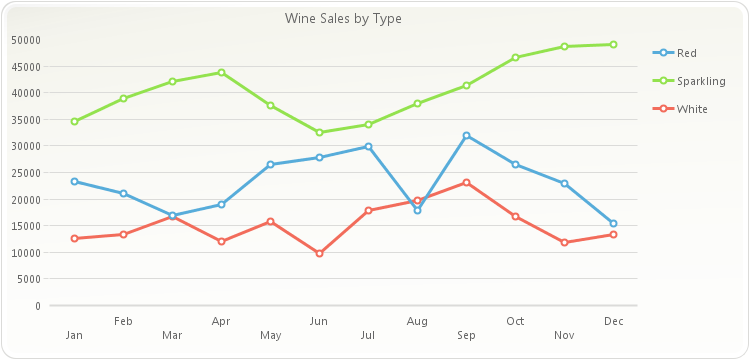
PopulateProductSales(chart1);
chart1.getTitles().add(new TitleDockable("Wine Sales by Type"));
chart1.getAxisX().setStaggered(true);
public static void PopulateProductSales(Chart chart1) { ProductSales[] data = new ProductSales[]{ new ProductSales("Jan", 12560, 23400, 34500), new ProductSales("Feb", 13400, 21000, 38900), new ProductSales("Mar", 16700, 17000, 42100), new ProductSales("Apr", 12000, 19020, 43800), new ProductSales("May", 15800, 26500, 37540), new ProductSales("Jun", 9800, 27800, 32580), new ProductSales("Jul", 17800, 29820, 34000), new ProductSales("Aug", 19800, 17800, 38000), new ProductSales("Sep", 23200, 32000, 41300), new ProductSales("Oct", 16700, 26500, 46590), new ProductSales("Nov", 11800, 23000, 48700), new ProductSales("Dec", 13400, 15400, 49100) }; ObjectProvider objProvider = new ObjectProvider(data); chart1.getDataSourceSettings().setDataSource(objProvider); }public static class ProductSales { public ProductSales(String month, double white, double red, double sparkling) { this.setMonth(month); this.setWhite(white); this.setRed(red); this.setSparkling(sparkling); } private String privateMonth; public final String getMonth() { return privateMonth; } public final void setMonth(String value) { privateMonth = value; } private double privateWhite; public final double getWhite() { return privateWhite; } public final void setWhite(double value) { privateWhite = value; } private double privateRed; public final double getRed() { return privateRed; } public final void setRed(double value) { privateRed = value; } private double privateSparkling; public final double getSparkling() { return privateSparkling; } public final void setSparkling(double value) { privateSparkling = value; } }
- See Also:
resetStaggered
-
setStaggered
public void setStaggered(boolean value)
Alternates the level of the axis labels for the selected axis.
Staggering axis labels can help improve chart readability when axis label strings are long.
To stagger axis labels on two levels:
PopulateProductSales(chart1);
chart1.getTitles().add(new TitleDockable("Wine Sales by Type"));
chart1.getAxisX().setStaggered(true);
public static void PopulateProductSales(Chart chart1) { ProductSales[] data = new ProductSales[]{ new ProductSales("Jan", 12560, 23400, 34500), new ProductSales("Feb", 13400, 21000, 38900), new ProductSales("Mar", 16700, 17000, 42100), new ProductSales("Apr", 12000, 19020, 43800), new ProductSales("May", 15800, 26500, 37540), new ProductSales("Jun", 9800, 27800, 32580), new ProductSales("Jul", 17800, 29820, 34000), new ProductSales("Aug", 19800, 17800, 38000), new ProductSales("Sep", 23200, 32000, 41300), new ProductSales("Oct", 16700, 26500, 46590), new ProductSales("Nov", 11800, 23000, 48700), new ProductSales("Dec", 13400, 15400, 49100) }; ObjectProvider objProvider = new ObjectProvider(data); chart1.getDataSourceSettings().setDataSource(objProvider); }public static class ProductSales { public ProductSales(String month, double white, double red, double sparkling) { this.setMonth(month); this.setWhite(white); this.setRed(red); this.setSparkling(sparkling); } private String privateMonth; public final String getMonth() { return privateMonth; } public final void setMonth(String value) { privateMonth = value; } private double privateWhite; public final double getWhite() { return privateWhite; } public final void setWhite(double value) { privateWhite = value; } private double privateRed; public final double getRed() { return privateRed; } public final void setRed(double value) { privateRed = value; } private double privateSparkling; public final double getSparkling() { return privateSparkling; } public final void setSparkling(double value) { privateSparkling = value; } }
- Parameters:
value-- See Also:
resetStaggered
-
getStepTimeSpan
public TimeSpan getStepTimeSpan()
Specifies the interval of major tick marks and gridlines on the selected axis. It also controls the gap or interval between labels in the selected axis.
Normally, you use this method to control the interval of labels, tick marks and gridlines in the selected axis. For example, if the selected axis ranges from 0 -100 and you want to show labels, tick marks or gridlines every 10 units, then the appropriate setting for the
setStepmethod is 10.This method can also be used for a categorical axis. For example, if your X axis displays labels ranging from January to December and you set the
setStepmethod to 2, then the categorical axis will display legends every other month.You can also control a minor interval with the
setMinorStepDateTimemethod.If no Step value is specified, Chart FX will automatically set a Step according to the data provided, you can use this method to read or write this default value.
Changing the data contained in a chart will not automatically change the Step value. If you want Chart FX to calculate an appropriate Step value automatically set the Step value to 0 (Automatic) or invoke the
recalculateScalemethod.The value of the
setStepmethod must be greater than the value of thesetMinorStepDateTimemethod.When using the
setFirstLabelmethod in the X Axis of a chart with values ranging from 0 to 1, the axissetMinorStepDateTimeis used to calculate which label is the first, second, third, etc. When X Axis values range bigger than 1, then the axis Step is used for this calcuation.To set the major interval of the primary Y axis to 25:
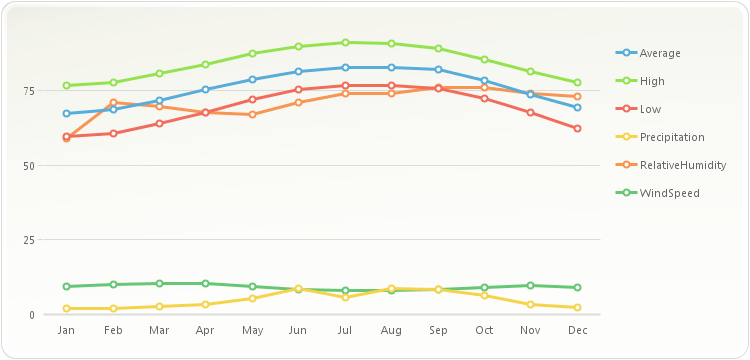
PopulateMiamiClimate(chart1);
chart1.getAxisY().setStep(25);
public static void PopulateMiamiClimate(Chart chart1, String fieldNames) {
    MiamiClimate[] data = new MiamiClimate[] {
        new MiamiClimate("Jan", 59.6, 76.5, 67.2, 1.88, 9.5, 59 ),
        new MiamiClimate("Feb", 60.5, 77.7, 68.5, 2.07, 10.1, 71 ),
        new MiamiClimate("Mar", 64, 80.7, 71.7, 2.56, 10.5, 69.5 ),
        new MiamiClimate("Apr", 67.6, 83.8, 75.2, 3.36, 10.5, 67.5 ),
        new MiamiClimate("May", 72, 87.2, 78.7, 5.52, 9.5, 67 ),
        new MiamiClimate("Jun", 75.2, 89.5, 81.4, 8.54, 8.3, 71 ),
        new MiamiClimate("Jul", 76.5, 90.9, 82.6, 5.79, 7.9, 74 ),
        new MiamiClimate("Aug", 76.5, 90.6, 82.8, 8.63, 7.9, 74 ),
        new MiamiClimate("Sep", 75.7, 89, 81.9, 8.38, 8.2, 76 ),
        new MiamiClimate("Oct", 72.2, 85.4, 78.3, 6.19, 9.2, 76 ),
        new MiamiClimate("Nov", 67.5, 81.2, 73.6, 3.43, 9.7, 74 ),
        new MiamiClimate("Dec", 62.2, 77.5, 69.1, 2.18, 9.2, 73 )
};
    ObjectProvider objProvider = new ObjectProvider(data);
    chart1.getDataSourceSettings().setDataSource(objProvider);


        if (fieldNames != ""){
                List<DataField> removeFields = new ArrayList<DataField>();
                List<String> includeFields = Arrays.asList(fieldNames.split(","));
                chart1.getDataSourceSettings().fillFromSchema();

                for (DataField dataField : chart1.getDataSourceSettings().getDataFields()) {
                        if (dataField.isMeasure() && !includeFields.contains(dataField.getDataPath())) {
                                removeFields.add(dataField);
                        }

                }

                for (DataField dataField : removeFields) {
                        chart1.getDataSourceSettings().getDataFields().remove(dataField);
                }
        }
}
public static void PopulateMiamiClimate(Chart chart1) {
        PopulateMiamiClimate(chart1, "");
}
public static class MiamiClimate { public MiamiClimate(String Month, double low, double high, double average, double precipitation, double windSpeed, double relativeHumidity) { this.setMonth(Month); this.setLow(low); this.setHigh(high); this.setAverage(average); this.setPrecipitation(precipitation); this.setWindSpeed(windSpeed); this.setRelativeHumidity(relativeHumidity); } private String privateMonth; public final String getMonth() { return privateMonth; } public final void setMonth(String value) { privateMonth = value; } private double privateLow; public final double getLow() { return privateLow; } public final void setLow(double value) { privateLow = value; } private double privateHigh; public final double getHigh() { return privateHigh; } public final void setHigh(double value) { privateHigh = value; } private double privateAverage; public final double getAverage() { return privateAverage; } public final void setAverage(double value) { privateAverage = value; } private double privatePrecipitation; public final double getPrecipitation() { return privatePrecipitation; } public final void setPrecipitation(double value) { privatePrecipitation = value; } private double privateWindSpeed; public final double getWindSpeed() { return privateWindSpeed; } public final void setWindSpeed(double value) { privateWindSpeed = value; } private double privateRelativeHumidity; public final double getRelativeHumidity() { return privateRelativeHumidity; } public final void setRelativeHumidity(double value) { privateRelativeHumidity = value; } }
-
setStep
public void setStep(TimeSpan value)
Specifies the interval of major tick marks and gridlines on the selected axis. It also controls the gap or interval between labels in the selected axis.
Normally, you use this method to control the interval of labels, tick marks and gridlines in the selected axis. For example, if the selected axis ranges from 0 -100 and you want to show labels, tick marks or gridlines every 10 units, then the appropriate setting for the
setStepmethod is 10.This method can also be used for a categorical axis. For example, if your X axis displays labels ranging from January to December and you set the
setStepmethod to 2, then the categorical axis will display legends every other month.You can also control a minor interval with the
setMinorStepDateTimemethod.If no Step value is specified, Chart FX will automatically set a Step according to the data provided, you can use this method to read or write this default value.
Changing the data contained in a chart will not automatically change the Step value. If you want Chart FX to calculate an appropriate Step value automatically set the Step value to 0 (Automatic) or invoke the
recalculateScalemethod.The value of the
setStepmethod must be greater than the value of thesetMinorStepDateTimemethod.When using the
setFirstLabelmethod in the X Axis of a chart with values ranging from 0 to 1, the axissetMinorStepDateTimeis used to calculate which label is the first, second, third, etc. When X Axis values range bigger than 1, then the axis Step is used for this calcuation.To set the major interval of the primary Y axis to 25:
PopulateMiamiClimate(chart1);
chart1.getAxisY().setStep(25);
public static void PopulateMiamiClimate(Chart chart1, String fieldNames) {
    MiamiClimate[] data = new MiamiClimate[] {
        new MiamiClimate("Jan", 59.6, 76.5, 67.2, 1.88, 9.5, 59 ),
        new MiamiClimate("Feb", 60.5, 77.7, 68.5, 2.07, 10.1, 71 ),
        new MiamiClimate("Mar", 64, 80.7, 71.7, 2.56, 10.5, 69.5 ),
        new MiamiClimate("Apr", 67.6, 83.8, 75.2, 3.36, 10.5, 67.5 ),
        new MiamiClimate("May", 72, 87.2, 78.7, 5.52, 9.5, 67 ),
        new MiamiClimate("Jun", 75.2, 89.5, 81.4, 8.54, 8.3, 71 ),
        new MiamiClimate("Jul", 76.5, 90.9, 82.6, 5.79, 7.9, 74 ),
        new MiamiClimate("Aug", 76.5, 90.6, 82.8, 8.63, 7.9, 74 ),
        new MiamiClimate("Sep", 75.7, 89, 81.9, 8.38, 8.2, 76 ),
        new MiamiClimate("Oct", 72.2, 85.4, 78.3, 6.19, 9.2, 76 ),
        new MiamiClimate("Nov", 67.5, 81.2, 73.6, 3.43, 9.7, 74 ),
        new MiamiClimate("Dec", 62.2, 77.5, 69.1, 2.18, 9.2, 73 )
};
    ObjectProvider objProvider = new ObjectProvider(data);
    chart1.getDataSourceSettings().setDataSource(objProvider);


        if (fieldNames != ""){
                List<DataField> removeFields = new ArrayList<DataField>();
                List<String> includeFields = Arrays.asList(fieldNames.split(","));
                chart1.getDataSourceSettings().fillFromSchema();

                for (DataField dataField : chart1.getDataSourceSettings().getDataFields()) {
                        if (dataField.isMeasure() && !includeFields.contains(dataField.getDataPath())) {
                                removeFields.add(dataField);
                        }

                }

                for (DataField dataField : removeFields) {
                        chart1.getDataSourceSettings().getDataFields().remove(dataField);
                }
        }
}
public static void PopulateMiamiClimate(Chart chart1) {
        PopulateMiamiClimate(chart1, "");
}
public static class MiamiClimate { public MiamiClimate(String Month, double low, double high, double average, double precipitation, double windSpeed, double relativeHumidity) { this.setMonth(Month); this.setLow(low); this.setHigh(high); this.setAverage(average); this.setPrecipitation(precipitation); this.setWindSpeed(windSpeed); this.setRelativeHumidity(relativeHumidity); } private String privateMonth; public final String getMonth() { return privateMonth; } public final void setMonth(String value) { privateMonth = value; } private double privateLow; public final double getLow() { return privateLow; } public final void setLow(double value) { privateLow = value; } private double privateHigh; public final double getHigh() { return privateHigh; } public final void setHigh(double value) { privateHigh = value; } private double privateAverage; public final double getAverage() { return privateAverage; } public final void setAverage(double value) { privateAverage = value; } private double privatePrecipitation; public final double getPrecipitation() { return privatePrecipitation; } public final void setPrecipitation(double value) { privatePrecipitation = value; } private double privateWindSpeed; public final double getWindSpeed() { return privateWindSpeed; } public final void setWindSpeed(double value) { privateWindSpeed = value; } private double privateRelativeHumidity; public final double getRelativeHumidity() { return privateRelativeHumidity; } public final void setRelativeHumidity(double value) { privateRelativeHumidity = value; } }
- Parameters:
value-
-
getStep
public DataUnit getStep()
Specifies the interval of major tick marks and gridlines on the selected axis. It also controls the gap or interval between labels in the selected axis.
Normally, you use this method to control the interval of labels, tick marks and gridlines in the selected axis. For example, if the selected axis ranges from 0 -100 and you want to show labels, tick marks or gridlines every 10 units, then the appropriate setting for the
setStepmethod is 10.This method can also be used for a categorical axis. For example, if your X axis displays labels ranging from January to December and you set the
setStepmethod to 2, then the categorical axis will display legends every other month.You can also control a minor interval with the
setMinorStepDateTimemethod.If no Step value is specified, Chart FX will automatically set a Step according to the data provided, you can use this method to read or write this default value.
Changing the data contained in a chart will not automatically change the Step value. If you want Chart FX to calculate an appropriate Step value automatically set the Step value to 0 (Automatic) or invoke the
recalculateScalemethod.The value of the
setStepmethod must be greater than the value of thesetMinorStepDateTimemethod.When using the
setFirstLabelmethod in the X Axis of a chart with values ranging from 0 to 1, the axissetMinorStepDateTimeis used to calculate which label is the first, second, third, etc. When X Axis values range bigger than 1, then the axis Step is used for this calcuation.To set the major interval of the primary Y axis to 25:
PopulateMiamiClimate(chart1);
chart1.getAxisY().setStep(25);
public static void PopulateMiamiClimate(Chart chart1, String fieldNames) {
    MiamiClimate[] data = new MiamiClimate[] {
        new MiamiClimate("Jan", 59.6, 76.5, 67.2, 1.88, 9.5, 59 ),
        new MiamiClimate("Feb", 60.5, 77.7, 68.5, 2.07, 10.1, 71 ),
        new MiamiClimate("Mar", 64, 80.7, 71.7, 2.56, 10.5, 69.5 ),
        new MiamiClimate("Apr", 67.6, 83.8, 75.2, 3.36, 10.5, 67.5 ),
        new MiamiClimate("May", 72, 87.2, 78.7, 5.52, 9.5, 67 ),
        new MiamiClimate("Jun", 75.2, 89.5, 81.4, 8.54, 8.3, 71 ),
        new MiamiClimate("Jul", 76.5, 90.9, 82.6, 5.79, 7.9, 74 ),
        new MiamiClimate("Aug", 76.5, 90.6, 82.8, 8.63, 7.9, 74 ),
        new MiamiClimate("Sep", 75.7, 89, 81.9, 8.38, 8.2, 76 ),
        new MiamiClimate("Oct", 72.2, 85.4, 78.3, 6.19, 9.2, 76 ),
        new MiamiClimate("Nov", 67.5, 81.2, 73.6, 3.43, 9.7, 74 ),
        new MiamiClimate("Dec", 62.2, 77.5, 69.1, 2.18, 9.2, 73 )
};
    ObjectProvider objProvider = new ObjectProvider(data);
    chart1.getDataSourceSettings().setDataSource(objProvider);


        if (fieldNames != ""){
                List<DataField> removeFields = new ArrayList<DataField>();
                List<String> includeFields = Arrays.asList(fieldNames.split(","));
                chart1.getDataSourceSettings().fillFromSchema();

                for (DataField dataField : chart1.getDataSourceSettings().getDataFields()) {
                        if (dataField.isMeasure() && !includeFields.contains(dataField.getDataPath())) {
                                removeFields.add(dataField);
                        }

                }

                for (DataField dataField : removeFields) {
                        chart1.getDataSourceSettings().getDataFields().remove(dataField);
                }
        }
}
public static void PopulateMiamiClimate(Chart chart1) {
        PopulateMiamiClimate(chart1, "");
}
public static class MiamiClimate { public MiamiClimate(String Month, double low, double high, double average, double precipitation, double windSpeed, double relativeHumidity) { this.setMonth(Month); this.setLow(low); this.setHigh(high); this.setAverage(average); this.setPrecipitation(precipitation); this.setWindSpeed(windSpeed); this.setRelativeHumidity(relativeHumidity); } private String privateMonth; public final String getMonth() { return privateMonth; } public final void setMonth(String value) { privateMonth = value; } private double privateLow; public final double getLow() { return privateLow; } public final void setLow(double value) { privateLow = value; } private double privateHigh; public final double getHigh() { return privateHigh; } public final void setHigh(double value) { privateHigh = value; } private double privateAverage; public final double getAverage() { return privateAverage; } public final void setAverage(double value) { privateAverage = value; } private double privatePrecipitation; public final double getPrecipitation() { return privatePrecipitation; } public final void setPrecipitation(double value) { privatePrecipitation = value; } private double privateWindSpeed; public final double getWindSpeed() { return privateWindSpeed; } public final void setWindSpeed(double value) { privateWindSpeed = value; } private double privateRelativeHumidity; public final double getRelativeHumidity() { return privateRelativeHumidity; } public final void setRelativeHumidity(double value) { privateRelativeHumidity = value; } }
-
setStep
public void setStep(DataUnit value)
Specifies the interval of major tick marks and gridlines on the selected axis. It also controls the gap or interval between labels in the selected axis.
Normally, you use this method to control the interval of labels, tick marks and gridlines in the selected axis. For example, if the selected axis ranges from 0 -100 and you want to show labels, tick marks or gridlines every 10 units, then the appropriate setting for the
setStepmethod is 10.This method can also be used for a categorical axis. For example, if your X axis displays labels ranging from January to December and you set the
setStepmethod to 2, then the categorical axis will display legends every other month.You can also control a minor interval with the
setMinorStepDateTimemethod.If no Step value is specified, Chart FX will automatically set a Step according to the data provided, you can use this method to read or write this default value.
Changing the data contained in a chart will not automatically change the Step value. If you want Chart FX to calculate an appropriate Step value automatically set the Step value to 0 (Automatic) or invoke the
recalculateScalemethod.The value of the
setStepmethod must be greater than the value of thesetMinorStepDateTimemethod.When using the
setFirstLabelmethod in the X Axis of a chart with values ranging from 0 to 1, the axissetMinorStepDateTimeis used to calculate which label is the first, second, third, etc. When X Axis values range bigger than 1, then the axis Step is used for this calcuation.To set the major interval of the primary Y axis to 25:
PopulateMiamiClimate(chart1);
chart1.getAxisY().setStep(25);
public static void PopulateMiamiClimate(Chart chart1, String fieldNames) {
    MiamiClimate[] data = new MiamiClimate[] {
        new MiamiClimate("Jan", 59.6, 76.5, 67.2, 1.88, 9.5, 59 ),
        new MiamiClimate("Feb", 60.5, 77.7, 68.5, 2.07, 10.1, 71 ),
        new MiamiClimate("Mar", 64, 80.7, 71.7, 2.56, 10.5, 69.5 ),
        new MiamiClimate("Apr", 67.6, 83.8, 75.2, 3.36, 10.5, 67.5 ),
        new MiamiClimate("May", 72, 87.2, 78.7, 5.52, 9.5, 67 ),
        new MiamiClimate("Jun", 75.2, 89.5, 81.4, 8.54, 8.3, 71 ),
        new MiamiClimate("Jul", 76.5, 90.9, 82.6, 5.79, 7.9, 74 ),
        new MiamiClimate("Aug", 76.5, 90.6, 82.8, 8.63, 7.9, 74 ),
        new MiamiClimate("Sep", 75.7, 89, 81.9, 8.38, 8.2, 76 ),
        new MiamiClimate("Oct", 72.2, 85.4, 78.3, 6.19, 9.2, 76 ),
        new MiamiClimate("Nov", 67.5, 81.2, 73.6, 3.43, 9.7, 74 ),
        new MiamiClimate("Dec", 62.2, 77.5, 69.1, 2.18, 9.2, 73 )
};
    ObjectProvider objProvider = new ObjectProvider(data);
    chart1.getDataSourceSettings().setDataSource(objProvider);


        if (fieldNames != ""){
                List<DataField> removeFields = new ArrayList<DataField>();
                List<String> includeFields = Arrays.asList(fieldNames.split(","));
                chart1.getDataSourceSettings().fillFromSchema();

                for (DataField dataField : chart1.getDataSourceSettings().getDataFields()) {
                        if (dataField.isMeasure() && !includeFields.contains(dataField.getDataPath())) {
                                removeFields.add(dataField);
                        }

                }

                for (DataField dataField : removeFields) {
                        chart1.getDataSourceSettings().getDataFields().remove(dataField);
                }
        }
}
public static void PopulateMiamiClimate(Chart chart1) {
        PopulateMiamiClimate(chart1, "");
}
public static class MiamiClimate { public MiamiClimate(String Month, double low, double high, double average, double precipitation, double windSpeed, double relativeHumidity) { this.setMonth(Month); this.setLow(low); this.setHigh(high); this.setAverage(average); this.setPrecipitation(precipitation); this.setWindSpeed(windSpeed); this.setRelativeHumidity(relativeHumidity); } private String privateMonth; public final String getMonth() { return privateMonth; } public final void setMonth(String value) { privateMonth = value; } private double privateLow; public final double getLow() { return privateLow; } public final void setLow(double value) { privateLow = value; } private double privateHigh; public final double getHigh() { return privateHigh; } public final void setHigh(double value) { privateHigh = value; } private double privateAverage; public final double getAverage() { return privateAverage; } public final void setAverage(double value) { privateAverage = value; } private double privatePrecipitation; public final double getPrecipitation() { return privatePrecipitation; } public final void setPrecipitation(double value) { privatePrecipitation = value; } private double privateWindSpeed; public final double getWindSpeed() { return privateWindSpeed; } public final void setWindSpeed(double value) { privateWindSpeed = value; } private double privateRelativeHumidity; public final double getRelativeHumidity() { return privateRelativeHumidity; } public final void setRelativeHumidity(double value) { privateRelativeHumidity = value; } }
- Parameters:
value-
-
getStepDouble
public double getStepDouble()
Specifies the interval of major tick marks and gridlines on the selected axis. It also controls the gap or interval between labels in the selected axis.
Normally, you use this method to control the interval of labels, tick marks and gridlines in the selected axis. For example, if the selected axis ranges from 0 -100 and you want to show labels, tick marks or gridlines every 10 units, then the appropriate setting for the
setStepmethod is 10.This method can also be used for a categorical axis. For example, if your X axis displays labels ranging from January to December and you set the
setStepmethod to 2, then the categorical axis will display legends every other month.You can also control a minor interval with the
setMinorStepDateTimemethod.If no Step value is specified, Chart FX will automatically set a Step according to the data provided, you can use this method to read or write this default value.
Changing the data contained in a chart will not automatically change the Step value. If you want Chart FX to calculate an appropriate Step value automatically set the Step value to 0 (Automatic) or invoke the
recalculateScalemethod.The value of the
setStepmethod must be greater than the value of thesetMinorStepDateTimemethod.When using the
setFirstLabelmethod in the X Axis of a chart with values ranging from 0 to 1, the axissetMinorStepDateTimeis used to calculate which label is the first, second, third, etc. When X Axis values range bigger than 1, then the axis Step is used for this calcuation.To set the major interval of the primary Y axis to 25:
PopulateMiamiClimate(chart1);
chart1.getAxisY().setStep(25);
public static void PopulateMiamiClimate(Chart chart1, String fieldNames) {
    MiamiClimate[] data = new MiamiClimate[] {
        new MiamiClimate("Jan", 59.6, 76.5, 67.2, 1.88, 9.5, 59 ),
        new MiamiClimate("Feb", 60.5, 77.7, 68.5, 2.07, 10.1, 71 ),
        new MiamiClimate("Mar", 64, 80.7, 71.7, 2.56, 10.5, 69.5 ),
        new MiamiClimate("Apr", 67.6, 83.8, 75.2, 3.36, 10.5, 67.5 ),
        new MiamiClimate("May", 72, 87.2, 78.7, 5.52, 9.5, 67 ),
        new MiamiClimate("Jun", 75.2, 89.5, 81.4, 8.54, 8.3, 71 ),
        new MiamiClimate("Jul", 76.5, 90.9, 82.6, 5.79, 7.9, 74 ),
        new MiamiClimate("Aug", 76.5, 90.6, 82.8, 8.63, 7.9, 74 ),
        new MiamiClimate("Sep", 75.7, 89, 81.9, 8.38, 8.2, 76 ),
        new MiamiClimate("Oct", 72.2, 85.4, 78.3, 6.19, 9.2, 76 ),
        new MiamiClimate("Nov", 67.5, 81.2, 73.6, 3.43, 9.7, 74 ),
        new MiamiClimate("Dec", 62.2, 77.5, 69.1, 2.18, 9.2, 73 )
};
    ObjectProvider objProvider = new ObjectProvider(data);
    chart1.getDataSourceSettings().setDataSource(objProvider);


        if (fieldNames != ""){
                List<DataField> removeFields = new ArrayList<DataField>();
                List<String> includeFields = Arrays.asList(fieldNames.split(","));
                chart1.getDataSourceSettings().fillFromSchema();

                for (DataField dataField : chart1.getDataSourceSettings().getDataFields()) {
                        if (dataField.isMeasure() && !includeFields.contains(dataField.getDataPath())) {
                                removeFields.add(dataField);
                        }

                }

                for (DataField dataField : removeFields) {
                        chart1.getDataSourceSettings().getDataFields().remove(dataField);
                }
        }
}
public static void PopulateMiamiClimate(Chart chart1) {
        PopulateMiamiClimate(chart1, "");
}
public static class MiamiClimate { public MiamiClimate(String Month, double low, double high, double average, double precipitation, double windSpeed, double relativeHumidity) { this.setMonth(Month); this.setLow(low); this.setHigh(high); this.setAverage(average); this.setPrecipitation(precipitation); this.setWindSpeed(windSpeed); this.setRelativeHumidity(relativeHumidity); } private String privateMonth; public final String getMonth() { return privateMonth; } public final void setMonth(String value) { privateMonth = value; } private double privateLow; public final double getLow() { return privateLow; } public final void setLow(double value) { privateLow = value; } private double privateHigh; public final double getHigh() { return privateHigh; } public final void setHigh(double value) { privateHigh = value; } private double privateAverage; public final double getAverage() { return privateAverage; } public final void setAverage(double value) { privateAverage = value; } private double privatePrecipitation; public final double getPrecipitation() { return privatePrecipitation; } public final void setPrecipitation(double value) { privatePrecipitation = value; } private double privateWindSpeed; public final double getWindSpeed() { return privateWindSpeed; } public final void setWindSpeed(double value) { privateWindSpeed = value; } private double privateRelativeHumidity; public final double getRelativeHumidity() { return privateRelativeHumidity; } public final void setRelativeHumidity(double value) { privateRelativeHumidity = value; } }
-
setStep
public void setStep(double value)
Specifies the interval of major tick marks and gridlines on the selected axis. It also controls the gap or interval between labels in the selected axis.
Normally, you use this method to control the interval of labels, tick marks and gridlines in the selected axis. For example, if the selected axis ranges from 0 -100 and you want to show labels, tick marks or gridlines every 10 units, then the appropriate setting for the
setStepmethod is 10.This method can also be used for a categorical axis. For example, if your X axis displays labels ranging from January to December and you set the
setStepmethod to 2, then the categorical axis will display legends every other month.You can also control a minor interval with the
setMinorStepDateTimemethod.If no Step value is specified, Chart FX will automatically set a Step according to the data provided, you can use this method to read or write this default value.
Changing the data contained in a chart will not automatically change the Step value. If you want Chart FX to calculate an appropriate Step value automatically set the Step value to 0 (Automatic) or invoke the
recalculateScalemethod.The value of the
setStepmethod must be greater than the value of thesetMinorStepDateTimemethod.When using the
setFirstLabelmethod in the X Axis of a chart with values ranging from 0 to 1, the axissetMinorStepDateTimeis used to calculate which label is the first, second, third, etc. When X Axis values range bigger than 1, then the axis Step is used for this calcuation.To set the major interval of the primary Y axis to 25:
PopulateMiamiClimate(chart1);
chart1.getAxisY().setStep(25);
public static void PopulateMiamiClimate(Chart chart1, String fieldNames) {
    MiamiClimate[] data = new MiamiClimate[] {
        new MiamiClimate("Jan", 59.6, 76.5, 67.2, 1.88, 9.5, 59 ),
        new MiamiClimate("Feb", 60.5, 77.7, 68.5, 2.07, 10.1, 71 ),
        new MiamiClimate("Mar", 64, 80.7, 71.7, 2.56, 10.5, 69.5 ),
        new MiamiClimate("Apr", 67.6, 83.8, 75.2, 3.36, 10.5, 67.5 ),
        new MiamiClimate("May", 72, 87.2, 78.7, 5.52, 9.5, 67 ),
        new MiamiClimate("Jun", 75.2, 89.5, 81.4, 8.54, 8.3, 71 ),
        new MiamiClimate("Jul", 76.5, 90.9, 82.6, 5.79, 7.9, 74 ),
        new MiamiClimate("Aug", 76.5, 90.6, 82.8, 8.63, 7.9, 74 ),
        new MiamiClimate("Sep", 75.7, 89, 81.9, 8.38, 8.2, 76 ),
        new MiamiClimate("Oct", 72.2, 85.4, 78.3, 6.19, 9.2, 76 ),
        new MiamiClimate("Nov", 67.5, 81.2, 73.6, 3.43, 9.7, 74 ),
        new MiamiClimate("Dec", 62.2, 77.5, 69.1, 2.18, 9.2, 73 )
};
    ObjectProvider objProvider = new ObjectProvider(data);
    chart1.getDataSourceSettings().setDataSource(objProvider);


        if (fieldNames != ""){
                List<DataField> removeFields = new ArrayList<DataField>();
                List<String> includeFields = Arrays.asList(fieldNames.split(","));
                chart1.getDataSourceSettings().fillFromSchema();

                for (DataField dataField : chart1.getDataSourceSettings().getDataFields()) {
                        if (dataField.isMeasure() && !includeFields.contains(dataField.getDataPath())) {
                                removeFields.add(dataField);
                        }

                }

                for (DataField dataField : removeFields) {
                        chart1.getDataSourceSettings().getDataFields().remove(dataField);
                }
        }
}
public static void PopulateMiamiClimate(Chart chart1) {
        PopulateMiamiClimate(chart1, "");
}
public static class MiamiClimate { public MiamiClimate(String Month, double low, double high, double average, double precipitation, double windSpeed, double relativeHumidity) { this.setMonth(Month); this.setLow(low); this.setHigh(high); this.setAverage(average); this.setPrecipitation(precipitation); this.setWindSpeed(windSpeed); this.setRelativeHumidity(relativeHumidity); } private String privateMonth; public final String getMonth() { return privateMonth; } public final void setMonth(String value) { privateMonth = value; } private double privateLow; public final double getLow() { return privateLow; } public final void setLow(double value) { privateLow = value; } private double privateHigh; public final double getHigh() { return privateHigh; } public final void setHigh(double value) { privateHigh = value; } private double privateAverage; public final double getAverage() { return privateAverage; } public final void setAverage(double value) { privateAverage = value; } private double privatePrecipitation; public final double getPrecipitation() { return privatePrecipitation; } public final void setPrecipitation(double value) { privatePrecipitation = value; } private double privateWindSpeed; public final double getWindSpeed() { return privateWindSpeed; } public final void setWindSpeed(double value) { privateWindSpeed = value; } private double privateRelativeHumidity; public final double getRelativeHumidity() { return privateRelativeHumidity; } public final void setRelativeHumidity(double value) { privateRelativeHumidity = value; } }
- Parameters:
value-
-
getStepDateTime
public java.util.Date getStepDateTime()
Specifies the interval of major tick marks and gridlines on the selected axis. It also controls the gap or interval between labels in the selected axis.
Normally, you use this method to control the interval of labels, tick marks and gridlines in the selected axis. For example, if the selected axis ranges from 0 -100 and you want to show labels, tick marks or gridlines every 10 units, then the appropriate setting for the
setStepmethod is 10.This method can also be used for a categorical axis. For example, if your X axis displays labels ranging from January to December and you set the
setStepmethod to 2, then the categorical axis will display legends every other month.You can also control a minor interval with the
setMinorStepDateTimemethod.If no Step value is specified, Chart FX will automatically set a Step according to the data provided, you can use this method to read or write this default value.
Changing the data contained in a chart will not automatically change the Step value. If you want Chart FX to calculate an appropriate Step value automatically set the Step value to 0 (Automatic) or invoke the
recalculateScalemethod.The value of the
setStepmethod must be greater than the value of thesetMinorStepDateTimemethod.When using the
setFirstLabelmethod in the X Axis of a chart with values ranging from 0 to 1, the axissetMinorStepDateTimeis used to calculate which label is the first, second, third, etc. When X Axis values range bigger than 1, then the axis Step is used for this calcuation.To set the major interval of the primary Y axis to 25:
PopulateMiamiClimate(chart1);
chart1.getAxisY().setStep(25);
public static void PopulateMiamiClimate(Chart chart1, String fieldNames) {
    MiamiClimate[] data = new MiamiClimate[] {
        new MiamiClimate("Jan", 59.6, 76.5, 67.2, 1.88, 9.5, 59 ),
        new MiamiClimate("Feb", 60.5, 77.7, 68.5, 2.07, 10.1, 71 ),
        new MiamiClimate("Mar", 64, 80.7, 71.7, 2.56, 10.5, 69.5 ),
        new MiamiClimate("Apr", 67.6, 83.8, 75.2, 3.36, 10.5, 67.5 ),
        new MiamiClimate("May", 72, 87.2, 78.7, 5.52, 9.5, 67 ),
        new MiamiClimate("Jun", 75.2, 89.5, 81.4, 8.54, 8.3, 71 ),
        new MiamiClimate("Jul", 76.5, 90.9, 82.6, 5.79, 7.9, 74 ),
        new MiamiClimate("Aug", 76.5, 90.6, 82.8, 8.63, 7.9, 74 ),
        new MiamiClimate("Sep", 75.7, 89, 81.9, 8.38, 8.2, 76 ),
        new MiamiClimate("Oct", 72.2, 85.4, 78.3, 6.19, 9.2, 76 ),
        new MiamiClimate("Nov", 67.5, 81.2, 73.6, 3.43, 9.7, 74 ),
        new MiamiClimate("Dec", 62.2, 77.5, 69.1, 2.18, 9.2, 73 )
};
    ObjectProvider objProvider = new ObjectProvider(data);
    chart1.getDataSourceSettings().setDataSource(objProvider);


        if (fieldNames != ""){
                List<DataField> removeFields = new ArrayList<DataField>();
                List<String> includeFields = Arrays.asList(fieldNames.split(","));
                chart1.getDataSourceSettings().fillFromSchema();

                for (DataField dataField : chart1.getDataSourceSettings().getDataFields()) {
                        if (dataField.isMeasure() && !includeFields.contains(dataField.getDataPath())) {
                                removeFields.add(dataField);
                        }

                }

                for (DataField dataField : removeFields) {
                        chart1.getDataSourceSettings().getDataFields().remove(dataField);
                }
        }
}
public static void PopulateMiamiClimate(Chart chart1) {
        PopulateMiamiClimate(chart1, "");
}
public static class MiamiClimate { public MiamiClimate(String Month, double low, double high, double average, double precipitation, double windSpeed, double relativeHumidity) { this.setMonth(Month); this.setLow(low); this.setHigh(high); this.setAverage(average); this.setPrecipitation(precipitation); this.setWindSpeed(windSpeed); this.setRelativeHumidity(relativeHumidity); } private String privateMonth; public final String getMonth() { return privateMonth; } public final void setMonth(String value) { privateMonth = value; } private double privateLow; public final double getLow() { return privateLow; } public final void setLow(double value) { privateLow = value; } private double privateHigh; public final double getHigh() { return privateHigh; } public final void setHigh(double value) { privateHigh = value; } private double privateAverage; public final double getAverage() { return privateAverage; } public final void setAverage(double value) { privateAverage = value; } private double privatePrecipitation; public final double getPrecipitation() { return privatePrecipitation; } public final void setPrecipitation(double value) { privatePrecipitation = value; } private double privateWindSpeed; public final double getWindSpeed() { return privateWindSpeed; } public final void setWindSpeed(double value) { privateWindSpeed = value; } private double privateRelativeHumidity; public final double getRelativeHumidity() { return privateRelativeHumidity; } public final void setRelativeHumidity(double value) { privateRelativeHumidity = value; } }
-
setStep
public void setStep(java.util.Date value)
Specifies the interval of major tick marks and gridlines on the selected axis. It also controls the gap or interval between labels in the selected axis.
Normally, you use this method to control the interval of labels, tick marks and gridlines in the selected axis. For example, if the selected axis ranges from 0 -100 and you want to show labels, tick marks or gridlines every 10 units, then the appropriate setting for the
setStepmethod is 10.This method can also be used for a categorical axis. For example, if your X axis displays labels ranging from January to December and you set the
setStepmethod to 2, then the categorical axis will display legends every other month.You can also control a minor interval with the
setMinorStepDateTimemethod.If no Step value is specified, Chart FX will automatically set a Step according to the data provided, you can use this method to read or write this default value.
Changing the data contained in a chart will not automatically change the Step value. If you want Chart FX to calculate an appropriate Step value automatically set the Step value to 0 (Automatic) or invoke the
recalculateScalemethod.The value of the
setStepmethod must be greater than the value of thesetMinorStepDateTimemethod.When using the
setFirstLabelmethod in the X Axis of a chart with values ranging from 0 to 1, the axissetMinorStepDateTimeis used to calculate which label is the first, second, third, etc. When X Axis values range bigger than 1, then the axis Step is used for this calcuation.To set the major interval of the primary Y axis to 25:
PopulateMiamiClimate(chart1);
chart1.getAxisY().setStep(25);
public static void PopulateMiamiClimate(Chart chart1, String fieldNames) {
    MiamiClimate[] data = new MiamiClimate[] {
        new MiamiClimate("Jan", 59.6, 76.5, 67.2, 1.88, 9.5, 59 ),
        new MiamiClimate("Feb", 60.5, 77.7, 68.5, 2.07, 10.1, 71 ),
        new MiamiClimate("Mar", 64, 80.7, 71.7, 2.56, 10.5, 69.5 ),
        new MiamiClimate("Apr", 67.6, 83.8, 75.2, 3.36, 10.5, 67.5 ),
        new MiamiClimate("May", 72, 87.2, 78.7, 5.52, 9.5, 67 ),
        new MiamiClimate("Jun", 75.2, 89.5, 81.4, 8.54, 8.3, 71 ),
        new MiamiClimate("Jul", 76.5, 90.9, 82.6, 5.79, 7.9, 74 ),
        new MiamiClimate("Aug", 76.5, 90.6, 82.8, 8.63, 7.9, 74 ),
        new MiamiClimate("Sep", 75.7, 89, 81.9, 8.38, 8.2, 76 ),
        new MiamiClimate("Oct", 72.2, 85.4, 78.3, 6.19, 9.2, 76 ),
        new MiamiClimate("Nov", 67.5, 81.2, 73.6, 3.43, 9.7, 74 ),
        new MiamiClimate("Dec", 62.2, 77.5, 69.1, 2.18, 9.2, 73 )
};
    ObjectProvider objProvider = new ObjectProvider(data);
    chart1.getDataSourceSettings().setDataSource(objProvider);


        if (fieldNames != ""){
                List<DataField> removeFields = new ArrayList<DataField>();
                List<String> includeFields = Arrays.asList(fieldNames.split(","));
                chart1.getDataSourceSettings().fillFromSchema();

                for (DataField dataField : chart1.getDataSourceSettings().getDataFields()) {
                        if (dataField.isMeasure() && !includeFields.contains(dataField.getDataPath())) {
                                removeFields.add(dataField);
                        }

                }

                for (DataField dataField : removeFields) {
                        chart1.getDataSourceSettings().getDataFields().remove(dataField);
                }
        }
}
public static void PopulateMiamiClimate(Chart chart1) {
        PopulateMiamiClimate(chart1, "");
}
public static class MiamiClimate { public MiamiClimate(String Month, double low, double high, double average, double precipitation, double windSpeed, double relativeHumidity) { this.setMonth(Month); this.setLow(low); this.setHigh(high); this.setAverage(average); this.setPrecipitation(precipitation); this.setWindSpeed(windSpeed); this.setRelativeHumidity(relativeHumidity); } private String privateMonth; public final String getMonth() { return privateMonth; } public final void setMonth(String value) { privateMonth = value; } private double privateLow; public final double getLow() { return privateLow; } public final void setLow(double value) { privateLow = value; } private double privateHigh; public final double getHigh() { return privateHigh; } public final void setHigh(double value) { privateHigh = value; } private double privateAverage; public final double getAverage() { return privateAverage; } public final void setAverage(double value) { privateAverage = value; } private double privatePrecipitation; public final double getPrecipitation() { return privatePrecipitation; } public final void setPrecipitation(double value) { privatePrecipitation = value; } private double privateWindSpeed; public final double getWindSpeed() { return privateWindSpeed; } public final void setWindSpeed(double value) { privateWindSpeed = value; } private double privateRelativeHumidity; public final double getRelativeHumidity() { return privateRelativeHumidity; } public final void setRelativeHumidity(double value) { privateRelativeHumidity = value; } }
- Parameters:
value-
-
getStyle
public java.util.EnumSet<AxisStyles> getStyle()
Allows you to add additional styles to the selected axis.
This method is a mask method. This means all settings represent a bit in the word that you need to turn on or off according to what you want. For this purpose you will need to use the bitwise operators (And, Or, Not, Xor).
Because it is a mask method, you must make sure you use these operators to turn on/off bits and avoid losing previous settings to the method.
For example, if you want to turn ON the AutoScale setting the right way of setting this method is:
java.util.EnumSet<AxisStyles> style = chart1.getAxisY().getStyle();

style.add(AxisStyles.AUTO_SCALE);

chart1.getAxisY().setStyle(style);
If you type the following code:
chart1.getAxisY().setStyle(AxisStyles.AUTO_SCALE);
You will erase all other settings in the method causing an erratic behavior of the library and an incorrect setting of the individual methods which also control these flags.
The
setStylemethod supports a flag called AutoFirstLabel (Default=ON) which automatically positions the first label to the closest number rounded to the axis step. For example, if a numeric axis starts at 7 with a Step of 10 and the AutoFirstLabel method is ON, the axis will show labels at 10,20,30 and so on. If the AutoFirstLabel method is turned off labels will be shown at 7,17,27 and so on.Note: If the axis contains dates (Date Axis) the AutoFirstLabel method will position the first label at the end of the month. If the AutoFirstLabel is turned OFF, the labels will be shown using the first available date and advanced using thesetStepmethod setting.To set Auto Scale and Hide Labels in the primary Y Axis:
java.util.EnumSet<AxisStyles> style = chart1.getAxisY().getStyle();

style.add(AxisStyles.HIDE_TEXT);

chart1.getAxisY().setStyle(style);
To delete the X axis line when the Y values has negative and positive values do this:
chart1.getAxisY().setStyle(((chart1.getAxisY().getStyle()) & (-(AxisStyles.BREAK_ZERO))));
- See Also:
resetStyle
-
setStyle
public void setStyle(java.util.EnumSet<AxisStyles> value)
Allows you to add additional styles to the selected axis.
This method is a mask method. This means all settings represent a bit in the word that you need to turn on or off according to what you want. For this purpose you will need to use the bitwise operators (And, Or, Not, Xor).
Because it is a mask method, you must make sure you use these operators to turn on/off bits and avoid losing previous settings to the method.
For example, if you want to turn ON the AutoScale setting the right way of setting this method is:
java.util.EnumSet<AxisStyles> style = chart1.getAxisY().getStyle();

style.add(AxisStyles.AUTO_SCALE);

chart1.getAxisY().setStyle(style);
If you type the following code:
chart1.getAxisY().setStyle(AxisStyles.AUTO_SCALE);
You will erase all other settings in the method causing an erratic behavior of the library and an incorrect setting of the individual methods which also control these flags.
The
setStylemethod supports a flag called AutoFirstLabel (Default=ON) which automatically positions the first label to the closest number rounded to the axis step. For example, if a numeric axis starts at 7 with a Step of 10 and the AutoFirstLabel method is ON, the axis will show labels at 10,20,30 and so on. If the AutoFirstLabel method is turned off labels will be shown at 7,17,27 and so on.Note: If the axis contains dates (Date Axis) the AutoFirstLabel method will position the first label at the end of the month. If the AutoFirstLabel is turned OFF, the labels will be shown using the first available date and advanced using thesetStepmethod setting.To set Auto Scale and Hide Labels in the primary Y Axis:
java.util.EnumSet<AxisStyles> style = chart1.getAxisY().getStyle();

style.add(AxisStyles.HIDE_TEXT);

chart1.getAxisY().setStyle(style);
To delete the X axis line when the Y values has negative and positive values do this:
chart1.getAxisY().setStyle(((chart1.getAxisY().getStyle()) & (-(AxisStyles.BREAK_ZERO))));
- Parameters:
value-- See Also:
resetStyle
-
getTitle
public Title getTitle()
Gets or sets the title for a specific axis.
The
setTitlemethod is a member of the axis object; therefore, the axis object must be referenced in order to properly utilize thesetTitlemethod.This method receives or returns a
Titleclass. By accessing the title object methods, you can change attributes like: Alignment, Color, Font, and Text.This method is used to get or set the axis title. To set the chart top title, please refer to the chart
setTitlesmethod.You can create a MultiLine title by including the chr(10) character.
This sample sets the "Unit Sales (In Thousands)" to the Y Axis:
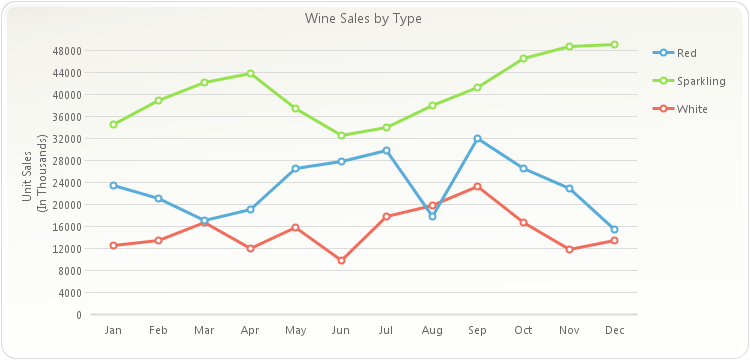
PopulateProductSales(chart1);
chart1.getTitles().add(new TitleDockable("Wine Sales by Type"));
chart1.getAxisY().getTitle().setText("Unit Sales \n (In Thousands)");
public static void PopulateProductSales(Chart chart1) { ProductSales[] data = new ProductSales[]{ new ProductSales("Jan", 12560, 23400, 34500), new ProductSales("Feb", 13400, 21000, 38900), new ProductSales("Mar", 16700, 17000, 42100), new ProductSales("Apr", 12000, 19020, 43800), new ProductSales("May", 15800, 26500, 37540), new ProductSales("Jun", 9800, 27800, 32580), new ProductSales("Jul", 17800, 29820, 34000), new ProductSales("Aug", 19800, 17800, 38000), new ProductSales("Sep", 23200, 32000, 41300), new ProductSales("Oct", 16700, 26500, 46590), new ProductSales("Nov", 11800, 23000, 48700), new ProductSales("Dec", 13400, 15400, 49100) }; ObjectProvider objProvider = new ObjectProvider(data); chart1.getDataSourceSettings().setDataSource(objProvider); }public static class ProductSales { public ProductSales(String month, double white, double red, double sparkling) { this.setMonth(month); this.setWhite(white); this.setRed(red); this.setSparkling(sparkling); } private String privateMonth; public final String getMonth() { return privateMonth; } public final void setMonth(String value) { privateMonth = value; } private double privateWhite; public final double getWhite() { return privateWhite; } public final void setWhite(double value) { privateWhite = value; } private double privateRed; public final double getRed() { return privateRed; } public final void setRed(double value) { privateRed = value; } private double privateSparkling; public final double getSparkling() { return privateSparkling; } public final void setSparkling(double value) { privateSparkling = value; } }
-
setTitle
public void setTitle(Title value)
Gets or sets the title for a specific axis.
The
setTitlemethod is a member of the axis object; therefore, the axis object must be referenced in order to properly utilize thesetTitlemethod.This method receives or returns a
Titleclass. By accessing the title object methods, you can change attributes like: Alignment, Color, Font, and Text.This method is used to get or set the axis title. To set the chart top title, please refer to the chart
setTitlesmethod.You can create a MultiLine title by including the chr(10) character.
This sample sets the "Unit Sales (In Thousands)" to the Y Axis:
PopulateProductSales(chart1);
chart1.getTitles().add(new TitleDockable("Wine Sales by Type"));
chart1.getAxisY().getTitle().setText("Unit Sales \n (In Thousands)");
public static void PopulateProductSales(Chart chart1) { ProductSales[] data = new ProductSales[]{ new ProductSales("Jan", 12560, 23400, 34500), new ProductSales("Feb", 13400, 21000, 38900), new ProductSales("Mar", 16700, 17000, 42100), new ProductSales("Apr", 12000, 19020, 43800), new ProductSales("May", 15800, 26500, 37540), new ProductSales("Jun", 9800, 27800, 32580), new ProductSales("Jul", 17800, 29820, 34000), new ProductSales("Aug", 19800, 17800, 38000), new ProductSales("Sep", 23200, 32000, 41300), new ProductSales("Oct", 16700, 26500, 46590), new ProductSales("Nov", 11800, 23000, 48700), new ProductSales("Dec", 13400, 15400, 49100) }; ObjectProvider objProvider = new ObjectProvider(data); chart1.getDataSourceSettings().setDataSource(objProvider); }public static class ProductSales { public ProductSales(String month, double white, double red, double sparkling) { this.setMonth(month); this.setWhite(white); this.setRed(red); this.setSparkling(sparkling); } private String privateMonth; public final String getMonth() { return privateMonth; } public final void setMonth(String value) { privateMonth = value; } private double privateWhite; public final double getWhite() { return privateWhite; } public final void setWhite(double value) { privateWhite = value; } private double privateRed; public final double getRed() { return privateRed; } public final void setRed(double value) { privateRed = value; } private double privateSparkling; public final double getSparkling() { return privateSparkling; } public final void setSparkling(double value) { privateSparkling = value; } }
- Parameters:
value-
-
isVisible
public boolean isVisible()
Shows or hides the lines, labels, tick marks and grids for the selected axis.
The
isVisiblemethod is a member of the axis object; therefore, the axis object must be referenced in order to properly utilize theisVisiblemethod.By hiding the labels for the specified axis using the
isVisiblemethod, other attributes such as thesetGridsand tick marks are also hidden.The X axis has been hidden in the chart below:
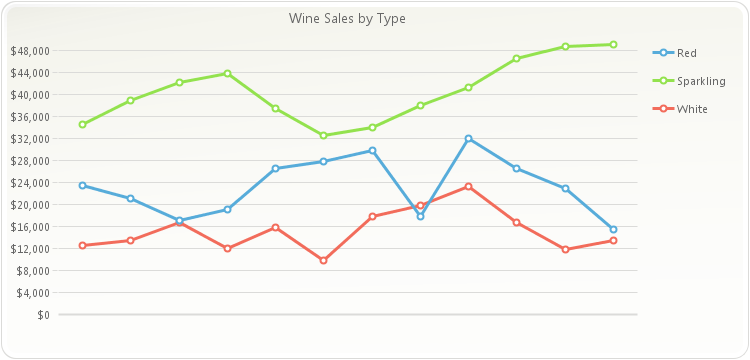
PopulateProductSales(chart1);
chart1.getTitles().add(new TitleDockable("Wine Sales by Type"));
chart1.getAxisY().getLabelsFormat().setFormat(AxisFormat.CURRENCY);
chart1.getAxisX().setVisible(false);
public static void PopulateProductSales(Chart chart1) { ProductSales[] data = new ProductSales[]{ new ProductSales("Jan", 12560, 23400, 34500), new ProductSales("Feb", 13400, 21000, 38900), new ProductSales("Mar", 16700, 17000, 42100), new ProductSales("Apr", 12000, 19020, 43800), new ProductSales("May", 15800, 26500, 37540), new ProductSales("Jun", 9800, 27800, 32580), new ProductSales("Jul", 17800, 29820, 34000), new ProductSales("Aug", 19800, 17800, 38000), new ProductSales("Sep", 23200, 32000, 41300), new ProductSales("Oct", 16700, 26500, 46590), new ProductSales("Nov", 11800, 23000, 48700), new ProductSales("Dec", 13400, 15400, 49100) }; ObjectProvider objProvider = new ObjectProvider(data); chart1.getDataSourceSettings().setDataSource(objProvider); }public static class ProductSales { public ProductSales(String month, double white, double red, double sparkling) { this.setMonth(month); this.setWhite(white); this.setRed(red); this.setSparkling(sparkling); } private String privateMonth; public final String getMonth() { return privateMonth; } public final void setMonth(String value) { privateMonth = value; } private double privateWhite; public final double getWhite() { return privateWhite; } public final void setWhite(double value) { privateWhite = value; } private double privateRed; public final double getRed() { return privateRed; } public final void setRed(double value) { privateRed = value; } private double privateSparkling; public final double getSparkling() { return privateSparkling; } public final void setSparkling(double value) { privateSparkling = value; } }
- See Also:
resetVisible
-
setVisible
public void setVisible(boolean value)
Shows or hides the lines, labels, tick marks and grids for the selected axis.
The
isVisiblemethod is a member of the axis object; therefore, the axis object must be referenced in order to properly utilize theisVisiblemethod.By hiding the labels for the specified axis using the
isVisiblemethod, other attributes such as thesetGridsand tick marks are also hidden.The X axis has been hidden in the chart below:
PopulateProductSales(chart1);
chart1.getTitles().add(new TitleDockable("Wine Sales by Type"));
chart1.getAxisY().getLabelsFormat().setFormat(AxisFormat.CURRENCY);
chart1.getAxisX().setVisible(false);
public static void PopulateProductSales(Chart chart1) { ProductSales[] data = new ProductSales[]{ new ProductSales("Jan", 12560, 23400, 34500), new ProductSales("Feb", 13400, 21000, 38900), new ProductSales("Mar", 16700, 17000, 42100), new ProductSales("Apr", 12000, 19020, 43800), new ProductSales("May", 15800, 26500, 37540), new ProductSales("Jun", 9800, 27800, 32580), new ProductSales("Jul", 17800, 29820, 34000), new ProductSales("Aug", 19800, 17800, 38000), new ProductSales("Sep", 23200, 32000, 41300), new ProductSales("Oct", 16700, 26500, 46590), new ProductSales("Nov", 11800, 23000, 48700), new ProductSales("Dec", 13400, 15400, 49100) }; ObjectProvider objProvider = new ObjectProvider(data); chart1.getDataSourceSettings().setDataSource(objProvider); }public static class ProductSales { public ProductSales(String month, double white, double red, double sparkling) { this.setMonth(month); this.setWhite(white); this.setRed(red); this.setSparkling(sparkling); } private String privateMonth; public final String getMonth() { return privateMonth; } public final void setMonth(String value) { privateMonth = value; } private double privateWhite; public final double getWhite() { return privateWhite; } public final void setWhite(double value) { privateWhite = value; } private double privateRed; public final double getRed() { return privateRed; } public final void setRed(double value) { privateRed = value; } private double privateSparkling; public final double getSparkling() { return privateSparkling; } public final void setSparkling(double value) { privateSparkling = value; } }
- Parameters:
value-- See Also:
resetVisible
-
adjustScale
public void adjustScale()
Adjusts the selected axis to "nice" scale values.
This method is ONLY useful if the
isAutoScalemethod is disabled, as Chart FX will recalculate scale values and adjust the axis accordingly. But if you disable the AutoScale feature to set your own Min and Max (and Step when applicable) you can use this method to round them to "nice" values."Nice" values are calculated according to the values associated with the axis in powers of 10, For example:
If your y axis ranges from 0-18, the
adjustScalemethod can round the Max value to 20.If your y axis ranges from 0-0.56, the
adjustScalemethod can round the Max Value to 0.6.If your y axis ranges from 0-234, the
adjustScalemethod can round the Max Value to 300.This method will not affect the
setStepandsetMinorStepDateTimemethods if they have been previously set. To make sure they respond to this method, make sure the Step and MinorStep methods are set to zero (0).A typical case of when to use this method is when you disable the
isAutoScalemethod to calculate your Min and Max and any of them are not a "nice" number because they are being calculated according to the data being sent to the chart. At this time, you can invoke theadjustScalemethod so they are rounded to "nice" numbers.To adjust the scale on the Y axis:
chart1.getAxisY().adjustScale();
-
getScrollView
public void getScrollView(Axis.GetScrollViewArgs _p_)
Used to retrieve values set by the SetScrollView method.
- Parameters:
_p_-
-
pixelToValue
public DataUnit pixelToValue(int pixel)
Converts a position in pixels in the chart area to its representation on the respective axis.
The origin or (0,0) coordinate in pixels, is always positioned in the top/left corner of the chart, without including the toolbar or other tools that may be showing in the chart area.
This method is useful when customizing the chart painting or positioning annotation objects in the chart area. For example, you may want to convert a particular position in pixels to axis coordinates.
All the mouse events return an object that holds the X and Y pixel values where the mouse event was fired in the chart area. By converting the pixels you can determine the point value where the mouse event occured.
To find the X Axis point value equivalent to the X pixel value 100:
double Xval;
Xval = chart1.getAxisX().pixelToValue(100);
To find the Y Axis point value equivalent to the Y pixel value 100:
double yVal;
yVal = chart1.getAxisY().pixelToValue(100);
- Parameters:
pixel- An integer specifying the pixel value to be converted.
-
resetBaseline
public void resetBaseline()
Set the property Baseline to its default value.- See Also:
setBaseline
-
resetFont
public void resetFont()
Set the property Font to its default value.- See Also:
setFont
-
resetForceBaseline
public void resetForceBaseline()
Set the property ForceBaseline to its default value.
-
resetInverted
public void resetInverted()
Set the property Inverted to its default value.- See Also:
isInverted
-
resetLabelAngle
public void resetLabelAngle()
Set the property LabelAngle to its default value.- See Also:
setLabelAngle
-
resetLabelTrimming
public void resetLabelTrimming()
Set the property LabelTrimming to its default value.- See Also:
setLabelTrimming
-
resetLineSpacing
public void resetLineSpacing()
Set the property LineSpacing to its default value.- See Also:
setLineSpacing
-
resetMarginFromMax
public void resetMarginFromMax()
Set the property MarginFromMax to its default value.- See Also:
setMarginFromMax
-
resetMarginFromMin
public void resetMarginFromMin()
Set the property MarginFromMin to its default value.- See Also:
setMarginFromMin
-
resetMax
public void resetMax()
Resets the value of the selected Axis.
To reset the max values of the Y axis:
chart1.getAxisY().resetMax();
-
resetMaxSizePercentage
public void resetMaxSizePercentage()
Set the property MaxSizePercentage to its default value.- See Also:
setMaxSizePercentage
-
resetMin
public void resetMin()
Resets the value of the selected Axis.
To reset the min values of the Y axis:
chart1.getAxisY().resetMin();
-
resetNotify
public void resetNotify()
Set the property Notify to its default value.- See Also:
isNotify
-
resetPixelsPerUnit
public void resetPixelsPerUnit()
Set the property PixelsPerUnit to its default value.- See Also:
setPixelsPerUnit
-
resetPosition
public void resetPosition()
Set the property Position to its default value.- See Also:
setPosition
-
resetScale
public void resetScale()
Prepares the selected axis to receive new data by resetting scale values.This method is to be called before new data is going to be sent to the chart.
This method resets all scale values for the selected axis. When new data is provided, Chart FX can recalculate values accordingly.
The affected scale values are:
setMinandsetMaxwhich are set to undefined so when new data arrives they can be calculated accordingly by Chart FX.setStepandsetMinorStepDateTimewhich are set to Automatic.
This method should be called before sending new data to the chart. Calling this method after setting the data to the chart will cause undesired results. Please refer to the
recalculateScalemethod to recalculate automatic values for existent data.To reset the scale for the Y Axis before new data is set to the chart:
chart1.getAxisY().resetScale();
-
resetScale
public void resetScale(boolean force)
Prepares the selected axis to receive new data by resetting scale values.This method is to be called before new data is going to be sent to the chart.
This method resets all scale values for the selected axis. When new data is provided, Chart FX can recalculate values accordingly.
The affected scale values are:
setMinandsetMaxwhich are set to undefined so when new data arrives they can be calculated accordingly by Chart FX.setStepandsetMinorStepDateTimewhich are set to Automatic.
This method should be called before sending new data to the chart. Calling this method after setting the data to the chart will cause undesired results. Please refer to the
recalculateScalemethod to recalculate automatic values for existent data.To reset the scale for the Y Axis before new data is set to the chart:
chart1.getAxisY().resetScale();
- Parameters:
force- If false, any scale values previously set by the user will be respected. If true, values will be reset.
-
resetScrollPositionPixel
public void resetScrollPositionPixel()
Set the property ScrollPositionPixel to its default value.- See Also:
setScrollPositionPixel
-
resetSeparation
public void resetSeparation()
Set the property Separation to its default value.- See Also:
setSeparation
-
resetStaggered
public void resetStaggered()
Set the property Staggered to its default value.- See Also:
isStaggered
-
resetStyle
public void resetStyle()
Set the property Style to its default value.- See Also:
setStyle
-
resetTotalSizeInPixels
public void resetTotalSizeInPixels()
Set the property TotalSizeInPixels to its default value.
-
resetVisible
public void resetVisible()
Set the property Visible to its default value.- See Also:
isVisible
-
resetZoomed
public void resetZoomed()
Set the property Zoomed to its default value.
-
setScrollView
public void setScrollView(TimeSpan min,
                 TimeSpan max)
Creates a scroll bar to view a portion of the selected axis.
Sometimes it is difficult to calculate the appropriate PixelsPerUnit value to create a view of an specific axis. This method allows you to set a min (starting point) and a max (ending point) that Chart FX will use to calculate the PixelsPerUnit and display the view.
When applied to a categorical axis (e.g. X Axis), the Min and Max are integer numbers that range from 1 to the number of points you have in the axis. If you want to create a view (scroll bar) with 10 points per view and start at point 20, the settings for the Min should be 20 and the Max setting should be 30.
When applied to a numerical axis (e.g. Y Axis), you should set the Min and Max according to the scale values of the axis. For example, if your axis ranges between 0 and 1 you may set a view with Min = 0.3 and Max = 0.6.
To destroy the view you can set the Min and Max to 0.
To see points from 5 to 10 in the X axis:
chart1.getAxisX().setScrollView(5, 10);
To see points from 0.3 to 0.6 (When the Y axis ranges from 0 to 1):
chart1.getAxisY().setScrollView(0.3, 0.6);
- Parameters:
min-max-
-
setScrollView
public void setScrollView(DataUnit min,
                 DataUnit max)
Creates a scroll bar to view a portion of the selected axis.
Sometimes it is difficult to calculate the appropriate PixelsPerUnit value to create a view of an specific axis. This method allows you to set a min (starting point) and a max (ending point) that Chart FX will use to calculate the PixelsPerUnit and display the view.
When applied to a categorical axis (e.g. X Axis), the Min and Max are integer numbers that range from 1 to the number of points you have in the axis. If you want to create a view (scroll bar) with 10 points per view and start at point 20, the settings for the Min should be 20 and the Max setting should be 30.
When applied to a numerical axis (e.g. Y Axis), you should set the Min and Max according to the scale values of the axis. For example, if your axis ranges between 0 and 1 you may set a view with Min = 0.3 and Max = 0.6.
To destroy the view you can set the Min and Max to 0.
To see points from 5 to 10 in the X axis:
chart1.getAxisX().setScrollView(5, 10);
To see points from 0.3 to 0.6 (When the Y axis ranges from 0 to 1):
chart1.getAxisY().setScrollView(0.3, 0.6);
- Parameters:
min-max-
-
setScrollView
public void setScrollView(double min,
                 double max)
Creates a scroll bar to view a portion of the selected axis.
Sometimes it is difficult to calculate the appropriate PixelsPerUnit value to create a view of an specific axis. This method allows you to set a min (starting point) and a max (ending point) that Chart FX will use to calculate the PixelsPerUnit and display the view.
When applied to a categorical axis (e.g. X Axis), the Min and Max are integer numbers that range from 1 to the number of points you have in the axis. If you want to create a view (scroll bar) with 10 points per view and start at point 20, the settings for the Min should be 20 and the Max setting should be 30.
When applied to a numerical axis (e.g. Y Axis), you should set the Min and Max according to the scale values of the axis. For example, if your axis ranges between 0 and 1 you may set a view with Min = 0.3 and Max = 0.6.
To destroy the view you can set the Min and Max to 0.
To see points from 5 to 10 in the X axis:
chart1.getAxisX().setScrollView(5, 10);
To see points from 0.3 to 0.6 (When the Y axis ranges from 0 to 1):
chart1.getAxisY().setScrollView(0.3, 0.6);
- Parameters:
min- Where the view (scroll bar) begins.max- Where the view (scroll bar) ends.
-
setScrollView
public void setScrollView(java.util.Date min,
                 java.util.Date max)
Creates a scroll bar to view a portion of the selected axis.
Sometimes it is difficult to calculate the appropriate PixelsPerUnit value to create a view of an specific axis. This method allows you to set a min (starting point) and a max (ending point) that Chart FX will use to calculate the PixelsPerUnit and display the view.
When applied to a categorical axis (e.g. X Axis), the Min and Max are integer numbers that range from 1 to the number of points you have in the axis. If you want to create a view (scroll bar) with 10 points per view and start at point 20, the settings for the Min should be 20 and the Max setting should be 30.
When applied to a numerical axis (e.g. Y Axis), you should set the Min and Max according to the scale values of the axis. For example, if your axis ranges between 0 and 1 you may set a view with Min = 0.3 and Max = 0.6.
To destroy the view you can set the Min and Max to 0.
To see points from 5 to 10 in the X axis:
chart1.getAxisX().setScrollView(5, 10);
To see points from 0.3 to 0.6 (When the Y axis ranges from 0 to 1):
chart1.getAxisY().setScrollView(0.3, 0.6);
- Parameters:
min-max-
-
valueToPixel
public int valueToPixel(TimeSpan value)
Converts a value to its position in pixels on a selected axis.
This method is useful when customizing the chart painting or positioning annotation objects in the chart area. You may want to convert a particular position in the chart area given in axis units to screen coordinates (pixels).
int xPix;
xPix = chart1.getAxisX().valueToPixel(7);
To find the Y Axis pixel value equivalent to the Y Axis point value 40:
int yPix;
yPix = chart1.getAxisY().valueToPixel(40);
- Parameters:
value-
-
valueToPixel
public int valueToPixel(DataUnit value)
Converts a value to its position in pixels on a selected axis.
This method is useful when customizing the chart painting or positioning annotation objects in the chart area. You may want to convert a particular position in the chart area given in axis units to screen coordinates (pixels).
int xPix;
xPix = chart1.getAxisX().valueToPixel(7);
To find the Y Axis pixel value equivalent to the Y Axis point value 40:
int yPix;
yPix = chart1.getAxisY().valueToPixel(40);
- Parameters:
value-
-
valueToPixel
public int valueToPixel(double value)
Converts a value to its position in pixels on a selected axis.
This method is useful when customizing the chart painting or positioning annotation objects in the chart area. You may want to convert a particular position in the chart area given in axis units to screen coordinates (pixels).
int xPix;
xPix = chart1.getAxisX().valueToPixel(7);
To find the Y Axis pixel value equivalent to the Y Axis point value 40:
int yPix;
yPix = chart1.getAxisY().valueToPixel(40);
- Parameters:
value- A double specifying the point value to be converted.
-
valueToPixel
public int valueToPixel(java.util.Date value)
Converts a value to its position in pixels on a selected axis.
This method is useful when customizing the chart painting or positioning annotation objects in the chart area. You may want to convert a particular position in the chart area given in axis units to screen coordinates (pixels).
int xPix;
xPix = chart1.getAxisX().valueToPixel(7);
To find the Y Axis pixel value equivalent to the Y Axis point value 40:
int yPix;
yPix = chart1.getAxisY().valueToPixel(40);
- Parameters:
value-
-
zoom
public void zoom(TimeSpan min,
        TimeSpan max)
Allows you to specify a min and max zoom value for a selected axis.
You may turn the zoom off using the
zoomOffmethod of the Axis object.If the
isZoommethod of the Chart object is configured to false, all Axis specific zooms will be turned off.To set a zoom for the X Axis min 2, max 4:
chart1.getAxisX().zoom(2, 4);
- Parameters:
min-max-
-
zoom
public void zoom(DataUnit min,
        DataUnit max)
Allows you to specify a min and max zoom value for a selected axis.
You may turn the zoom off using the
zoomOffmethod of the Axis object.If the
isZoommethod of the Chart object is configured to false, all Axis specific zooms will be turned off.To set a zoom for the X Axis min 2, max 4:
chart1.getAxisX().zoom(2, 4);
- Parameters:
min- Ending point of the zoom range.max- Starting point of the zoom range.
-
zoom
public void zoom(double min,
        double max)
Allows you to specify a min and max zoom value for a selected axis.
You may turn the zoom off using the
zoomOffmethod of the Axis object.If the
isZoommethod of the Chart object is configured to false, all Axis specific zooms will be turned off.To set a zoom for the X Axis min 2, max 4:
chart1.getAxisX().zoom(2, 4);
- Parameters:
min-max-
-
zoom
public void zoom(java.util.Date min,
        java.util.Date max)
Allows you to specify a min and max zoom value for a selected axis.
You may turn the zoom off using the
zoomOffmethod of the Axis object.If the
isZoommethod of the Chart object is configured to false, all Axis specific zooms will be turned off.To set a zoom for the X Axis min 2, max 4:
chart1.getAxisX().zoom(2, 4);
- Parameters:
min-max-
-
zoomOff
public void zoomOff()
Allows you to ignore any zoom attributes set using the Zoom method and return to the default axis view.
Use the
zoommethod to set a zoom for a specified range on a selected axis.If the
isZoommethod of the Chart object is configured to false, all Axis specific zooms will be turned off.To return zoom to default view on the X axis:
chart1.getAxisX().zoomOff();
-
-