- java.lang.Object
-
- com.softwarefx.chartfx.server.Title
-
- Direct Known Subclasses:
- TitleDockable
public class Title
extends java.lang.Object
Provides access to the Title object, and allows the customization of the axis titles as well as the titles of the chart.
A title is a string that can be assigned to any portion outside the main chart area. {prods} supports the creation of many titles through the
setTitlesmethod in theChart.setTitleare also available forAxisXandAxisY.Titles can be positioned, aligned and formatted according to the different methods supported by this and
TitleDockable.Titles can be assigned via the Chart FX designer methods list or you can create and control them programmatically.
TitleDockable title;
title = new TitleDockable();
title.setText("US Population by Age Group");
title.setFont(new java.awt.Font("Arial",java.awt.Font.PLAIN, 12));
title.setAlignment(StringAlignment.CENTER);
chart1.getTitles().add(title);
chart1.getTitles().add(new TitleDockable("Effective by 2010"));
PopulatePopulationData(chart1);
chart1.setGallery(Gallery.BAR);
public static void PopulatePopulationData(Chart chart1, String fieldNames) { PopulationData[] data = new PopulationData[]{ new PopulationData("0-4", 10471, 10024), new PopulationData("5-9", 9954, 9512), new PopulationData("10-14", 10670, 10167), new PopulationData("15-19", 10871, 10312), new PopulationData("20-24", 10719, 10178), new PopulationData("25-29", 10060, 9744), new PopulationData("30-34", 10021, 9864), new PopulationData("35-39", 10479, 10424), new PopulationData("40-44", 11294, 11454), new PopulationData("45-49", 11080, 11377), new PopulationData("50-54", 9772, 10212), new PopulationData("55-59", 8415, 8944), new PopulationData("60-64", 6203, 6814), new PopulationData("65-69", 4712, 5412), new PopulationData("70-74", 3804, 4697), new PopulationData("75-79", 3094, 4282), new PopulationData("80-84", 2117, 3459), new PopulationData("85-89", 1072, 2135), new PopulationData("90-94", 397, 1034), new PopulationData("95-99", 91, 321), new PopulationData("100+", 12, 58) }; ObjectProvider objProvider = new ObjectProvider(data); chart1.getDataSourceSettings().setDataSource(objProvider); if (fieldNames != "") { List<DataField> removeFields = new ArrayList<DataField>(); List<String> includeFields = Arrays.asList(fieldNames.split(",")); chart1.getDataSourceSettings().fillFromSchema(); for (DataField dataField : chart1.getDataSourceSettings().getDataFields()) { if (dataField.isMeasure() && !includeFields.contains(dataField.getDataPath())) { removeFields.add(dataField); } } for (DataField dataField : removeFields) { chart1.getDataSourceSettings().getDataFields().remove(dataField); } } } public static void PopulatePopulationData(Chart chart1) { PopulatePopulationData(chart1, ""); }public static class PopulationData { public PopulationData(String range, double male, double female) { this.setRange(range); this.setMale(male); this.setFemale(female); } private String privateRange; public final String getRange() { return privateRange; } public final void setRange(String value) { privateRange = value; } private double privateMale; public final double getMale() { return privateMale; } public final void setMale(double value) { privateMale = value; } private double privateFemale; public final double getFemale() { return privateFemale; } public final void setFemale(double value) { privateFemale = value; } }
-
-
Constructor Summary
Constructors Constructor and Description Title()Constructs a newly allocated Title object
-
Method Summary
Methods Modifier and Type Method and Description StringAlignmentgetAlignment()Allows you to set the alignment of the specified title.java.awt.ColorgetBackColor()Gets or sets the background color of the specified title.java.awt.FontgetFont()Assigns a font to the specified title.intgetIndentation()Specifies the space in pixels to the front and back of the selected title when read from top to bottom.StringAlignmentgetLineAlignment()Gets or sets the vertical alignment for the lines of the chart title.com.softwarefx.server.LinkgetLink()Gets the Link object for a selected title item.intgetSeparation()Specifies the space in pixels above and below the selected title text when read from right to left.java.lang.StringgetText()Gets or sets the text for the selected title.java.awt.ColorgetTextColor()Sets the color of text for the specified title.booleanisRichText()Gets or sets whether or not the selected Title can be enhanced adding basic HTML markup.voidresetAdditionalFontSize()Set the property AdditionalFontSize to its default value.voidresetAlignment()Set the property Alignment to its default value.voidresetBackColor()Set the property BackColor to its default value.voidresetDock()Set the property Dock to its default value.voidresetFlags()Set the property Flags to its default value.voidresetFont()Set the property Font to its default value.voidresetIndentation()Set the property Indentation to its default value.voidresetLineAlignment()Set the property LineAlignment to its default value.voidresetRichText()Set the property RichText to its default value.voidresetSeparation()Set the property Separation to its default value.voidresetText()Set the property Text to its default value.voidresetTextColor()Set the property TextColor to its default value.voidsetAlignment(StringAlignment value)Allows you to set the alignment of the specified title.voidsetBackColor(java.awt.Color value)Gets or sets the background color of the specified title.voidsetFont(java.awt.Font value)Assigns a font to the specified title.voidsetIndentation(int value)Specifies the space in pixels to the front and back of the selected title when read from top to bottom.voidsetLineAlignment(StringAlignment value)Gets or sets the vertical alignment for the lines of the chart title.voidsetRichText(boolean value)Gets or sets whether or not the selected Title can be enhanced adding basic HTML markup.voidsetSeparation(int value)Specifies the space in pixels above and below the selected title text when read from right to left.voidsetText(java.lang.String value)Gets or sets the text for the selected title.voidsetTextColor(java.awt.Color value)Sets the color of text for the specified title.
-
-
-
Method Detail
-
getAlignment
public StringAlignment getAlignment()
Allows you to set the alignment of the specified title.
TitleDockable td;
td = new TitleDockable("Vehicles Production by Type");
td.setAlignment(StringAlignment.FAR);
chart1.getTitles().add(td);
PopulateCarProduction(chart1);
public static void PopulateCarProduction(Chart chart1) { CarProduction[] production = new CarProduction[] { new CarProduction("Jan", 1760, 535, 695 ) , new CarProduction("Feb", 1849, 395, 688 ) , new CarProduction("Mar", 2831, 685, 1047 ) , new CarProduction("Apr", 2851, 984, 1652 ) , new CarProduction("May", 2961, 1579, 1889 ) , new CarProduction("Jun", 1519, 1539, 1766 ) , new CarProduction("Jul", 2633, 1489, 1361 ) , new CarProduction("Aug", 1140, 650, 874 ) , new CarProduction("Sep", 1626, 653, 693 ) , new CarProduction("Oct", 1478, 2236, 786 ) , new CarProduction("Nov", 1306, 1937, 599 ) , new CarProduction("Dec", 1607, 2138, 678 ) }; ObjectProvider objProvider = new ObjectProvider(production); chart1.getDataSourceSettings().setDataSource(objProvider); }public static class CarProduction { private CarProduction(String month, int sedan, int coupe, int SUV) { this.setMonth(month); this.setSedan(sedan); this.setCoupe(coupe); this.setSUV(SUV); } private String privateMonth; public final String getMonth() { return privateMonth; } public final void setMonth(String value) { privateMonth = value; } private int privateSedan; public final int getSedan() { return privateSedan; } public final void setSedan(int value) { privateSedan = value; } private int privateCoupe; public final int getCoupe() { return privateCoupe; } public final void setCoupe(int value) { privateCoupe = value; } private int privateSUV; public final int getSUV() { return privateSUV; } public final void setSUV(int value) { privateSUV = value; } }
TitleDockable td;
td = new TitleDockable("Vehicles Production by Type");
td.setAlignment(StringAlignment.CENTER);
chart1.getTitles().add(td);
PopulateCarProduction(chart1);
public static void PopulateCarProduction(Chart chart1) { CarProduction[] production = new CarProduction[] { new CarProduction("Jan", 1760, 535, 695 ) , new CarProduction("Feb", 1849, 395, 688 ) , new CarProduction("Mar", 2831, 685, 1047 ) , new CarProduction("Apr", 2851, 984, 1652 ) , new CarProduction("May", 2961, 1579, 1889 ) , new CarProduction("Jun", 1519, 1539, 1766 ) , new CarProduction("Jul", 2633, 1489, 1361 ) , new CarProduction("Aug", 1140, 650, 874 ) , new CarProduction("Sep", 1626, 653, 693 ) , new CarProduction("Oct", 1478, 2236, 786 ) , new CarProduction("Nov", 1306, 1937, 599 ) , new CarProduction("Dec", 1607, 2138, 678 ) }; ObjectProvider objProvider = new ObjectProvider(production); chart1.getDataSourceSettings().setDataSource(objProvider); }public static class CarProduction { private CarProduction(String month, int sedan, int coupe, int SUV) { this.setMonth(month); this.setSedan(sedan); this.setCoupe(coupe); this.setSUV(SUV); } private String privateMonth; public final String getMonth() { return privateMonth; } public final void setMonth(String value) { privateMonth = value; } private int privateSedan; public final int getSedan() { return privateSedan; } public final void setSedan(int value) { privateSedan = value; } private int privateCoupe; public final int getCoupe() { return privateCoupe; } public final void setCoupe(int value) { privateCoupe = value; } private int privateSUV; public final int getSUV() { return privateSUV; } public final void setSUV(int value) { privateSUV = value; } }
TitleDockable td;
td = new TitleDockable("Vehicles Production by Type");
td.setAlignment(StringAlignment.NEAR);
chart1.getTitles().add(td);
PopulateCarProduction(chart1);
public static void PopulateCarProduction(Chart chart1) { CarProduction[] production = new CarProduction[] { new CarProduction("Jan", 1760, 535, 695 ) , new CarProduction("Feb", 1849, 395, 688 ) , new CarProduction("Mar", 2831, 685, 1047 ) , new CarProduction("Apr", 2851, 984, 1652 ) , new CarProduction("May", 2961, 1579, 1889 ) , new CarProduction("Jun", 1519, 1539, 1766 ) , new CarProduction("Jul", 2633, 1489, 1361 ) , new CarProduction("Aug", 1140, 650, 874 ) , new CarProduction("Sep", 1626, 653, 693 ) , new CarProduction("Oct", 1478, 2236, 786 ) , new CarProduction("Nov", 1306, 1937, 599 ) , new CarProduction("Dec", 1607, 2138, 678 ) }; ObjectProvider objProvider = new ObjectProvider(production); chart1.getDataSourceSettings().setDataSource(objProvider); }public static class CarProduction { private CarProduction(String month, int sedan, int coupe, int SUV) { this.setMonth(month); this.setSedan(sedan); this.setCoupe(coupe); this.setSUV(SUV); } private String privateMonth; public final String getMonth() { return privateMonth; } public final void setMonth(String value) { privateMonth = value; } private int privateSedan; public final int getSedan() { return privateSedan; } public final void setSedan(int value) { privateSedan = value; } private int privateCoupe; public final int getCoupe() { return privateCoupe; } public final void setCoupe(int value) { privateCoupe = value; } private int privateSUV; public final int getSUV() { return privateSUV; } public final void setSUV(int value) { privateSUV = value; } }
- See Also:
resetAlignment
-
setAlignment
public void setAlignment(StringAlignment value)
Allows you to set the alignment of the specified title.
TitleDockable td;
td = new TitleDockable("Vehicles Production by Type");
td.setAlignment(StringAlignment.FAR);
chart1.getTitles().add(td);
PopulateCarProduction(chart1);
public static void PopulateCarProduction(Chart chart1) { CarProduction[] production = new CarProduction[] { new CarProduction("Jan", 1760, 535, 695 ) , new CarProduction("Feb", 1849, 395, 688 ) , new CarProduction("Mar", 2831, 685, 1047 ) , new CarProduction("Apr", 2851, 984, 1652 ) , new CarProduction("May", 2961, 1579, 1889 ) , new CarProduction("Jun", 1519, 1539, 1766 ) , new CarProduction("Jul", 2633, 1489, 1361 ) , new CarProduction("Aug", 1140, 650, 874 ) , new CarProduction("Sep", 1626, 653, 693 ) , new CarProduction("Oct", 1478, 2236, 786 ) , new CarProduction("Nov", 1306, 1937, 599 ) , new CarProduction("Dec", 1607, 2138, 678 ) }; ObjectProvider objProvider = new ObjectProvider(production); chart1.getDataSourceSettings().setDataSource(objProvider); }public static class CarProduction { private CarProduction(String month, int sedan, int coupe, int SUV) { this.setMonth(month); this.setSedan(sedan); this.setCoupe(coupe); this.setSUV(SUV); } private String privateMonth; public final String getMonth() { return privateMonth; } public final void setMonth(String value) { privateMonth = value; } private int privateSedan; public final int getSedan() { return privateSedan; } public final void setSedan(int value) { privateSedan = value; } private int privateCoupe; public final int getCoupe() { return privateCoupe; } public final void setCoupe(int value) { privateCoupe = value; } private int privateSUV; public final int getSUV() { return privateSUV; } public final void setSUV(int value) { privateSUV = value; } }
TitleDockable td;
td = new TitleDockable("Vehicles Production by Type");
td.setAlignment(StringAlignment.CENTER);
chart1.getTitles().add(td);
PopulateCarProduction(chart1);
public static void PopulateCarProduction(Chart chart1) { CarProduction[] production = new CarProduction[] { new CarProduction("Jan", 1760, 535, 695 ) , new CarProduction("Feb", 1849, 395, 688 ) , new CarProduction("Mar", 2831, 685, 1047 ) , new CarProduction("Apr", 2851, 984, 1652 ) , new CarProduction("May", 2961, 1579, 1889 ) , new CarProduction("Jun", 1519, 1539, 1766 ) , new CarProduction("Jul", 2633, 1489, 1361 ) , new CarProduction("Aug", 1140, 650, 874 ) , new CarProduction("Sep", 1626, 653, 693 ) , new CarProduction("Oct", 1478, 2236, 786 ) , new CarProduction("Nov", 1306, 1937, 599 ) , new CarProduction("Dec", 1607, 2138, 678 ) }; ObjectProvider objProvider = new ObjectProvider(production); chart1.getDataSourceSettings().setDataSource(objProvider); }public static class CarProduction { private CarProduction(String month, int sedan, int coupe, int SUV) { this.setMonth(month); this.setSedan(sedan); this.setCoupe(coupe); this.setSUV(SUV); } private String privateMonth; public final String getMonth() { return privateMonth; } public final void setMonth(String value) { privateMonth = value; } private int privateSedan; public final int getSedan() { return privateSedan; } public final void setSedan(int value) { privateSedan = value; } private int privateCoupe; public final int getCoupe() { return privateCoupe; } public final void setCoupe(int value) { privateCoupe = value; } private int privateSUV; public final int getSUV() { return privateSUV; } public final void setSUV(int value) { privateSUV = value; } }
TitleDockable td;
td = new TitleDockable("Vehicles Production by Type");
td.setAlignment(StringAlignment.NEAR);
chart1.getTitles().add(td);
PopulateCarProduction(chart1);
public static void PopulateCarProduction(Chart chart1) { CarProduction[] production = new CarProduction[] { new CarProduction("Jan", 1760, 535, 695 ) , new CarProduction("Feb", 1849, 395, 688 ) , new CarProduction("Mar", 2831, 685, 1047 ) , new CarProduction("Apr", 2851, 984, 1652 ) , new CarProduction("May", 2961, 1579, 1889 ) , new CarProduction("Jun", 1519, 1539, 1766 ) , new CarProduction("Jul", 2633, 1489, 1361 ) , new CarProduction("Aug", 1140, 650, 874 ) , new CarProduction("Sep", 1626, 653, 693 ) , new CarProduction("Oct", 1478, 2236, 786 ) , new CarProduction("Nov", 1306, 1937, 599 ) , new CarProduction("Dec", 1607, 2138, 678 ) }; ObjectProvider objProvider = new ObjectProvider(production); chart1.getDataSourceSettings().setDataSource(objProvider); }public static class CarProduction { private CarProduction(String month, int sedan, int coupe, int SUV) { this.setMonth(month); this.setSedan(sedan); this.setCoupe(coupe); this.setSUV(SUV); } private String privateMonth; public final String getMonth() { return privateMonth; } public final void setMonth(String value) { privateMonth = value; } private int privateSedan; public final int getSedan() { return privateSedan; } public final void setSedan(int value) { privateSedan = value; } private int privateCoupe; public final int getCoupe() { return privateCoupe; } public final void setCoupe(int value) { privateCoupe = value; } private int privateSUV; public final int getSUV() { return privateSUV; } public final void setSUV(int value) { privateSUV = value; } }
- Parameters:
value-- See Also:
resetAlignment
-
getBackColor
public java.awt.Color getBackColor()
Gets or sets the background color of the specified title.
TitleDockable td;
td = new TitleDockable("Wine Sales by Type");
td.setBackColor(new java.awt.Color(245,245,220,255));
chart1.getTitles().add(td);
PopulateProductSales(chart1);
chart1.getAxisY().getLabelsFormat().setFormat(AxisFormat.CURRENCY);
public static void PopulateProductSales(Chart chart1) { ProductSales[] data = new ProductSales[]{ new ProductSales("Jan", 12560, 23400, 34500), new ProductSales("Feb", 13400, 21000, 38900), new ProductSales("Mar", 16700, 17000, 42100), new ProductSales("Apr", 12000, 19020, 43800), new ProductSales("May", 15800, 26500, 37540), new ProductSales("Jun", 9800, 27800, 32580), new ProductSales("Jul", 17800, 29820, 34000), new ProductSales("Aug", 19800, 17800, 38000), new ProductSales("Sep", 23200, 32000, 41300), new ProductSales("Oct", 16700, 26500, 46590), new ProductSales("Nov", 11800, 23000, 48700), new ProductSales("Dec", 13400, 15400, 49100) }; ObjectProvider objProvider = new ObjectProvider(data); chart1.getDataSourceSettings().setDataSource(objProvider); }public static class ProductSales { public ProductSales(String month, double white, double red, double sparkling) { this.setMonth(month); this.setWhite(white); this.setRed(red); this.setSparkling(sparkling); } private String privateMonth; public final String getMonth() { return privateMonth; } public final void setMonth(String value) { privateMonth = value; } private double privateWhite; public final double getWhite() { return privateWhite; } public final void setWhite(double value) { privateWhite = value; } private double privateRed; public final double getRed() { return privateRed; } public final void setRed(double value) { privateRed = value; } private double privateSparkling; public final double getSparkling() { return privateSparkling; } public final void setSparkling(double value) { privateSparkling = value; } }
chart1.getAxisY().getTitle().setBackColor(new java.awt.Color(0,255,255,255));
PopulateMiamiClimate(chart1,"Average");
chart1.getTitles().add(new TitleDockable("Miami Average Temperature in 2012"));
chart1.getAxisY().getTitle().setText("Temperature (°F)");
chart1.getLegendBox().setVisible(false);
public static void PopulateMiamiClimate(Chart chart1, String fieldNames) { MiamiClimate[] data = new MiamiClimate[] { new MiamiClimate("Jan", 59.6, 76.5, 67.2, 1.88, 9.5, 59 ), new MiamiClimate("Feb", 60.5, 77.7, 68.5, 2.07, 10.1, 71 ), new MiamiClimate("Mar", 64, 80.7, 71.7, 2.56, 10.5, 69.5 ), new MiamiClimate("Apr", 67.6, 83.8, 75.2, 3.36, 10.5, 67.5 ), new MiamiClimate("May", 72, 87.2, 78.7, 5.52, 9.5, 67 ), new MiamiClimate("Jun", 75.2, 89.5, 81.4, 8.54, 8.3, 71 ), new MiamiClimate("Jul", 76.5, 90.9, 82.6, 5.79, 7.9, 74 ), new MiamiClimate("Aug", 76.5, 90.6, 82.8, 8.63, 7.9, 74 ), new MiamiClimate("Sep", 75.7, 89, 81.9, 8.38, 8.2, 76 ), new MiamiClimate("Oct", 72.2, 85.4, 78.3, 6.19, 9.2, 76 ), new MiamiClimate("Nov", 67.5, 81.2, 73.6, 3.43, 9.7, 74 ), new MiamiClimate("Dec", 62.2, 77.5, 69.1, 2.18, 9.2, 73 ) }; ObjectProvider objProvider = new ObjectProvider(data); chart1.getDataSourceSettings().setDataSource(objProvider); if (fieldNames != ""){ List<DataField> removeFields = new ArrayList<DataField>(); List<String> includeFields = Arrays.asList(fieldNames.split(",")); chart1.getDataSourceSettings().fillFromSchema(); for (DataField dataField : chart1.getDataSourceSettings().getDataFields()) { if (dataField.isMeasure() && !includeFields.contains(dataField.getDataPath())) { removeFields.add(dataField); } } for (DataField dataField : removeFields) { chart1.getDataSourceSettings().getDataFields().remove(dataField); } } } public static void PopulateMiamiClimate(Chart chart1) { PopulateMiamiClimate(chart1, ""); }public static class MiamiClimate { public MiamiClimate(String Month, double low, double high, double average, double precipitation, double windSpeed, double relativeHumidity) { this.setMonth(Month); this.setLow(low); this.setHigh(high); this.setAverage(average); this.setPrecipitation(precipitation); this.setWindSpeed(windSpeed); this.setRelativeHumidity(relativeHumidity); } private String privateMonth; public final String getMonth() { return privateMonth; } public final void setMonth(String value) { privateMonth = value; } private double privateLow; public final double getLow() { return privateLow; } public final void setLow(double value) { privateLow = value; } private double privateHigh; public final double getHigh() { return privateHigh; } public final void setHigh(double value) { privateHigh = value; } private double privateAverage; public final double getAverage() { return privateAverage; } public final void setAverage(double value) { privateAverage = value; } private double privatePrecipitation; public final double getPrecipitation() { return privatePrecipitation; } public final void setPrecipitation(double value) { privatePrecipitation = value; } private double privateWindSpeed; public final double getWindSpeed() { return privateWindSpeed; } public final void setWindSpeed(double value) { privateWindSpeed = value; } private double privateRelativeHumidity; public final double getRelativeHumidity() { return privateRelativeHumidity; } public final void setRelativeHumidity(double value) { privateRelativeHumidity = value; } }
- See Also:
resetBackColor
-
setBackColor
public void setBackColor(java.awt.Color value)
Gets or sets the background color of the specified title.
TitleDockable td;
td = new TitleDockable("Wine Sales by Type");
td.setBackColor(new java.awt.Color(245,245,220,255));
chart1.getTitles().add(td);
PopulateProductSales(chart1);
chart1.getAxisY().getLabelsFormat().setFormat(AxisFormat.CURRENCY);
public static void PopulateProductSales(Chart chart1) { ProductSales[] data = new ProductSales[]{ new ProductSales("Jan", 12560, 23400, 34500), new ProductSales("Feb", 13400, 21000, 38900), new ProductSales("Mar", 16700, 17000, 42100), new ProductSales("Apr", 12000, 19020, 43800), new ProductSales("May", 15800, 26500, 37540), new ProductSales("Jun", 9800, 27800, 32580), new ProductSales("Jul", 17800, 29820, 34000), new ProductSales("Aug", 19800, 17800, 38000), new ProductSales("Sep", 23200, 32000, 41300), new ProductSales("Oct", 16700, 26500, 46590), new ProductSales("Nov", 11800, 23000, 48700), new ProductSales("Dec", 13400, 15400, 49100) }; ObjectProvider objProvider = new ObjectProvider(data); chart1.getDataSourceSettings().setDataSource(objProvider); }public static class ProductSales { public ProductSales(String month, double white, double red, double sparkling) { this.setMonth(month); this.setWhite(white); this.setRed(red); this.setSparkling(sparkling); } private String privateMonth; public final String getMonth() { return privateMonth; } public final void setMonth(String value) { privateMonth = value; } private double privateWhite; public final double getWhite() { return privateWhite; } public final void setWhite(double value) { privateWhite = value; } private double privateRed; public final double getRed() { return privateRed; } public final void setRed(double value) { privateRed = value; } private double privateSparkling; public final double getSparkling() { return privateSparkling; } public final void setSparkling(double value) { privateSparkling = value; } }
chart1.getAxisY().getTitle().setBackColor(new java.awt.Color(0,255,255,255));
PopulateMiamiClimate(chart1,"Average");
chart1.getTitles().add(new TitleDockable("Miami Average Temperature in 2012"));
chart1.getAxisY().getTitle().setText("Temperature (°F)");
chart1.getLegendBox().setVisible(false);
public static void PopulateMiamiClimate(Chart chart1, String fieldNames) { MiamiClimate[] data = new MiamiClimate[] { new MiamiClimate("Jan", 59.6, 76.5, 67.2, 1.88, 9.5, 59 ), new MiamiClimate("Feb", 60.5, 77.7, 68.5, 2.07, 10.1, 71 ), new MiamiClimate("Mar", 64, 80.7, 71.7, 2.56, 10.5, 69.5 ), new MiamiClimate("Apr", 67.6, 83.8, 75.2, 3.36, 10.5, 67.5 ), new MiamiClimate("May", 72, 87.2, 78.7, 5.52, 9.5, 67 ), new MiamiClimate("Jun", 75.2, 89.5, 81.4, 8.54, 8.3, 71 ), new MiamiClimate("Jul", 76.5, 90.9, 82.6, 5.79, 7.9, 74 ), new MiamiClimate("Aug", 76.5, 90.6, 82.8, 8.63, 7.9, 74 ), new MiamiClimate("Sep", 75.7, 89, 81.9, 8.38, 8.2, 76 ), new MiamiClimate("Oct", 72.2, 85.4, 78.3, 6.19, 9.2, 76 ), new MiamiClimate("Nov", 67.5, 81.2, 73.6, 3.43, 9.7, 74 ), new MiamiClimate("Dec", 62.2, 77.5, 69.1, 2.18, 9.2, 73 ) }; ObjectProvider objProvider = new ObjectProvider(data); chart1.getDataSourceSettings().setDataSource(objProvider); if (fieldNames != ""){ List<DataField> removeFields = new ArrayList<DataField>(); List<String> includeFields = Arrays.asList(fieldNames.split(",")); chart1.getDataSourceSettings().fillFromSchema(); for (DataField dataField : chart1.getDataSourceSettings().getDataFields()) { if (dataField.isMeasure() && !includeFields.contains(dataField.getDataPath())) { removeFields.add(dataField); } } for (DataField dataField : removeFields) { chart1.getDataSourceSettings().getDataFields().remove(dataField); } } } public static void PopulateMiamiClimate(Chart chart1) { PopulateMiamiClimate(chart1, ""); }public static class MiamiClimate { public MiamiClimate(String Month, double low, double high, double average, double precipitation, double windSpeed, double relativeHumidity) { this.setMonth(Month); this.setLow(low); this.setHigh(high); this.setAverage(average); this.setPrecipitation(precipitation); this.setWindSpeed(windSpeed); this.setRelativeHumidity(relativeHumidity); } private String privateMonth; public final String getMonth() { return privateMonth; } public final void setMonth(String value) { privateMonth = value; } private double privateLow; public final double getLow() { return privateLow; } public final void setLow(double value) { privateLow = value; } private double privateHigh; public final double getHigh() { return privateHigh; } public final void setHigh(double value) { privateHigh = value; } private double privateAverage; public final double getAverage() { return privateAverage; } public final void setAverage(double value) { privateAverage = value; } private double privatePrecipitation; public final double getPrecipitation() { return privatePrecipitation; } public final void setPrecipitation(double value) { privatePrecipitation = value; } private double privateWindSpeed; public final double getWindSpeed() { return privateWindSpeed; } public final void setWindSpeed(double value) { privateWindSpeed = value; } private double privateRelativeHumidity; public final double getRelativeHumidity() { return privateRelativeHumidity; } public final void setRelativeHumidity(double value) { privateRelativeHumidity = value; } }
- Parameters:
value-- See Also:
resetBackColor
-
getFont
public java.awt.Font getFont()
Assigns a font to the specified title.
You can set the font for the entire chart using the
ChartobjectsetChartFontmethod.When setting a font in Chart FX, you must create a new font object with the desired attributes and assign that object to the desired chart element every time you want to change the font.
For more information regarding the Font type, please refer to the Java Documentation.
Fonts can be specified by using the standard string notation for fully or partially qualifying a font object. For example, "Verdana,12,style=italic,Bold" produces a font of type Verdana, point size of 12 and font style of Italic and Bold.
Below, the title of the chart is rendered using an Arial font of size 12:
TitleDockable td;
td = new TitleDockable("Wine Sales by Type");
td.setChartFont(new java.awt.Font("Arial",java.awt.Font.PLAIN, 12));
chart1.getTitles().add(td);
PopulateProductSales(chart1);
chart1.getAxisY().getLabelsFormat().setFormat(AxisFormat.CURRENCY);
public static void PopulateProductSales(Chart chart1) { ProductSales[] data = new ProductSales[]{ new ProductSales("Jan", 12560, 23400, 34500), new ProductSales("Feb", 13400, 21000, 38900), new ProductSales("Mar", 16700, 17000, 42100), new ProductSales("Apr", 12000, 19020, 43800), new ProductSales("May", 15800, 26500, 37540), new ProductSales("Jun", 9800, 27800, 32580), new ProductSales("Jul", 17800, 29820, 34000), new ProductSales("Aug", 19800, 17800, 38000), new ProductSales("Sep", 23200, 32000, 41300), new ProductSales("Oct", 16700, 26500, 46590), new ProductSales("Nov", 11800, 23000, 48700), new ProductSales("Dec", 13400, 15400, 49100) }; ObjectProvider objProvider = new ObjectProvider(data); chart1.getDataSourceSettings().setDataSource(objProvider); }public static class ProductSales { public ProductSales(String month, double white, double red, double sparkling) { this.setMonth(month); this.setWhite(white); this.setRed(red); this.setSparkling(sparkling); } private String privateMonth; public final String getMonth() { return privateMonth; } public final void setMonth(String value) { privateMonth = value; } private double privateWhite; public final double getWhite() { return privateWhite; } public final void setWhite(double value) { privateWhite = value; } private double privateRed; public final double getRed() { return privateRed; } public final void setRed(double value) { privateRed = value; } private double privateSparkling; public final double getSparkling() { return privateSparkling; } public final void setSparkling(double value) { privateSparkling = value; } }
- See Also:
resetFont
-
setFont
public void setFont(java.awt.Font value)
Assigns a font to the specified title.
You can set the font for the entire chart using the
ChartobjectsetChartFontmethod.When setting a font in Chart FX, you must create a new font object with the desired attributes and assign that object to the desired chart element every time you want to change the font.
For more information regarding the Font type, please refer to the Java Documentation.
Fonts can be specified by using the standard string notation for fully or partially qualifying a font object. For example, "Verdana,12,style=italic,Bold" produces a font of type Verdana, point size of 12 and font style of Italic and Bold.
Below, the title of the chart is rendered using an Arial font of size 12:
TitleDockable td;
td = new TitleDockable("Wine Sales by Type");
td.setChartFont(new java.awt.Font("Arial",java.awt.Font.PLAIN, 12));
chart1.getTitles().add(td);
PopulateProductSales(chart1);
chart1.getAxisY().getLabelsFormat().setFormat(AxisFormat.CURRENCY);
public static void PopulateProductSales(Chart chart1) { ProductSales[] data = new ProductSales[]{ new ProductSales("Jan", 12560, 23400, 34500), new ProductSales("Feb", 13400, 21000, 38900), new ProductSales("Mar", 16700, 17000, 42100), new ProductSales("Apr", 12000, 19020, 43800), new ProductSales("May", 15800, 26500, 37540), new ProductSales("Jun", 9800, 27800, 32580), new ProductSales("Jul", 17800, 29820, 34000), new ProductSales("Aug", 19800, 17800, 38000), new ProductSales("Sep", 23200, 32000, 41300), new ProductSales("Oct", 16700, 26500, 46590), new ProductSales("Nov", 11800, 23000, 48700), new ProductSales("Dec", 13400, 15400, 49100) }; ObjectProvider objProvider = new ObjectProvider(data); chart1.getDataSourceSettings().setDataSource(objProvider); }public static class ProductSales { public ProductSales(String month, double white, double red, double sparkling) { this.setMonth(month); this.setWhite(white); this.setRed(red); this.setSparkling(sparkling); } private String privateMonth; public final String getMonth() { return privateMonth; } public final void setMonth(String value) { privateMonth = value; } private double privateWhite; public final double getWhite() { return privateWhite; } public final void setWhite(double value) { privateWhite = value; } private double privateRed; public final double getRed() { return privateRed; } public final void setRed(double value) { privateRed = value; } private double privateSparkling; public final double getSparkling() { return privateSparkling; } public final void setSparkling(double value) { privateSparkling = value; } }
- Parameters:
value-- See Also:
resetFont
-
getIndentation
public int getIndentation()
Specifies the space in pixels to the front and back of the selected title when read from top to bottom.
chart1.getAxisY().getTitle().setText("Percentage");
chart1.getAxisY().getTitle().setAlignment(StringAlignment.NEAR);
chart1.getAxisY().getTitle().setIndentation(50);
PopulatePopulationData(chart1);
chart1.getTitles().add(new TitleDockable("Population Distribution by Gender and Age Range"));
chart1.getAxisX().getTitle().setText("Age Range");
public static void PopulatePopulationData(Chart chart1, String fieldNames) { PopulationData[] data = new PopulationData[]{ new PopulationData("0-4", 10471, 10024), new PopulationData("5-9", 9954, 9512), new PopulationData("10-14", 10670, 10167), new PopulationData("15-19", 10871, 10312), new PopulationData("20-24", 10719, 10178), new PopulationData("25-29", 10060, 9744), new PopulationData("30-34", 10021, 9864), new PopulationData("35-39", 10479, 10424), new PopulationData("40-44", 11294, 11454), new PopulationData("45-49", 11080, 11377), new PopulationData("50-54", 9772, 10212), new PopulationData("55-59", 8415, 8944), new PopulationData("60-64", 6203, 6814), new PopulationData("65-69", 4712, 5412), new PopulationData("70-74", 3804, 4697), new PopulationData("75-79", 3094, 4282), new PopulationData("80-84", 2117, 3459), new PopulationData("85-89", 1072, 2135), new PopulationData("90-94", 397, 1034), new PopulationData("95-99", 91, 321), new PopulationData("100+", 12, 58) }; ObjectProvider objProvider = new ObjectProvider(data); chart1.getDataSourceSettings().setDataSource(objProvider); if (fieldNames != "") { List<DataField> removeFields = new ArrayList<DataField>(); List<String> includeFields = Arrays.asList(fieldNames.split(",")); chart1.getDataSourceSettings().fillFromSchema(); for (DataField dataField : chart1.getDataSourceSettings().getDataFields()) { if (dataField.isMeasure() && !includeFields.contains(dataField.getDataPath())) { removeFields.add(dataField); } } for (DataField dataField : removeFields) { chart1.getDataSourceSettings().getDataFields().remove(dataField); } } } public static void PopulatePopulationData(Chart chart1) { PopulatePopulationData(chart1, ""); }public static class PopulationData { public PopulationData(String range, double male, double female) { this.setRange(range); this.setMale(male); this.setFemale(female); } private String privateRange; public final String getRange() { return privateRange; } public final void setRange(String value) { privateRange = value; } private double privateMale; public final double getMale() { return privateMale; } public final void setMale(double value) { privateMale = value; } private double privateFemale; public final double getFemale() { return privateFemale; } public final void setFemale(double value) { privateFemale = value; } }
chart1.getAxisY().getTitle().setText("Percentage");
chart1.getAxisY().getTitle().setAlignment(StringAlignment.NEAR);
chart1.getAxisY().getTitle().setIndentation(100);
PopulatePopulationData(chart1);
chart1.getTitles().add(new TitleDockable("Population Distribution by Gender and Age Range"));
chart1.getAxisX().getTitle().setText("Age Range");
public static void PopulatePopulationData(Chart chart1, String fieldNames) { PopulationData[] data = new PopulationData[]{ new PopulationData("0-4", 10471, 10024), new PopulationData("5-9", 9954, 9512), new PopulationData("10-14", 10670, 10167), new PopulationData("15-19", 10871, 10312), new PopulationData("20-24", 10719, 10178), new PopulationData("25-29", 10060, 9744), new PopulationData("30-34", 10021, 9864), new PopulationData("35-39", 10479, 10424), new PopulationData("40-44", 11294, 11454), new PopulationData("45-49", 11080, 11377), new PopulationData("50-54", 9772, 10212), new PopulationData("55-59", 8415, 8944), new PopulationData("60-64", 6203, 6814), new PopulationData("65-69", 4712, 5412), new PopulationData("70-74", 3804, 4697), new PopulationData("75-79", 3094, 4282), new PopulationData("80-84", 2117, 3459), new PopulationData("85-89", 1072, 2135), new PopulationData("90-94", 397, 1034), new PopulationData("95-99", 91, 321), new PopulationData("100+", 12, 58) }; ObjectProvider objProvider = new ObjectProvider(data); chart1.getDataSourceSettings().setDataSource(objProvider); if (fieldNames != "") { List<DataField> removeFields = new ArrayList<DataField>(); List<String> includeFields = Arrays.asList(fieldNames.split(",")); chart1.getDataSourceSettings().fillFromSchema(); for (DataField dataField : chart1.getDataSourceSettings().getDataFields()) { if (dataField.isMeasure() && !includeFields.contains(dataField.getDataPath())) { removeFields.add(dataField); } } for (DataField dataField : removeFields) { chart1.getDataSourceSettings().getDataFields().remove(dataField); } } } public static void PopulatePopulationData(Chart chart1) { PopulatePopulationData(chart1, ""); }public static class PopulationData { public PopulationData(String range, double male, double female) { this.setRange(range); this.setMale(male); this.setFemale(female); } private String privateRange; public final String getRange() { return privateRange; } public final void setRange(String value) { privateRange = value; } private double privateMale; public final double getMale() { return privateMale; } public final void setMale(double value) { privateMale = value; } private double privateFemale; public final double getFemale() { return privateFemale; } public final void setFemale(double value) { privateFemale = value; } }
- See Also:
resetIndentation
-
setIndentation
public void setIndentation(int value)
Specifies the space in pixels to the front and back of the selected title when read from top to bottom.
chart1.getAxisY().getTitle().setText("Percentage");
chart1.getAxisY().getTitle().setAlignment(StringAlignment.NEAR);
chart1.getAxisY().getTitle().setIndentation(50);
PopulatePopulationData(chart1);
chart1.getTitles().add(new TitleDockable("Population Distribution by Gender and Age Range"));
chart1.getAxisX().getTitle().setText("Age Range");
public static void PopulatePopulationData(Chart chart1, String fieldNames) { PopulationData[] data = new PopulationData[]{ new PopulationData("0-4", 10471, 10024), new PopulationData("5-9", 9954, 9512), new PopulationData("10-14", 10670, 10167), new PopulationData("15-19", 10871, 10312), new PopulationData("20-24", 10719, 10178), new PopulationData("25-29", 10060, 9744), new PopulationData("30-34", 10021, 9864), new PopulationData("35-39", 10479, 10424), new PopulationData("40-44", 11294, 11454), new PopulationData("45-49", 11080, 11377), new PopulationData("50-54", 9772, 10212), new PopulationData("55-59", 8415, 8944), new PopulationData("60-64", 6203, 6814), new PopulationData("65-69", 4712, 5412), new PopulationData("70-74", 3804, 4697), new PopulationData("75-79", 3094, 4282), new PopulationData("80-84", 2117, 3459), new PopulationData("85-89", 1072, 2135), new PopulationData("90-94", 397, 1034), new PopulationData("95-99", 91, 321), new PopulationData("100+", 12, 58) }; ObjectProvider objProvider = new ObjectProvider(data); chart1.getDataSourceSettings().setDataSource(objProvider); if (fieldNames != "") { List<DataField> removeFields = new ArrayList<DataField>(); List<String> includeFields = Arrays.asList(fieldNames.split(",")); chart1.getDataSourceSettings().fillFromSchema(); for (DataField dataField : chart1.getDataSourceSettings().getDataFields()) { if (dataField.isMeasure() && !includeFields.contains(dataField.getDataPath())) { removeFields.add(dataField); } } for (DataField dataField : removeFields) { chart1.getDataSourceSettings().getDataFields().remove(dataField); } } } public static void PopulatePopulationData(Chart chart1) { PopulatePopulationData(chart1, ""); }public static class PopulationData { public PopulationData(String range, double male, double female) { this.setRange(range); this.setMale(male); this.setFemale(female); } private String privateRange; public final String getRange() { return privateRange; } public final void setRange(String value) { privateRange = value; } private double privateMale; public final double getMale() { return privateMale; } public final void setMale(double value) { privateMale = value; } private double privateFemale; public final double getFemale() { return privateFemale; } public final void setFemale(double value) { privateFemale = value; } }
chart1.getAxisY().getTitle().setText("Percentage");
chart1.getAxisY().getTitle().setAlignment(StringAlignment.NEAR);
chart1.getAxisY().getTitle().setIndentation(100);
PopulatePopulationData(chart1);
chart1.getTitles().add(new TitleDockable("Population Distribution by Gender and Age Range"));
chart1.getAxisX().getTitle().setText("Age Range");
public static void PopulatePopulationData(Chart chart1, String fieldNames) { PopulationData[] data = new PopulationData[]{ new PopulationData("0-4", 10471, 10024), new PopulationData("5-9", 9954, 9512), new PopulationData("10-14", 10670, 10167), new PopulationData("15-19", 10871, 10312), new PopulationData("20-24", 10719, 10178), new PopulationData("25-29", 10060, 9744), new PopulationData("30-34", 10021, 9864), new PopulationData("35-39", 10479, 10424), new PopulationData("40-44", 11294, 11454), new PopulationData("45-49", 11080, 11377), new PopulationData("50-54", 9772, 10212), new PopulationData("55-59", 8415, 8944), new PopulationData("60-64", 6203, 6814), new PopulationData("65-69", 4712, 5412), new PopulationData("70-74", 3804, 4697), new PopulationData("75-79", 3094, 4282), new PopulationData("80-84", 2117, 3459), new PopulationData("85-89", 1072, 2135), new PopulationData("90-94", 397, 1034), new PopulationData("95-99", 91, 321), new PopulationData("100+", 12, 58) }; ObjectProvider objProvider = new ObjectProvider(data); chart1.getDataSourceSettings().setDataSource(objProvider); if (fieldNames != "") { List<DataField> removeFields = new ArrayList<DataField>(); List<String> includeFields = Arrays.asList(fieldNames.split(",")); chart1.getDataSourceSettings().fillFromSchema(); for (DataField dataField : chart1.getDataSourceSettings().getDataFields()) { if (dataField.isMeasure() && !includeFields.contains(dataField.getDataPath())) { removeFields.add(dataField); } } for (DataField dataField : removeFields) { chart1.getDataSourceSettings().getDataFields().remove(dataField); } } } public static void PopulatePopulationData(Chart chart1) { PopulatePopulationData(chart1, ""); }public static class PopulationData { public PopulationData(String range, double male, double female) { this.setRange(range); this.setMale(male); this.setFemale(female); } private String privateRange; public final String getRange() { return privateRange; } public final void setRange(String value) { privateRange = value; } private double privateMale; public final double getMale() { return privateMale; } public final void setMale(double value) { privateMale = value; } private double privateFemale; public final double getFemale() { return privateFemale; } public final void setFemale(double value) { privateFemale = value; } }
- Parameters:
value-- See Also:
resetIndentation
-
getLineAlignment
public StringAlignment getLineAlignment()
Gets or sets the vertical alignment for the lines of the chart title.
TitleDockable td;
td = new TitleDockable();
td.setLineAlignment(StringAlignment.CENTER);
chart1.getTitles().add(td);
- See Also:
resetLineAlignment
-
setLineAlignment
public void setLineAlignment(StringAlignment value)
Gets or sets the vertical alignment for the lines of the chart title.
TitleDockable td;
td = new TitleDockable();
td.setLineAlignment(StringAlignment.CENTER);
chart1.getTitles().add(td);
- Parameters:
value-- See Also:
resetLineAlignment
-
getLink
public com.softwarefx.server.Link getLink()
Gets the Link object for a selected title item.SoftwareFX.WebForms.Link titleLink; titleLink = chart1.getTitles().get(0).getLink();
-
isRichText
public boolean isRichText()
Gets or sets whether or not the selected Title can be enhanced adding basic HTML markup.
When this method is set to true, the Title
setTextcan be enhanced by adding basic HTML markup.The available markup tags are:
Bold:<b>text</b>
Underline: <u>text</u>
Italic: <i>text</i>
Strike: <s>text</s>
Font: <font color="#FF0000" face="Arial">text</font>
<font> has two attributes: color, to set the color in html format (i.e. #00FF66), and face, to set the font name.
All markup tags must be closed.
Below, the chart uses a title with the word "Type" bold and underlined:
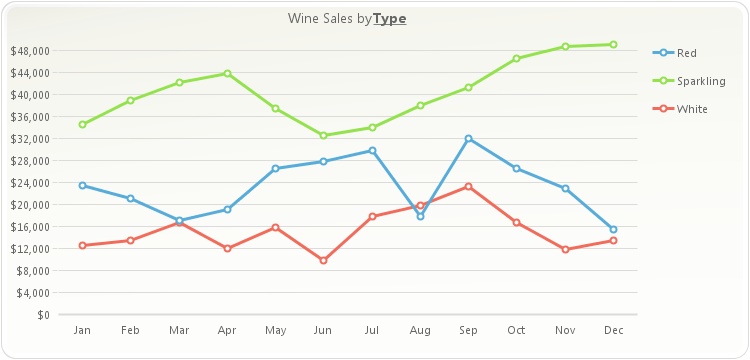
TitleDockable title;
title = new TitleDockable();
title.setText("Wine Sales by <b><u>Type</u></b>");
title.setRichText(true);
chart1.getTitles().add(title);
PopulateProductSales(chart1);
chart1.getAxisY().getLabelsFormat().setFormat(AxisFormat.CURRENCY);
public static void PopulateProductSales(Chart chart1) { ProductSales[] data = new ProductSales[]{ new ProductSales("Jan", 12560, 23400, 34500), new ProductSales("Feb", 13400, 21000, 38900), new ProductSales("Mar", 16700, 17000, 42100), new ProductSales("Apr", 12000, 19020, 43800), new ProductSales("May", 15800, 26500, 37540), new ProductSales("Jun", 9800, 27800, 32580), new ProductSales("Jul", 17800, 29820, 34000), new ProductSales("Aug", 19800, 17800, 38000), new ProductSales("Sep", 23200, 32000, 41300), new ProductSales("Oct", 16700, 26500, 46590), new ProductSales("Nov", 11800, 23000, 48700), new ProductSales("Dec", 13400, 15400, 49100) }; ObjectProvider objProvider = new ObjectProvider(data); chart1.getDataSourceSettings().setDataSource(objProvider); }public static class ProductSales { public ProductSales(String month, double white, double red, double sparkling) { this.setMonth(month); this.setWhite(white); this.setRed(red); this.setSparkling(sparkling); } private String privateMonth; public final String getMonth() { return privateMonth; } public final void setMonth(String value) { privateMonth = value; } private double privateWhite; public final double getWhite() { return privateWhite; } public final void setWhite(double value) { privateWhite = value; } private double privateRed; public final double getRed() { return privateRed; } public final void setRed(double value) { privateRed = value; } private double privateSparkling; public final double getSparkling() { return privateSparkling; } public final void setSparkling(double value) { privateSparkling = value; } }
- See Also:
resetRichText
-
setRichText
public void setRichText(boolean value)
Gets or sets whether or not the selected Title can be enhanced adding basic HTML markup.
When this method is set to true, the Title
setTextcan be enhanced by adding basic HTML markup.The available markup tags are:
Bold:<b>text</b>
Underline: <u>text</u>
Italic: <i>text</i>
Strike: <s>text</s>
Font: <font color="#FF0000" face="Arial">text</font>
<font> has two attributes: color, to set the color in html format (i.e. #00FF66), and face, to set the font name.
All markup tags must be closed.
Below, the chart uses a title with the word "Type" bold and underlined:
TitleDockable title;
title = new TitleDockable();
title.setText("Wine Sales by <b><u>Type</u></b>");
title.setRichText(true);
chart1.getTitles().add(title);
PopulateProductSales(chart1);
chart1.getAxisY().getLabelsFormat().setFormat(AxisFormat.CURRENCY);
public static void PopulateProductSales(Chart chart1) { ProductSales[] data = new ProductSales[]{ new ProductSales("Jan", 12560, 23400, 34500), new ProductSales("Feb", 13400, 21000, 38900), new ProductSales("Mar", 16700, 17000, 42100), new ProductSales("Apr", 12000, 19020, 43800), new ProductSales("May", 15800, 26500, 37540), new ProductSales("Jun", 9800, 27800, 32580), new ProductSales("Jul", 17800, 29820, 34000), new ProductSales("Aug", 19800, 17800, 38000), new ProductSales("Sep", 23200, 32000, 41300), new ProductSales("Oct", 16700, 26500, 46590), new ProductSales("Nov", 11800, 23000, 48700), new ProductSales("Dec", 13400, 15400, 49100) }; ObjectProvider objProvider = new ObjectProvider(data); chart1.getDataSourceSettings().setDataSource(objProvider); }public static class ProductSales { public ProductSales(String month, double white, double red, double sparkling) { this.setMonth(month); this.setWhite(white); this.setRed(red); this.setSparkling(sparkling); } private String privateMonth; public final String getMonth() { return privateMonth; } public final void setMonth(String value) { privateMonth = value; } private double privateWhite; public final double getWhite() { return privateWhite; } public final void setWhite(double value) { privateWhite = value; } private double privateRed; public final double getRed() { return privateRed; } public final void setRed(double value) { privateRed = value; } private double privateSparkling; public final double getSparkling() { return privateSparkling; } public final void setSparkling(double value) { privateSparkling = value; } }
- Parameters:
value-- See Also:
resetRichText
-
getSeparation
public int getSeparation()
Specifies the space in pixels above and below the selected title text when read from right to left.
chart1.getAxisX().getTitle().setText("Age Range");
chart1.getAxisX().getTitle().setSeparation(10);
PopulatePopulationData(chart1);
chart1.getTitles().add(new TitleDockable("Population Distribution by Gender and Age Range"));
chart1.getAxisY().getTitle().setText("Percentage");
public static void PopulatePopulationData(Chart chart1, String fieldNames) { PopulationData[] data = new PopulationData[]{ new PopulationData("0-4", 10471, 10024), new PopulationData("5-9", 9954, 9512), new PopulationData("10-14", 10670, 10167), new PopulationData("15-19", 10871, 10312), new PopulationData("20-24", 10719, 10178), new PopulationData("25-29", 10060, 9744), new PopulationData("30-34", 10021, 9864), new PopulationData("35-39", 10479, 10424), new PopulationData("40-44", 11294, 11454), new PopulationData("45-49", 11080, 11377), new PopulationData("50-54", 9772, 10212), new PopulationData("55-59", 8415, 8944), new PopulationData("60-64", 6203, 6814), new PopulationData("65-69", 4712, 5412), new PopulationData("70-74", 3804, 4697), new PopulationData("75-79", 3094, 4282), new PopulationData("80-84", 2117, 3459), new PopulationData("85-89", 1072, 2135), new PopulationData("90-94", 397, 1034), new PopulationData("95-99", 91, 321), new PopulationData("100+", 12, 58) }; ObjectProvider objProvider = new ObjectProvider(data); chart1.getDataSourceSettings().setDataSource(objProvider); if (fieldNames != "") { List<DataField> removeFields = new ArrayList<DataField>(); List<String> includeFields = Arrays.asList(fieldNames.split(",")); chart1.getDataSourceSettings().fillFromSchema(); for (DataField dataField : chart1.getDataSourceSettings().getDataFields()) { if (dataField.isMeasure() && !includeFields.contains(dataField.getDataPath())) { removeFields.add(dataField); } } for (DataField dataField : removeFields) { chart1.getDataSourceSettings().getDataFields().remove(dataField); } } } public static void PopulatePopulationData(Chart chart1) { PopulatePopulationData(chart1, ""); }public static class PopulationData { public PopulationData(String range, double male, double female) { this.setRange(range); this.setMale(male); this.setFemale(female); } private String privateRange; public final String getRange() { return privateRange; } public final void setRange(String value) { privateRange = value; } private double privateMale; public final double getMale() { return privateMale; } public final void setMale(double value) { privateMale = value; } private double privateFemale; public final double getFemale() { return privateFemale; } public final void setFemale(double value) { privateFemale = value; } }
chart1.getAxisX().getTitle().setText("Age Range");
chart1.getAxisX().getTitle().setSeparation(70);
PopulatePopulationData(chart1);
chart1.getTitles().add(new TitleDockable("Population Distribution by Gender and Age Range"));
chart1.getAxisY().getTitle().setText("Percentage");
public static void PopulatePopulationData(Chart chart1, String fieldNames) { PopulationData[] data = new PopulationData[]{ new PopulationData("0-4", 10471, 10024), new PopulationData("5-9", 9954, 9512), new PopulationData("10-14", 10670, 10167), new PopulationData("15-19", 10871, 10312), new PopulationData("20-24", 10719, 10178), new PopulationData("25-29", 10060, 9744), new PopulationData("30-34", 10021, 9864), new PopulationData("35-39", 10479, 10424), new PopulationData("40-44", 11294, 11454), new PopulationData("45-49", 11080, 11377), new PopulationData("50-54", 9772, 10212), new PopulationData("55-59", 8415, 8944), new PopulationData("60-64", 6203, 6814), new PopulationData("65-69", 4712, 5412), new PopulationData("70-74", 3804, 4697), new PopulationData("75-79", 3094, 4282), new PopulationData("80-84", 2117, 3459), new PopulationData("85-89", 1072, 2135), new PopulationData("90-94", 397, 1034), new PopulationData("95-99", 91, 321), new PopulationData("100+", 12, 58) }; ObjectProvider objProvider = new ObjectProvider(data); chart1.getDataSourceSettings().setDataSource(objProvider); if (fieldNames != "") { List<DataField> removeFields = new ArrayList<DataField>(); List<String> includeFields = Arrays.asList(fieldNames.split(",")); chart1.getDataSourceSettings().fillFromSchema(); for (DataField dataField : chart1.getDataSourceSettings().getDataFields()) { if (dataField.isMeasure() && !includeFields.contains(dataField.getDataPath())) { removeFields.add(dataField); } } for (DataField dataField : removeFields) { chart1.getDataSourceSettings().getDataFields().remove(dataField); } } } public static void PopulatePopulationData(Chart chart1) { PopulatePopulationData(chart1, ""); }public static class PopulationData { public PopulationData(String range, double male, double female) { this.setRange(range); this.setMale(male); this.setFemale(female); } private String privateRange; public final String getRange() { return privateRange; } public final void setRange(String value) { privateRange = value; } private double privateMale; public final double getMale() { return privateMale; } public final void setMale(double value) { privateMale = value; } private double privateFemale; public final double getFemale() { return privateFemale; } public final void setFemale(double value) { privateFemale = value; } }
- See Also:
resetSeparation
-
setSeparation
public void setSeparation(int value)
Specifies the space in pixels above and below the selected title text when read from right to left.
chart1.getAxisX().getTitle().setText("Age Range");
chart1.getAxisX().getTitle().setSeparation(10);
PopulatePopulationData(chart1);
chart1.getTitles().add(new TitleDockable("Population Distribution by Gender and Age Range"));
chart1.getAxisY().getTitle().setText("Percentage");
public static void PopulatePopulationData(Chart chart1, String fieldNames) { PopulationData[] data = new PopulationData[]{ new PopulationData("0-4", 10471, 10024), new PopulationData("5-9", 9954, 9512), new PopulationData("10-14", 10670, 10167), new PopulationData("15-19", 10871, 10312), new PopulationData("20-24", 10719, 10178), new PopulationData("25-29", 10060, 9744), new PopulationData("30-34", 10021, 9864), new PopulationData("35-39", 10479, 10424), new PopulationData("40-44", 11294, 11454), new PopulationData("45-49", 11080, 11377), new PopulationData("50-54", 9772, 10212), new PopulationData("55-59", 8415, 8944), new PopulationData("60-64", 6203, 6814), new PopulationData("65-69", 4712, 5412), new PopulationData("70-74", 3804, 4697), new PopulationData("75-79", 3094, 4282), new PopulationData("80-84", 2117, 3459), new PopulationData("85-89", 1072, 2135), new PopulationData("90-94", 397, 1034), new PopulationData("95-99", 91, 321), new PopulationData("100+", 12, 58) }; ObjectProvider objProvider = new ObjectProvider(data); chart1.getDataSourceSettings().setDataSource(objProvider); if (fieldNames != "") { List<DataField> removeFields = new ArrayList<DataField>(); List<String> includeFields = Arrays.asList(fieldNames.split(",")); chart1.getDataSourceSettings().fillFromSchema(); for (DataField dataField : chart1.getDataSourceSettings().getDataFields()) { if (dataField.isMeasure() && !includeFields.contains(dataField.getDataPath())) { removeFields.add(dataField); } } for (DataField dataField : removeFields) { chart1.getDataSourceSettings().getDataFields().remove(dataField); } } } public static void PopulatePopulationData(Chart chart1) { PopulatePopulationData(chart1, ""); }public static class PopulationData { public PopulationData(String range, double male, double female) { this.setRange(range); this.setMale(male); this.setFemale(female); } private String privateRange; public final String getRange() { return privateRange; } public final void setRange(String value) { privateRange = value; } private double privateMale; public final double getMale() { return privateMale; } public final void setMale(double value) { privateMale = value; } private double privateFemale; public final double getFemale() { return privateFemale; } public final void setFemale(double value) { privateFemale = value; } }
chart1.getAxisX().getTitle().setText("Age Range");
chart1.getAxisX().getTitle().setSeparation(70);
PopulatePopulationData(chart1);
chart1.getTitles().add(new TitleDockable("Population Distribution by Gender and Age Range"));
chart1.getAxisY().getTitle().setText("Percentage");
public static void PopulatePopulationData(Chart chart1, String fieldNames) { PopulationData[] data = new PopulationData[]{ new PopulationData("0-4", 10471, 10024), new PopulationData("5-9", 9954, 9512), new PopulationData("10-14", 10670, 10167), new PopulationData("15-19", 10871, 10312), new PopulationData("20-24", 10719, 10178), new PopulationData("25-29", 10060, 9744), new PopulationData("30-34", 10021, 9864), new PopulationData("35-39", 10479, 10424), new PopulationData("40-44", 11294, 11454), new PopulationData("45-49", 11080, 11377), new PopulationData("50-54", 9772, 10212), new PopulationData("55-59", 8415, 8944), new PopulationData("60-64", 6203, 6814), new PopulationData("65-69", 4712, 5412), new PopulationData("70-74", 3804, 4697), new PopulationData("75-79", 3094, 4282), new PopulationData("80-84", 2117, 3459), new PopulationData("85-89", 1072, 2135), new PopulationData("90-94", 397, 1034), new PopulationData("95-99", 91, 321), new PopulationData("100+", 12, 58) }; ObjectProvider objProvider = new ObjectProvider(data); chart1.getDataSourceSettings().setDataSource(objProvider); if (fieldNames != "") { List<DataField> removeFields = new ArrayList<DataField>(); List<String> includeFields = Arrays.asList(fieldNames.split(",")); chart1.getDataSourceSettings().fillFromSchema(); for (DataField dataField : chart1.getDataSourceSettings().getDataFields()) { if (dataField.isMeasure() && !includeFields.contains(dataField.getDataPath())) { removeFields.add(dataField); } } for (DataField dataField : removeFields) { chart1.getDataSourceSettings().getDataFields().remove(dataField); } } } public static void PopulatePopulationData(Chart chart1) { PopulatePopulationData(chart1, ""); }public static class PopulationData { public PopulationData(String range, double male, double female) { this.setRange(range); this.setMale(male); this.setFemale(female); } private String privateRange; public final String getRange() { return privateRange; } public final void setRange(String value) { privateRange = value; } private double privateMale; public final double getMale() { return privateMale; } public final void setMale(double value) { privateMale = value; } private double privateFemale; public final double getFemale() { return privateFemale; } public final void setFemale(double value) { privateFemale = value; } }
- Parameters:
value-- See Also:
resetSeparation
-
getText
public java.lang.String getText()
Gets or sets the text for the selected title.
The
setTextColormethod allows you to change the color of the specified title text.Text can be enhanced by setting the
isRichTextmethod true. Bold, Italic, Underline, Font Face and Color can be set by adding basic HTML markup to the text.Add title "3rd Quarter Sales" to the chart:
TitleDockable td;
td = new TitleDockable();
chart1.getTitles().get(0).setText("3rd Quarter Sales");
chart1.getTitles().add(td);
Add title "3rd Quarter Sales" with the word Sales bold and underlined:
TitleDockable td;
td = new TitleDockable();
td.setText("3rd Quarter <b><u>Sales</u></b>");
td.setRichText(true);
chart1.getTitles().add(td);
- See Also:
resetText
-
setText
public void setText(java.lang.String value)
Gets or sets the text for the selected title.
The
setTextColormethod allows you to change the color of the specified title text.Text can be enhanced by setting the
isRichTextmethod true. Bold, Italic, Underline, Font Face and Color can be set by adding basic HTML markup to the text.Add title "3rd Quarter Sales" to the chart:
TitleDockable td;
td = new TitleDockable();
chart1.getTitles().get(0).setText("3rd Quarter Sales");
chart1.getTitles().add(td);
Add title "3rd Quarter Sales" with the word Sales bold and underlined:
TitleDockable td;
td = new TitleDockable();
td.setText("3rd Quarter <b><u>Sales</u></b>");
td.setRichText(true);
chart1.getTitles().add(td);
- Parameters:
value-- See Also:
resetText
-
getTextColor
public java.awt.Color getTextColor()
Sets the color of text for the specified title.
The
setTextColormethod is used in conjunction with thesetTextmethod.For more information regarding the Color type, please refer to the Java Documentation.
Named colors are supported (e.g. Red), to use Hex notation you have to use quotes (e.g. "#FF00FF").
Below, the title of the chart is set to 'Wine Sales by Type' and TextColor is set to Red:
TitleDockable td;
td = new TitleDockable("Wine Sales by Type");
td.setTextColor(new java.awt.Color(255,0,0,255));
chart1.getTitles().add(td);
PopulateProductSales(chart1);
chart1.getAxisY().getLabelsFormat().setFormat(AxisFormat.CURRENCY);
public static void PopulateProductSales(Chart chart1) { ProductSales[] data = new ProductSales[]{ new ProductSales("Jan", 12560, 23400, 34500), new ProductSales("Feb", 13400, 21000, 38900), new ProductSales("Mar", 16700, 17000, 42100), new ProductSales("Apr", 12000, 19020, 43800), new ProductSales("May", 15800, 26500, 37540), new ProductSales("Jun", 9800, 27800, 32580), new ProductSales("Jul", 17800, 29820, 34000), new ProductSales("Aug", 19800, 17800, 38000), new ProductSales("Sep", 23200, 32000, 41300), new ProductSales("Oct", 16700, 26500, 46590), new ProductSales("Nov", 11800, 23000, 48700), new ProductSales("Dec", 13400, 15400, 49100) }; ObjectProvider objProvider = new ObjectProvider(data); chart1.getDataSourceSettings().setDataSource(objProvider); }public static class ProductSales { public ProductSales(String month, double white, double red, double sparkling) { this.setMonth(month); this.setWhite(white); this.setRed(red); this.setSparkling(sparkling); } private String privateMonth; public final String getMonth() { return privateMonth; } public final void setMonth(String value) { privateMonth = value; } private double privateWhite; public final double getWhite() { return privateWhite; } public final void setWhite(double value) { privateWhite = value; } private double privateRed; public final double getRed() { return privateRed; } public final void setRed(double value) { privateRed = value; } private double privateSparkling; public final double getSparkling() { return privateSparkling; } public final void setSparkling(double value) { privateSparkling = value; } }
- See Also:
resetTextColor
-
setTextColor
public void setTextColor(java.awt.Color value)
Sets the color of text for the specified title.
The
setTextColormethod is used in conjunction with thesetTextmethod.For more information regarding the Color type, please refer to the Java Documentation.
Named colors are supported (e.g. Red), to use Hex notation you have to use quotes (e.g. "#FF00FF").
Below, the title of the chart is set to 'Wine Sales by Type' and TextColor is set to Red:
TitleDockable td;
td = new TitleDockable("Wine Sales by Type");
td.setTextColor(new java.awt.Color(255,0,0,255));
chart1.getTitles().add(td);
PopulateProductSales(chart1);
chart1.getAxisY().getLabelsFormat().setFormat(AxisFormat.CURRENCY);
public static void PopulateProductSales(Chart chart1) { ProductSales[] data = new ProductSales[]{ new ProductSales("Jan", 12560, 23400, 34500), new ProductSales("Feb", 13400, 21000, 38900), new ProductSales("Mar", 16700, 17000, 42100), new ProductSales("Apr", 12000, 19020, 43800), new ProductSales("May", 15800, 26500, 37540), new ProductSales("Jun", 9800, 27800, 32580), new ProductSales("Jul", 17800, 29820, 34000), new ProductSales("Aug", 19800, 17800, 38000), new ProductSales("Sep", 23200, 32000, 41300), new ProductSales("Oct", 16700, 26500, 46590), new ProductSales("Nov", 11800, 23000, 48700), new ProductSales("Dec", 13400, 15400, 49100) }; ObjectProvider objProvider = new ObjectProvider(data); chart1.getDataSourceSettings().setDataSource(objProvider); }public static class ProductSales { public ProductSales(String month, double white, double red, double sparkling) { this.setMonth(month); this.setWhite(white); this.setRed(red); this.setSparkling(sparkling); } private String privateMonth; public final String getMonth() { return privateMonth; } public final void setMonth(String value) { privateMonth = value; } private double privateWhite; public final double getWhite() { return privateWhite; } public final void setWhite(double value) { privateWhite = value; } private double privateRed; public final double getRed() { return privateRed; } public final void setRed(double value) { privateRed = value; } private double privateSparkling; public final double getSparkling() { return privateSparkling; } public final void setSparkling(double value) { privateSparkling = value; } }
- Parameters:
value-- See Also:
resetTextColor
-
resetAdditionalFontSize
public void resetAdditionalFontSize()
Set the property AdditionalFontSize to its default value.
-
resetAlignment
public void resetAlignment()
Set the property Alignment to its default value.- See Also:
setAlignment
-
resetBackColor
public void resetBackColor()
Set the property BackColor to its default value.- See Also:
setBackColor
-
resetDock
public void resetDock()
Set the property Dock to its default value.
-
resetFlags
public void resetFlags()
Set the property Flags to its default value.
-
resetFont
public void resetFont()
Set the property Font to its default value.- See Also:
setFont
-
resetIndentation
public void resetIndentation()
Set the property Indentation to its default value.- See Also:
setIndentation
-
resetLineAlignment
public void resetLineAlignment()
Set the property LineAlignment to its default value.- See Also:
setLineAlignment
-
resetRichText
public void resetRichText()
Set the property RichText to its default value.- See Also:
isRichText
-
resetSeparation
public void resetSeparation()
Set the property Separation to its default value.- See Also:
setSeparation
-
resetText
public void resetText()
Set the property Text to its default value.- See Also:
setText
-
resetTextColor
public void resetTextColor()
Set the property TextColor to its default value.- See Also:
setTextColor
-
-