- java.lang.Object
-
- com.softwarefx.chartfx.server.PointLabelAttributes
-
public final class PointLabelAttributes
extends java.lang.Object
Provides access to the PointAttributes object, which allows you to configure how the labeling is rendered by the chart.
Unless defined otherwise, all the point labels of the chart share the same settings. Those global settings are available through the
setPointLabelsmethod of theGlobalAttributes. TheGlobalAttributesclass is accessible through thesetAllSeriesmethod of the chart.
-
-
Constructor Summary
Constructors Constructor and Description PointLabelAttributes()
-
Method Summary
Methods Modifier and Type Method and Description StringAlignmentgetAlignment()Gets or sets the vertical alignment for the point label.shortgetAngle()Gets or sets the angle of the point label.java.awt.ColorgetBackColor()Gets or sets the backgrond color of the point label.java.awt.ColorgetBorderColor()Gets or sets the border color of the point label.shortgetBorderWidth()Gets or sets a value indicating the width of the border surrounding the point label.java.awt.FontgetFont()Gets or sets a Font object to use as rendering font for the point label.java.lang.StringgetFormat()Gets or sets a string pattern mask used to format the label.StringAlignmentgetLineAlignment()Gets or sets the horizontal alignment for the point label.java.awt.PointgetOffset()Allows you to customize the point label position by configuring its coordinates.java.awt.ColorgetTextColor()Gets or sets a value for the point label color.booleanisRichText()Sets or Gets a value indicating the Text will be treated as RichTextbooleanisVisible()Gets or sets a value indicating if point label should be displayed or not.voidsetAlignment(StringAlignment value)Gets or sets the vertical alignment for the point label.voidsetAngle(short value)Gets or sets the angle of the point label.voidsetBackColor(java.awt.Color value)Gets or sets the backgrond color of the point label.voidsetBorderColor(java.awt.Color value)Gets or sets the border color of the point label.voidsetBorderWidth(short value)Gets or sets a value indicating the width of the border surrounding the point label.voidsetFont(java.awt.Font value)Gets or sets a Font object to use as rendering font for the point label.voidsetFormat(java.lang.String value)Gets or sets a string pattern mask used to format the label.voidsetLineAlignment(StringAlignment value)Gets or sets the horizontal alignment for the point label.voidsetOffset(java.awt.Point value)Allows you to customize the point label position by configuring its coordinates.voidsetRichText(boolean value)Sets or Gets a value indicating the Text will be treated as RichTextvoidsetTextColor(java.awt.Color value)Gets or sets a value for the point label color.voidsetVisible(boolean value)Gets or sets a value indicating if point label should be displayed or not.
-
-
-
Method Detail
-
getAlignment
public StringAlignment getAlignment()
Gets or sets the vertical alignment for the point label.
The possible values are Center, Far, Near.
Below, the alignment of the point labels is set to near:
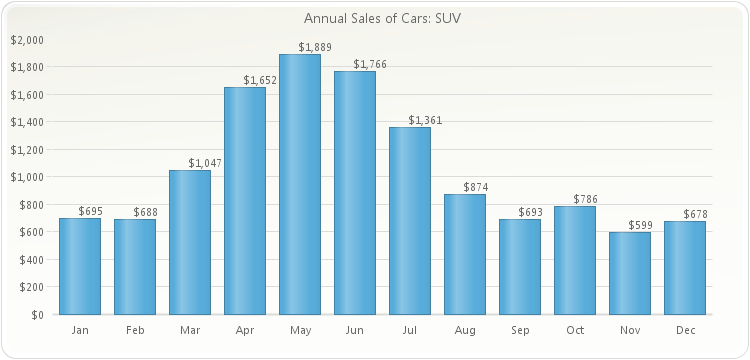
PopulateCarProduction_SUV(chart1);
chart1.getTitles().add(new TitleDockable("Annual Sales of Cars: SUV"));
chart1.getLegendBox().setVisible(false);
chart1.getAxisY().getLabelsFormat().setFormat(AxisFormat.CURRENCY);
chart1.getAxisY().getDataFormat().setFormat(AxisFormat.CURRENCY);
chart1.setGallery(Gallery.BAR);
chart1.getAllSeries().getPointLabels().setVisible(true);
chart1.getAllSeries().getPointLabels().setAlignment(StringAlignment.NEAR);
public static void PopulateCarProduction_SUV(Chart chart1) { CarProduction[] production = new CarProduction[] { new CarProduction("Jan", 1760, 535, 695 ) , new CarProduction("Feb", 1849, 395, 688 ) , new CarProduction("Mar", 2831, 685, 1047 ) , new CarProduction("Apr", 2851, 984, 1652 ) , new CarProduction("May", 2961, 1579, 1889 ) , new CarProduction("Jun", 1519, 1539, 1766 ) , new CarProduction("Jul", 2633, 1489, 1361 ) , new CarProduction("Aug", 1140, 650, 874 ) , new CarProduction("Sep", 1626, 653, 693 ) , new CarProduction("Oct", 1478, 2236, 786 ) , new CarProduction("Nov", 1306, 1937, 599 ) , new CarProduction("Dec", 1607, 2138, 678 ) }; ObjectProvider objProvider = new ObjectProvider(production); chart1.getDataSourceSettings().setDataSource(objProvider); // Since not all the fields in the DataSource are required, we must specify the number // of series that will be contained in the chart and perform the corresponding bindings chart1.getData().setSeries(1); NumericDataField numericFieldSUV = new NumericDataField(); numericFieldSUV.setDataPath("SUV"); chart1.getDataSourceSettings().getDataFields().add(numericFieldSUV); chart1.getSeries().get(0).getBindings().setY(numericFieldSUV); StringDataField stringField = new StringDataField(); stringField.setDataPath("Month"); chart1.getDataSourceSettings().getDataFields().add(stringField); chart1.getAxisX().getBindings().setLabel(stringField); }public static void PopulateCarProduction(Chart chart1) { CarProduction[] production = new CarProduction[] { new CarProduction("Jan", 1760, 535, 695 ) , new CarProduction("Feb", 1849, 395, 688 ) , new CarProduction("Mar", 2831, 685, 1047 ) , new CarProduction("Apr", 2851, 984, 1652 ) , new CarProduction("May", 2961, 1579, 1889 ) , new CarProduction("Jun", 1519, 1539, 1766 ) , new CarProduction("Jul", 2633, 1489, 1361 ) , new CarProduction("Aug", 1140, 650, 874 ) , new CarProduction("Sep", 1626, 653, 693 ) , new CarProduction("Oct", 1478, 2236, 786 ) , new CarProduction("Nov", 1306, 1937, 599 ) , new CarProduction("Dec", 1607, 2138, 678 ) }; ObjectProvider objProvider = new ObjectProvider(production); chart1.getDataSourceSettings().setDataSource(objProvider); }public static class CarProduction { private CarProduction(String month, int sedan, int coupe, int SUV) { this.setMonth(month); this.setSedan(sedan); this.setCoupe(coupe); this.setSUV(SUV); } private String privateMonth; public final String getMonth() { return privateMonth; } public final void setMonth(String value) { privateMonth = value; } private int privateSedan; public final int getSedan() { return privateSedan; } public final void setSedan(int value) { privateSedan = value; } private int privateCoupe; public final int getCoupe() { return privateCoupe; } public final void setCoupe(int value) { privateCoupe = value; } private int privateSUV; public final int getSUV() { return privateSUV; } public final void setSUV(int value) { privateSUV = value; } }
-
setAlignment
public void setAlignment(StringAlignment value)
Gets or sets the vertical alignment for the point label.
The possible values are Center, Far, Near.
Below, the alignment of the point labels is set to near:
PopulateCarProduction_SUV(chart1);
chart1.getTitles().add(new TitleDockable("Annual Sales of Cars: SUV"));
chart1.getLegendBox().setVisible(false);
chart1.getAxisY().getLabelsFormat().setFormat(AxisFormat.CURRENCY);
chart1.getAxisY().getDataFormat().setFormat(AxisFormat.CURRENCY);
chart1.setGallery(Gallery.BAR);
chart1.getAllSeries().getPointLabels().setVisible(true);
chart1.getAllSeries().getPointLabels().setAlignment(StringAlignment.NEAR);
public static void PopulateCarProduction_SUV(Chart chart1) { CarProduction[] production = new CarProduction[] { new CarProduction("Jan", 1760, 535, 695 ) , new CarProduction("Feb", 1849, 395, 688 ) , new CarProduction("Mar", 2831, 685, 1047 ) , new CarProduction("Apr", 2851, 984, 1652 ) , new CarProduction("May", 2961, 1579, 1889 ) , new CarProduction("Jun", 1519, 1539, 1766 ) , new CarProduction("Jul", 2633, 1489, 1361 ) , new CarProduction("Aug", 1140, 650, 874 ) , new CarProduction("Sep", 1626, 653, 693 ) , new CarProduction("Oct", 1478, 2236, 786 ) , new CarProduction("Nov", 1306, 1937, 599 ) , new CarProduction("Dec", 1607, 2138, 678 ) }; ObjectProvider objProvider = new ObjectProvider(production); chart1.getDataSourceSettings().setDataSource(objProvider); // Since not all the fields in the DataSource are required, we must specify the number // of series that will be contained in the chart and perform the corresponding bindings chart1.getData().setSeries(1); NumericDataField numericFieldSUV = new NumericDataField(); numericFieldSUV.setDataPath("SUV"); chart1.getDataSourceSettings().getDataFields().add(numericFieldSUV); chart1.getSeries().get(0).getBindings().setY(numericFieldSUV); StringDataField stringField = new StringDataField(); stringField.setDataPath("Month"); chart1.getDataSourceSettings().getDataFields().add(stringField); chart1.getAxisX().getBindings().setLabel(stringField); }public static void PopulateCarProduction(Chart chart1) { CarProduction[] production = new CarProduction[] { new CarProduction("Jan", 1760, 535, 695 ) , new CarProduction("Feb", 1849, 395, 688 ) , new CarProduction("Mar", 2831, 685, 1047 ) , new CarProduction("Apr", 2851, 984, 1652 ) , new CarProduction("May", 2961, 1579, 1889 ) , new CarProduction("Jun", 1519, 1539, 1766 ) , new CarProduction("Jul", 2633, 1489, 1361 ) , new CarProduction("Aug", 1140, 650, 874 ) , new CarProduction("Sep", 1626, 653, 693 ) , new CarProduction("Oct", 1478, 2236, 786 ) , new CarProduction("Nov", 1306, 1937, 599 ) , new CarProduction("Dec", 1607, 2138, 678 ) }; ObjectProvider objProvider = new ObjectProvider(production); chart1.getDataSourceSettings().setDataSource(objProvider); }public static class CarProduction { private CarProduction(String month, int sedan, int coupe, int SUV) { this.setMonth(month); this.setSedan(sedan); this.setCoupe(coupe); this.setSUV(SUV); } private String privateMonth; public final String getMonth() { return privateMonth; } public final void setMonth(String value) { privateMonth = value; } private int privateSedan; public final int getSedan() { return privateSedan; } public final void setSedan(int value) { privateSedan = value; } private int privateCoupe; public final int getCoupe() { return privateCoupe; } public final void setCoupe(int value) { privateCoupe = value; } private int privateSUV; public final int getSUV() { return privateSUV; } public final void setSUV(int value) { privateSUV = value; } }
- Parameters:
value-
-
getAngle
public short getAngle()
Gets or sets the angle of the point label.
The default rotation angle is 0 degree (i.e., horizontal). Use a positive number to rotate the labels from lower left to upper right. Use negative degrees to rotate text from upper left to lower right.
In order to set this method, the font type associated with the axis needs to be a True Type Font.
This method is also available in the
SeriesAttributesorPointAttributesobjects. Therefore, a label angle can be set to a specific series or point instead ofsetAllSeriesin the chart.To use this method, you must make sure the
setPointLabelsareisVisible.Below, the angle of the point labels is set to 45:
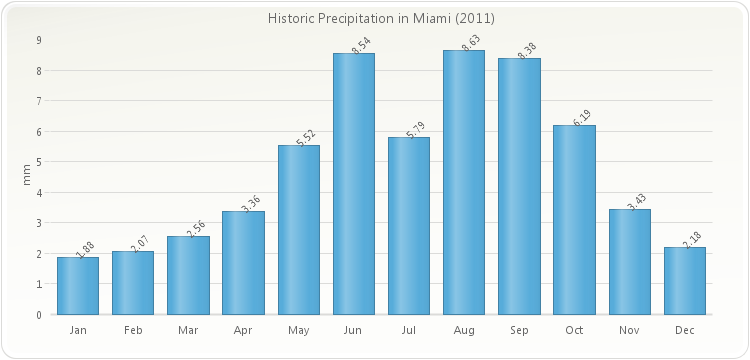
PopulateMiamiClimate(chart1, "Precipitation");
chart1.setGallery(Gallery.BAR);
chart1.getLegendBox().setVisible(false);
chart1.getTitles().add(new TitleDockable("Historic Precipitation in Miami (2011)"));
chart1.getAxisY().getTitle().setText("mm");
chart1.getAxisY().getDataFormat().setDecimals(2);
chart1.getAllSeries().getPointLabels().setLineAlignment(StringAlignment.CENTER);
chart1.getAllSeries().getPointLabels().setAlignment(StringAlignment.NEAR);
chart1.getAllSeries().getPointLabels().setVisible(true);
chart1.getAllSeries().getPointLabels().setAngle((short)45);
public static void PopulateMiamiClimate(Chart chart1, String fieldNames) { MiamiClimate[] data = new MiamiClimate[] { new MiamiClimate("Jan", 59.6, 76.5, 67.2, 1.88, 9.5, 59 ), new MiamiClimate("Feb", 60.5, 77.7, 68.5, 2.07, 10.1, 71 ), new MiamiClimate("Mar", 64, 80.7, 71.7, 2.56, 10.5, 69.5 ), new MiamiClimate("Apr", 67.6, 83.8, 75.2, 3.36, 10.5, 67.5 ), new MiamiClimate("May", 72, 87.2, 78.7, 5.52, 9.5, 67 ), new MiamiClimate("Jun", 75.2, 89.5, 81.4, 8.54, 8.3, 71 ), new MiamiClimate("Jul", 76.5, 90.9, 82.6, 5.79, 7.9, 74 ), new MiamiClimate("Aug", 76.5, 90.6, 82.8, 8.63, 7.9, 74 ), new MiamiClimate("Sep", 75.7, 89, 81.9, 8.38, 8.2, 76 ), new MiamiClimate("Oct", 72.2, 85.4, 78.3, 6.19, 9.2, 76 ), new MiamiClimate("Nov", 67.5, 81.2, 73.6, 3.43, 9.7, 74 ), new MiamiClimate("Dec", 62.2, 77.5, 69.1, 2.18, 9.2, 73 ) }; ObjectProvider objProvider = new ObjectProvider(data); chart1.getDataSourceSettings().setDataSource(objProvider); if (fieldNames != ""){ List<DataField> removeFields = new ArrayList<DataField>(); List<String> includeFields = Arrays.asList(fieldNames.split(",")); chart1.getDataSourceSettings().fillFromSchema(); for (DataField dataField : chart1.getDataSourceSettings().getDataFields()) { if (dataField.isMeasure() && !includeFields.contains(dataField.getDataPath())) { removeFields.add(dataField); } } for (DataField dataField : removeFields) { chart1.getDataSourceSettings().getDataFields().remove(dataField); } } } public static void PopulateMiamiClimate(Chart chart1) { PopulateMiamiClimate(chart1, ""); }public static class MiamiClimate { public MiamiClimate(String Month, double low, double high, double average, double precipitation, double windSpeed, double relativeHumidity) { this.setMonth(Month); this.setLow(low); this.setHigh(high); this.setAverage(average); this.setPrecipitation(precipitation); this.setWindSpeed(windSpeed); this.setRelativeHumidity(relativeHumidity); } private String privateMonth; public final String getMonth() { return privateMonth; } public final void setMonth(String value) { privateMonth = value; } private double privateLow; public final double getLow() { return privateLow; } public final void setLow(double value) { privateLow = value; } private double privateHigh; public final double getHigh() { return privateHigh; } public final void setHigh(double value) { privateHigh = value; } private double privateAverage; public final double getAverage() { return privateAverage; } public final void setAverage(double value) { privateAverage = value; } private double privatePrecipitation; public final double getPrecipitation() { return privatePrecipitation; } public final void setPrecipitation(double value) { privatePrecipitation = value; } private double privateWindSpeed; public final double getWindSpeed() { return privateWindSpeed; } public final void setWindSpeed(double value) { privateWindSpeed = value; } private double privateRelativeHumidity; public final double getRelativeHumidity() { return privateRelativeHumidity; } public final void setRelativeHumidity(double value) { privateRelativeHumidity = value; } }
-
setAngle
public void setAngle(short value)
Gets or sets the angle of the point label.
The default rotation angle is 0 degree (i.e., horizontal). Use a positive number to rotate the labels from lower left to upper right. Use negative degrees to rotate text from upper left to lower right.
In order to set this method, the font type associated with the axis needs to be a True Type Font.
This method is also available in the
SeriesAttributesorPointAttributesobjects. Therefore, a label angle can be set to a specific series or point instead ofsetAllSeriesin the chart.To use this method, you must make sure the
setPointLabelsareisVisible.Below, the angle of the point labels is set to 45:
PopulateMiamiClimate(chart1, "Precipitation");
chart1.setGallery(Gallery.BAR);
chart1.getLegendBox().setVisible(false);
chart1.getTitles().add(new TitleDockable("Historic Precipitation in Miami (2011)"));
chart1.getAxisY().getTitle().setText("mm");
chart1.getAxisY().getDataFormat().setDecimals(2);
chart1.getAllSeries().getPointLabels().setLineAlignment(StringAlignment.CENTER);
chart1.getAllSeries().getPointLabels().setAlignment(StringAlignment.NEAR);
chart1.getAllSeries().getPointLabels().setVisible(true);
chart1.getAllSeries().getPointLabels().setAngle((short)45);
public static void PopulateMiamiClimate(Chart chart1, String fieldNames) { MiamiClimate[] data = new MiamiClimate[] { new MiamiClimate("Jan", 59.6, 76.5, 67.2, 1.88, 9.5, 59 ), new MiamiClimate("Feb", 60.5, 77.7, 68.5, 2.07, 10.1, 71 ), new MiamiClimate("Mar", 64, 80.7, 71.7, 2.56, 10.5, 69.5 ), new MiamiClimate("Apr", 67.6, 83.8, 75.2, 3.36, 10.5, 67.5 ), new MiamiClimate("May", 72, 87.2, 78.7, 5.52, 9.5, 67 ), new MiamiClimate("Jun", 75.2, 89.5, 81.4, 8.54, 8.3, 71 ), new MiamiClimate("Jul", 76.5, 90.9, 82.6, 5.79, 7.9, 74 ), new MiamiClimate("Aug", 76.5, 90.6, 82.8, 8.63, 7.9, 74 ), new MiamiClimate("Sep", 75.7, 89, 81.9, 8.38, 8.2, 76 ), new MiamiClimate("Oct", 72.2, 85.4, 78.3, 6.19, 9.2, 76 ), new MiamiClimate("Nov", 67.5, 81.2, 73.6, 3.43, 9.7, 74 ), new MiamiClimate("Dec", 62.2, 77.5, 69.1, 2.18, 9.2, 73 ) }; ObjectProvider objProvider = new ObjectProvider(data); chart1.getDataSourceSettings().setDataSource(objProvider); if (fieldNames != ""){ List<DataField> removeFields = new ArrayList<DataField>(); List<String> includeFields = Arrays.asList(fieldNames.split(",")); chart1.getDataSourceSettings().fillFromSchema(); for (DataField dataField : chart1.getDataSourceSettings().getDataFields()) { if (dataField.isMeasure() && !includeFields.contains(dataField.getDataPath())) { removeFields.add(dataField); } } for (DataField dataField : removeFields) { chart1.getDataSourceSettings().getDataFields().remove(dataField); } } } public static void PopulateMiamiClimate(Chart chart1) { PopulateMiamiClimate(chart1, ""); }public static class MiamiClimate { public MiamiClimate(String Month, double low, double high, double average, double precipitation, double windSpeed, double relativeHumidity) { this.setMonth(Month); this.setLow(low); this.setHigh(high); this.setAverage(average); this.setPrecipitation(precipitation); this.setWindSpeed(windSpeed); this.setRelativeHumidity(relativeHumidity); } private String privateMonth; public final String getMonth() { return privateMonth; } public final void setMonth(String value) { privateMonth = value; } private double privateLow; public final double getLow() { return privateLow; } public final void setLow(double value) { privateLow = value; } private double privateHigh; public final double getHigh() { return privateHigh; } public final void setHigh(double value) { privateHigh = value; } private double privateAverage; public final double getAverage() { return privateAverage; } public final void setAverage(double value) { privateAverage = value; } private double privatePrecipitation; public final double getPrecipitation() { return privatePrecipitation; } public final void setPrecipitation(double value) { privatePrecipitation = value; } private double privateWindSpeed; public final double getWindSpeed() { return privateWindSpeed; } public final void setWindSpeed(double value) { privateWindSpeed = value; } private double privateRelativeHumidity; public final double getRelativeHumidity() { return privateRelativeHumidity; } public final void setRelativeHumidity(double value) { privateRelativeHumidity = value; } }
- Parameters:
value-
-
getBackColor
public java.awt.Color getBackColor()
Gets or sets the backgrond color of the point label.
The
setPointLabelsmethod of thePointAttributesclass returns a PointLabelsAttributes object.The
setBorderColormethod gets or sets the border color of the point label.The
setBorderWidthmethod gets or sets a value indicating the width of the border surrounding the point label.The
isVisiblemethod is a boolean indicating if point label should be displayed or not.For more information regarding the Color type, please refer to your documentation.
Named color are supported (e.g. Red), to use Hex notation you have to use quotes (e.g. "#FF00FF").
Below, the Back color of the point labels is set to yellow:
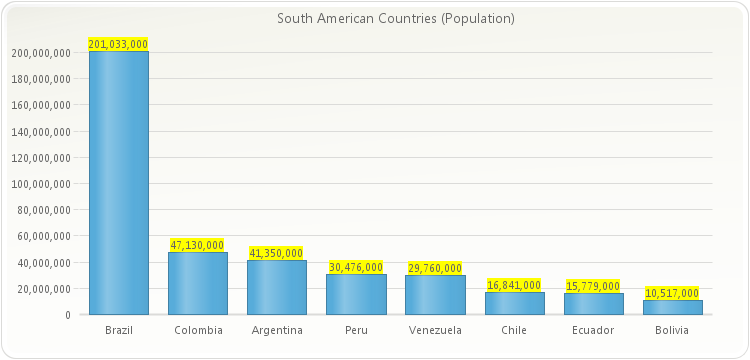
PopulateSouthAmericaPopulation(chart1);
chart1.getTitles().add(new TitleDockable("South American Countries (Population)"));
chart1.getLegendBox().setVisible(false);
chart1.setGallery(Gallery.BAR);
chart1.getAxisY().getLabelsFormat().setFormat(AxisFormat.NUMBER);
chart1.getAxisY().getDataFormat().setFormat(AxisFormat.NUMBER);
chart1.getAllSeries().getPointLabels().setVisible(true);
chart1.getAllSeries().getPointLabels().setBackColor(new java.awt.Color(255,255,0,255));
public static void PopulateSouthAmericaPopulation(Chart chart1) { SouthAmericaPopulation[] data = new SouthAmericaPopulation[]{ new SouthAmericaPopulation("Brazil", 201033000), new SouthAmericaPopulation("Colombia", 47130000), new SouthAmericaPopulation("Argentina", 41350000), new SouthAmericaPopulation("Peru", 30476000), new SouthAmericaPopulation("Venezuela", 29760000), new SouthAmericaPopulation("Chile", 16841000), new SouthAmericaPopulation("Ecuador", 15779000), new SouthAmericaPopulation("Bolivia", 10517000) }; ObjectProvider objProvider = new ObjectProvider(data); chart1.getDataSourceSettings().setDataSource(objProvider); }public static class SouthAmericaPopulation { public SouthAmericaPopulation(String country, double population) { this.setCountry(country); this.setPopulation(population); } private String privateCountry; public final String getCountry() { return privateCountry; } public final void setCountry(String value) { privateCountry = value; } private double privatePopulation; public final double getPopulation() { return privatePopulation; } public final void setPopulation(double value) { privatePopulation = value; } }public static class Countries { public Countries(String country, double lei, double gdppc, java.awt.Image flag) { this.setCountry(country); this.setLEI(lei); this.setGDPPC(gdppc); this.setFlag(flag); } private String privateCountry; public final String getCountry() { return privateCountry; } public final void setCountry(String value) { privateCountry = value; } private double privateLEI; public final double getLEI() { return privateLEI; } public final void setLEI(double value) { privateLEI = value; } private double privateGDPPC; public final double getGDPPC() { return privateGDPPC; } public final void setGDPPC(double value) { privateGDPPC = value; } private java.awt.Image privateFlag; public final java.awt.Image getFlag() { return privateFlag; } public final void setFlag(java.awt.Image value) { privateFlag = value; } }
-
setBackColor
public void setBackColor(java.awt.Color value)
Gets or sets the backgrond color of the point label.
The
setPointLabelsmethod of thePointAttributesclass returns a PointLabelsAttributes object.The
setBorderColormethod gets or sets the border color of the point label.The
setBorderWidthmethod gets or sets a value indicating the width of the border surrounding the point label.The
isVisiblemethod is a boolean indicating if point label should be displayed or not.For more information regarding the Color type, please refer to your documentation.
Named color are supported (e.g. Red), to use Hex notation you have to use quotes (e.g. "#FF00FF").
Below, the Back color of the point labels is set to yellow:
PopulateSouthAmericaPopulation(chart1);
chart1.getTitles().add(new TitleDockable("South American Countries (Population)"));
chart1.getLegendBox().setVisible(false);
chart1.setGallery(Gallery.BAR);
chart1.getAxisY().getLabelsFormat().setFormat(AxisFormat.NUMBER);
chart1.getAxisY().getDataFormat().setFormat(AxisFormat.NUMBER);
chart1.getAllSeries().getPointLabels().setVisible(true);
chart1.getAllSeries().getPointLabels().setBackColor(new java.awt.Color(255,255,0,255));
public static void PopulateSouthAmericaPopulation(Chart chart1) { SouthAmericaPopulation[] data = new SouthAmericaPopulation[]{ new SouthAmericaPopulation("Brazil", 201033000), new SouthAmericaPopulation("Colombia", 47130000), new SouthAmericaPopulation("Argentina", 41350000), new SouthAmericaPopulation("Peru", 30476000), new SouthAmericaPopulation("Venezuela", 29760000), new SouthAmericaPopulation("Chile", 16841000), new SouthAmericaPopulation("Ecuador", 15779000), new SouthAmericaPopulation("Bolivia", 10517000) }; ObjectProvider objProvider = new ObjectProvider(data); chart1.getDataSourceSettings().setDataSource(objProvider); }public static class SouthAmericaPopulation { public SouthAmericaPopulation(String country, double population) { this.setCountry(country); this.setPopulation(population); } private String privateCountry; public final String getCountry() { return privateCountry; } public final void setCountry(String value) { privateCountry = value; } private double privatePopulation; public final double getPopulation() { return privatePopulation; } public final void setPopulation(double value) { privatePopulation = value; } }public static class Countries { public Countries(String country, double lei, double gdppc, java.awt.Image flag) { this.setCountry(country); this.setLEI(lei); this.setGDPPC(gdppc); this.setFlag(flag); } private String privateCountry; public final String getCountry() { return privateCountry; } public final void setCountry(String value) { privateCountry = value; } private double privateLEI; public final double getLEI() { return privateLEI; } public final void setLEI(double value) { privateLEI = value; } private double privateGDPPC; public final double getGDPPC() { return privateGDPPC; } public final void setGDPPC(double value) { privateGDPPC = value; } private java.awt.Image privateFlag; public final java.awt.Image getFlag() { return privateFlag; } public final void setFlag(java.awt.Image value) { privateFlag = value; } }
- Parameters:
value-
-
getBorderColor
public java.awt.Color getBorderColor()
Gets or sets the border color of the point label.chart1.getAllSeries().getPointLabels().setBorderColor(new java.awt.Color(255,0,0,255));
-
setBorderColor
public void setBorderColor(java.awt.Color value)
Gets or sets the border color of the point label.chart1.getAllSeries().getPointLabels().setBorderColor(new java.awt.Color(255,0,0,255));
- Parameters:
value-
-
getBorderWidth
public short getBorderWidth()
Gets or sets a value indicating the width of the border surrounding the point label.chart1.getAllSeries().getPointLabels().setBorderWidth(2);
-
setBorderWidth
public void setBorderWidth(short value)
Gets or sets a value indicating the width of the border surrounding the point label.chart1.getAllSeries().getPointLabels().setBorderWidth(2);
- Parameters:
value-
-
getFont
public java.awt.Font getFont()
Gets or sets a Font object to use as rendering font for the point label.
When setting a font, you must create a new font object with the desired attributes and assign that object to the desired chart element every time.
See the Font class in Java documentation.
Below, the font of the point labels is set to Arial 12:
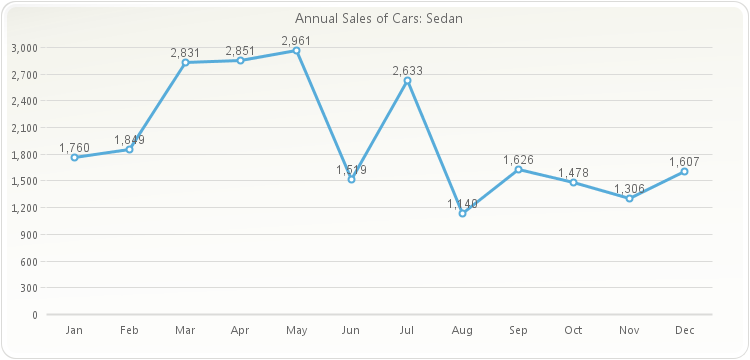
PopulateCarProduction_Sedan(chart1);
chart1.getTitles().add(new TitleDockable("Annual Sales of Cars: Sedan"));
chart1.getLegendBox().setVisible(false);
chart1.getAxisY().getLabelsFormat().setFormat(AxisFormat.NUMBER);
chart1.getAxisY().getDataFormat().setFormat(AxisFormat.NUMBER);
chart1.getAllSeries().getPointLabels().setVisible(true);
chart1.getAllSeries().getPointLabels().setFont(new java.awt.Font("Arial",java.awt.Font.PLAIN, 12));
public static void PopulateCarProduction_Sedan(Chart chart1) { CarProduction[] production = new CarProduction[] { new CarProduction("Jan", 1760, 535, 695 ) , new CarProduction("Feb", 1849, 395, 688 ) , new CarProduction("Mar", 2831, 685, 1047 ) , new CarProduction("Apr", 2851, 984, 1652 ) , new CarProduction("May", 2961, 1579, 1889 ) , new CarProduction("Jun", 1519, 1539, 1766 ) , new CarProduction("Jul", 2633, 1489, 1361 ) , new CarProduction("Aug", 1140, 650, 874 ) , new CarProduction("Sep", 1626, 653, 693 ) , new CarProduction("Oct", 1478, 2236, 786 ) , new CarProduction("Nov", 1306, 1937, 599 ) , new CarProduction("Dec", 1607, 2138, 678 ) }; ObjectProvider objProvider = new ObjectProvider(production); chart1.getDataSourceSettings().setDataSource(objProvider); // Since not all the fields in the DataSource are required, we must specify the number // of series that will be contained in the chart and perform the corresponding bindings chart1.getData().setSeries(1); NumericDataField numericFieldSedan = new NumericDataField(); numericFieldSedan.setDataPath("Sedan"); chart1.getDataSourceSettings().getDataFields().add(numericFieldSedan); chart1.getSeries().get(0).getBindings().setY(numericFieldSedan); StringDataField stringField = new StringDataField(); stringField.setDataPath("Month"); chart1.getDataSourceSettings().getDataFields().add(stringField); chart1.getAxisX().getBindings().setLabel(stringField); }public static void PopulateCarProduction(Chart chart1) { CarProduction[] production = new CarProduction[] { new CarProduction("Jan", 1760, 535, 695 ) , new CarProduction("Feb", 1849, 395, 688 ) , new CarProduction("Mar", 2831, 685, 1047 ) , new CarProduction("Apr", 2851, 984, 1652 ) , new CarProduction("May", 2961, 1579, 1889 ) , new CarProduction("Jun", 1519, 1539, 1766 ) , new CarProduction("Jul", 2633, 1489, 1361 ) , new CarProduction("Aug", 1140, 650, 874 ) , new CarProduction("Sep", 1626, 653, 693 ) , new CarProduction("Oct", 1478, 2236, 786 ) , new CarProduction("Nov", 1306, 1937, 599 ) , new CarProduction("Dec", 1607, 2138, 678 ) }; ObjectProvider objProvider = new ObjectProvider(production); chart1.getDataSourceSettings().setDataSource(objProvider); }public static class CarProduction { private CarProduction(String month, int sedan, int coupe, int SUV) { this.setMonth(month); this.setSedan(sedan); this.setCoupe(coupe); this.setSUV(SUV); } private String privateMonth; public final String getMonth() { return privateMonth; } public final void setMonth(String value) { privateMonth = value; } private int privateSedan; public final int getSedan() { return privateSedan; } public final void setSedan(int value) { privateSedan = value; } private int privateCoupe; public final int getCoupe() { return privateCoupe; } public final void setCoupe(int value) { privateCoupe = value; } private int privateSUV; public final int getSUV() { return privateSUV; } public final void setSUV(int value) { privateSUV = value; } }
-
setFont
public void setFont(java.awt.Font value)
Gets or sets a Font object to use as rendering font for the point label.
When setting a font, you must create a new font object with the desired attributes and assign that object to the desired chart element every time.
See the Font class in Java documentation.
Below, the font of the point labels is set to Arial 12:
PopulateCarProduction_Sedan(chart1);
chart1.getTitles().add(new TitleDockable("Annual Sales of Cars: Sedan"));
chart1.getLegendBox().setVisible(false);
chart1.getAxisY().getLabelsFormat().setFormat(AxisFormat.NUMBER);
chart1.getAxisY().getDataFormat().setFormat(AxisFormat.NUMBER);
chart1.getAllSeries().getPointLabels().setVisible(true);
chart1.getAllSeries().getPointLabels().setFont(new java.awt.Font("Arial",java.awt.Font.PLAIN, 12));
public static void PopulateCarProduction_Sedan(Chart chart1) { CarProduction[] production = new CarProduction[] { new CarProduction("Jan", 1760, 535, 695 ) , new CarProduction("Feb", 1849, 395, 688 ) , new CarProduction("Mar", 2831, 685, 1047 ) , new CarProduction("Apr", 2851, 984, 1652 ) , new CarProduction("May", 2961, 1579, 1889 ) , new CarProduction("Jun", 1519, 1539, 1766 ) , new CarProduction("Jul", 2633, 1489, 1361 ) , new CarProduction("Aug", 1140, 650, 874 ) , new CarProduction("Sep", 1626, 653, 693 ) , new CarProduction("Oct", 1478, 2236, 786 ) , new CarProduction("Nov", 1306, 1937, 599 ) , new CarProduction("Dec", 1607, 2138, 678 ) }; ObjectProvider objProvider = new ObjectProvider(production); chart1.getDataSourceSettings().setDataSource(objProvider); // Since not all the fields in the DataSource are required, we must specify the number // of series that will be contained in the chart and perform the corresponding bindings chart1.getData().setSeries(1); NumericDataField numericFieldSedan = new NumericDataField(); numericFieldSedan.setDataPath("Sedan"); chart1.getDataSourceSettings().getDataFields().add(numericFieldSedan); chart1.getSeries().get(0).getBindings().setY(numericFieldSedan); StringDataField stringField = new StringDataField(); stringField.setDataPath("Month"); chart1.getDataSourceSettings().getDataFields().add(stringField); chart1.getAxisX().getBindings().setLabel(stringField); }public static void PopulateCarProduction(Chart chart1) { CarProduction[] production = new CarProduction[] { new CarProduction("Jan", 1760, 535, 695 ) , new CarProduction("Feb", 1849, 395, 688 ) , new CarProduction("Mar", 2831, 685, 1047 ) , new CarProduction("Apr", 2851, 984, 1652 ) , new CarProduction("May", 2961, 1579, 1889 ) , new CarProduction("Jun", 1519, 1539, 1766 ) , new CarProduction("Jul", 2633, 1489, 1361 ) , new CarProduction("Aug", 1140, 650, 874 ) , new CarProduction("Sep", 1626, 653, 693 ) , new CarProduction("Oct", 1478, 2236, 786 ) , new CarProduction("Nov", 1306, 1937, 599 ) , new CarProduction("Dec", 1607, 2138, 678 ) }; ObjectProvider objProvider = new ObjectProvider(production); chart1.getDataSourceSettings().setDataSource(objProvider); }public static class CarProduction { private CarProduction(String month, int sedan, int coupe, int SUV) { this.setMonth(month); this.setSedan(sedan); this.setCoupe(coupe); this.setSUV(SUV); } private String privateMonth; public final String getMonth() { return privateMonth; } public final void setMonth(String value) { privateMonth = value; } private int privateSedan; public final int getSedan() { return privateSedan; } public final void setSedan(int value) { privateSedan = value; } private int privateCoupe; public final int getCoupe() { return privateCoupe; } public final void setCoupe(int value) { privateCoupe = value; } private int privateSUV; public final int getSUV() { return privateSUV; } public final void setSUV(int value) { privateSUV = value; } }
- Parameters:
value-
-
getFormat
public java.lang.String getFormat()
Gets or sets a string pattern mask used to format the label.
Below, a table with the available keywords:
Keyword Description {Label}
{l}
%lShows the X-Axis legend. {KeyLabel}
{k}
%kShows the X-Axis Key legend. {SeriesText}
{s}
%sShows the series name, as displayed in the LegendBox. {SeriesIndex}
{S}
%SShows the index for the series. {X}
{x}
%xShows the XValue (XY charts, when they were set with X-Values) {YFrom}
{i}
%iShows the initial value on a Gantt chart. {Y}
{v}
%vShows the value of the point. {SeriesTotal}
{t}
%tShows the series total (sum of all points in the series). {SeriesPercentage}
{p}
%pPercentage that the point represents out of the total {PointTotal}
{T}
%TShows the point total (sum of the point in all series) {PointPercentage}
{P}
%PPercentage that the point represents among the same point in all series (useful in stacked charts) {PointIndex}
{N}
%NShows the index for the point. {PointText}
{L}
%LShows the Text property of the Point object. {Field:FieldName} Shows the value of the specified DataField in the selected point. To use the PointLabel Format method:
chart1.getAllSeries().getPointLabels().setFormat("I\'m point # %N");
-
setFormat
public void setFormat(java.lang.String value)
Gets or sets a string pattern mask used to format the label.
Below, a table with the available keywords:
Keyword Description {Label}
{l}
%lShows the X-Axis legend. {KeyLabel}
{k}
%kShows the X-Axis Key legend. {SeriesText}
{s}
%sShows the series name, as displayed in the LegendBox. {SeriesIndex}
{S}
%SShows the index for the series. {X}
{x}
%xShows the XValue (XY charts, when they were set with X-Values) {YFrom}
{i}
%iShows the initial value on a Gantt chart. {Y}
{v}
%vShows the value of the point. {SeriesTotal}
{t}
%tShows the series total (sum of all points in the series). {SeriesPercentage}
{p}
%pPercentage that the point represents out of the total {PointTotal}
{T}
%TShows the point total (sum of the point in all series) {PointPercentage}
{P}
%PPercentage that the point represents among the same point in all series (useful in stacked charts) {PointIndex}
{N}
%NShows the index for the point. {PointText}
{L}
%LShows the Text property of the Point object. {Field:FieldName} Shows the value of the specified DataField in the selected point. To use the PointLabel Format method:
chart1.getAllSeries().getPointLabels().setFormat("I\'m point # %N");
- Parameters:
value-
-
getLineAlignment
public StringAlignment getLineAlignment()
Gets or sets the horizontal alignment for the point label.
For more information on StringAlignment see the Java documentation.
The possible values are Center, Far, Near.
Below, the three line alignments are exemplified.
PopulateCarProduction(chart1);
chart1.getTitles().add(new TitleDockable("Annual Sales of Cars: SUV"));
chart1.setGallery(Gallery.BAR);
chart1.getData().setSeries(3);
chart1.getAxisX().setScrollView(0, 2);
chart1.getAllSeries().getPointLabels().setVisible(true);
chart1.getSeries().get(0).getPointLabels().setLineAlignment(StringAlignment.CENTER);
chart1.getSeries().get(1).getPointLabels().setLineAlignment(StringAlignment.FAR);
chart1.getSeries().get(2).getPointLabels().setLineAlignment(StringAlignment.NEAR);
public static void PopulateCarProduction(Chart chart1) { CarProduction[] production = new CarProduction[] { new CarProduction("Jan", 1760, 535, 695 ) , new CarProduction("Feb", 1849, 395, 688 ) , new CarProduction("Mar", 2831, 685, 1047 ) , new CarProduction("Apr", 2851, 984, 1652 ) , new CarProduction("May", 2961, 1579, 1889 ) , new CarProduction("Jun", 1519, 1539, 1766 ) , new CarProduction("Jul", 2633, 1489, 1361 ) , new CarProduction("Aug", 1140, 650, 874 ) , new CarProduction("Sep", 1626, 653, 693 ) , new CarProduction("Oct", 1478, 2236, 786 ) , new CarProduction("Nov", 1306, 1937, 599 ) , new CarProduction("Dec", 1607, 2138, 678 ) }; ObjectProvider objProvider = new ObjectProvider(production); chart1.getDataSourceSettings().setDataSource(objProvider); }public static class CarProduction { private CarProduction(String month, int sedan, int coupe, int SUV) { this.setMonth(month); this.setSedan(sedan); this.setCoupe(coupe); this.setSUV(SUV); } private String privateMonth; public final String getMonth() { return privateMonth; } public final void setMonth(String value) { privateMonth = value; } private int privateSedan; public final int getSedan() { return privateSedan; } public final void setSedan(int value) { privateSedan = value; } private int privateCoupe; public final int getCoupe() { return privateCoupe; } public final void setCoupe(int value) { privateCoupe = value; } private int privateSUV; public final int getSUV() { return privateSUV; } public final void setSUV(int value) { privateSUV = value; } }
-
setLineAlignment
public void setLineAlignment(StringAlignment value)
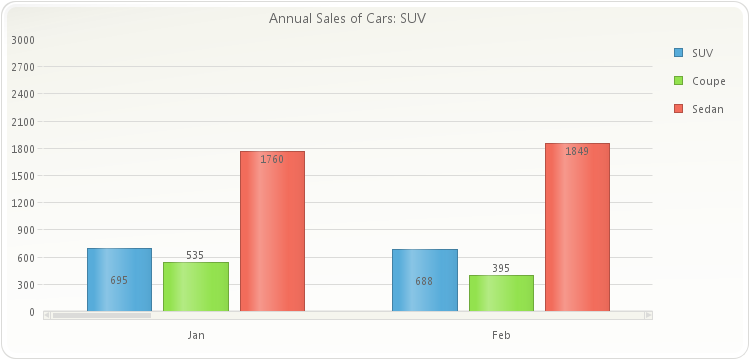
Gets or sets the horizontal alignment for the point label.
For more information on StringAlignment see the Java documentation.
The possible values are Center, Far, Near.
Below, the three line alignments are exemplified.
PopulateCarProduction(chart1);
chart1.getTitles().add(new TitleDockable("Annual Sales of Cars: SUV"));
chart1.setGallery(Gallery.BAR);
chart1.getData().setSeries(3);
chart1.getAxisX().setScrollView(0, 2);
chart1.getAllSeries().getPointLabels().setVisible(true);
chart1.getSeries().get(0).getPointLabels().setLineAlignment(StringAlignment.CENTER);
chart1.getSeries().get(1).getPointLabels().setLineAlignment(StringAlignment.FAR);
chart1.getSeries().get(2).getPointLabels().setLineAlignment(StringAlignment.NEAR);
public static void PopulateCarProduction(Chart chart1) { CarProduction[] production = new CarProduction[] { new CarProduction("Jan", 1760, 535, 695 ) , new CarProduction("Feb", 1849, 395, 688 ) , new CarProduction("Mar", 2831, 685, 1047 ) , new CarProduction("Apr", 2851, 984, 1652 ) , new CarProduction("May", 2961, 1579, 1889 ) , new CarProduction("Jun", 1519, 1539, 1766 ) , new CarProduction("Jul", 2633, 1489, 1361 ) , new CarProduction("Aug", 1140, 650, 874 ) , new CarProduction("Sep", 1626, 653, 693 ) , new CarProduction("Oct", 1478, 2236, 786 ) , new CarProduction("Nov", 1306, 1937, 599 ) , new CarProduction("Dec", 1607, 2138, 678 ) }; ObjectProvider objProvider = new ObjectProvider(production); chart1.getDataSourceSettings().setDataSource(objProvider); }public static class CarProduction { private CarProduction(String month, int sedan, int coupe, int SUV) { this.setMonth(month); this.setSedan(sedan); this.setCoupe(coupe); this.setSUV(SUV); } private String privateMonth; public final String getMonth() { return privateMonth; } public final void setMonth(String value) { privateMonth = value; } private int privateSedan; public final int getSedan() { return privateSedan; } public final void setSedan(int value) { privateSedan = value; } private int privateCoupe; public final int getCoupe() { return privateCoupe; } public final void setCoupe(int value) { privateCoupe = value; } private int privateSUV; public final int getSUV() { return privateSUV; } public final void setSUV(int value) { privateSUV = value; } }
- Parameters:
value-
-
getOffset
public java.awt.Point getOffset()
Allows you to customize the point label position by configuring its coordinates.
X represents the offset in pixel of the label related to the X Axis. Y represents the offset in pixel of the label related to the Y Axis. X and Y can be either positive or negative.
You may configure a point object with the desired values and assign that object to the
getOffsetmethod.Below, the
setOffsetmethod of the first point is set to 15 pixels to the right and 15 pixels up.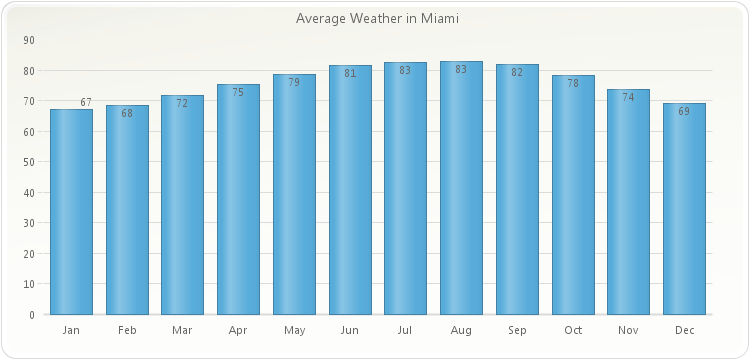
PopulateMiamiClimate(chart1, "Average");
chart1.getTitles().add(new TitleDockable("Average Weather in Miami"));
chart1.setGallery(Gallery.BAR);
chart1.getLegendBox().setVisible(false);
chart1.getAllSeries().getPointLabels().setLineAlignment(StringAlignment.NEAR);
chart1.getAllSeries().getPointLabels().setVisible(true);
chart1.getPoints().get(0).getPointLabels().setOffset(new java.awt.Point(15, 15));
public static void PopulateMiamiClimate(Chart chart1, String fieldNames) { MiamiClimate[] data = new MiamiClimate[] { new MiamiClimate("Jan", 59.6, 76.5, 67.2, 1.88, 9.5, 59 ), new MiamiClimate("Feb", 60.5, 77.7, 68.5, 2.07, 10.1, 71 ), new MiamiClimate("Mar", 64, 80.7, 71.7, 2.56, 10.5, 69.5 ), new MiamiClimate("Apr", 67.6, 83.8, 75.2, 3.36, 10.5, 67.5 ), new MiamiClimate("May", 72, 87.2, 78.7, 5.52, 9.5, 67 ), new MiamiClimate("Jun", 75.2, 89.5, 81.4, 8.54, 8.3, 71 ), new MiamiClimate("Jul", 76.5, 90.9, 82.6, 5.79, 7.9, 74 ), new MiamiClimate("Aug", 76.5, 90.6, 82.8, 8.63, 7.9, 74 ), new MiamiClimate("Sep", 75.7, 89, 81.9, 8.38, 8.2, 76 ), new MiamiClimate("Oct", 72.2, 85.4, 78.3, 6.19, 9.2, 76 ), new MiamiClimate("Nov", 67.5, 81.2, 73.6, 3.43, 9.7, 74 ), new MiamiClimate("Dec", 62.2, 77.5, 69.1, 2.18, 9.2, 73 ) }; ObjectProvider objProvider = new ObjectProvider(data); chart1.getDataSourceSettings().setDataSource(objProvider); if (fieldNames != ""){ List<DataField> removeFields = new ArrayList<DataField>(); List<String> includeFields = Arrays.asList(fieldNames.split(",")); chart1.getDataSourceSettings().fillFromSchema(); for (DataField dataField : chart1.getDataSourceSettings().getDataFields()) { if (dataField.isMeasure() && !includeFields.contains(dataField.getDataPath())) { removeFields.add(dataField); } } for (DataField dataField : removeFields) { chart1.getDataSourceSettings().getDataFields().remove(dataField); } } } public static void PopulateMiamiClimate(Chart chart1) { PopulateMiamiClimate(chart1, ""); }public static class MiamiClimate { public MiamiClimate(String Month, double low, double high, double average, double precipitation, double windSpeed, double relativeHumidity) { this.setMonth(Month); this.setLow(low); this.setHigh(high); this.setAverage(average); this.setPrecipitation(precipitation); this.setWindSpeed(windSpeed); this.setRelativeHumidity(relativeHumidity); } private String privateMonth; public final String getMonth() { return privateMonth; } public final void setMonth(String value) { privateMonth = value; } private double privateLow; public final double getLow() { return privateLow; } public final void setLow(double value) { privateLow = value; } private double privateHigh; public final double getHigh() { return privateHigh; } public final void setHigh(double value) { privateHigh = value; } private double privateAverage; public final double getAverage() { return privateAverage; } public final void setAverage(double value) { privateAverage = value; } private double privatePrecipitation; public final double getPrecipitation() { return privatePrecipitation; } public final void setPrecipitation(double value) { privatePrecipitation = value; } private double privateWindSpeed; public final double getWindSpeed() { return privateWindSpeed; } public final void setWindSpeed(double value) { privateWindSpeed = value; } private double privateRelativeHumidity; public final double getRelativeHumidity() { return privateRelativeHumidity; } public final void setRelativeHumidity(double value) { privateRelativeHumidity = value; } }
-
setOffset
public void setOffset(java.awt.Point value)
Allows you to customize the point label position by configuring its coordinates.
X represents the offset in pixel of the label related to the X Axis. Y represents the offset in pixel of the label related to the Y Axis. X and Y can be either positive or negative.
You may configure a point object with the desired values and assign that object to the
getOffsetmethod.Below, the
setOffsetmethod of the first point is set to 15 pixels to the right and 15 pixels up.PopulateMiamiClimate(chart1, "Average"); chart1.getTitles().add(new TitleDockable("Average Weather in Miami")); chart1.setGallery(Gallery.BAR); chart1.getLegendBox().setVisible(false); chart1.getAllSeries().getPointLabels().setLineAlignment(StringAlignment.NEAR); chart1.getAllSeries().getPointLabels().setVisible(true); chart1.getPoints().get(0).getPointLabels().setOffset(new java.awt.Point(15, 15));public static void PopulateMiamiClimate(Chart chart1, String fieldNames) { MiamiClimate[] data = new MiamiClimate[] { new MiamiClimate("Jan", 59.6, 76.5, 67.2, 1.88, 9.5, 59 ), new MiamiClimate("Feb", 60.5, 77.7, 68.5, 2.07, 10.1, 71 ), new MiamiClimate("Mar", 64, 80.7, 71.7, 2.56, 10.5, 69.5 ), new MiamiClimate("Apr", 67.6, 83.8, 75.2, 3.36, 10.5, 67.5 ), new MiamiClimate("May", 72, 87.2, 78.7, 5.52, 9.5, 67 ), new MiamiClimate("Jun", 75.2, 89.5, 81.4, 8.54, 8.3, 71 ), new MiamiClimate("Jul", 76.5, 90.9, 82.6, 5.79, 7.9, 74 ), new MiamiClimate("Aug", 76.5, 90.6, 82.8, 8.63, 7.9, 74 ), new MiamiClimate("Sep", 75.7, 89, 81.9, 8.38, 8.2, 76 ), new MiamiClimate("Oct", 72.2, 85.4, 78.3, 6.19, 9.2, 76 ), new MiamiClimate("Nov", 67.5, 81.2, 73.6, 3.43, 9.7, 74 ), new MiamiClimate("Dec", 62.2, 77.5, 69.1, 2.18, 9.2, 73 ) }; ObjectProvider objProvider = new ObjectProvider(data); chart1.getDataSourceSettings().setDataSource(objProvider); if (fieldNames != ""){ List<DataField> removeFields = new ArrayList<DataField>(); List<String> includeFields = Arrays.asList(fieldNames.split(",")); chart1.getDataSourceSettings().fillFromSchema(); for (DataField dataField : chart1.getDataSourceSettings().getDataFields()) { if (dataField.isMeasure() && !includeFields.contains(dataField.getDataPath())) { removeFields.add(dataField); } } for (DataField dataField : removeFields) { chart1.getDataSourceSettings().getDataFields().remove(dataField); } } } public static void PopulateMiamiClimate(Chart chart1) { PopulateMiamiClimate(chart1, ""); }public static class MiamiClimate { public MiamiClimate(String Month, double low, double high, double average, double precipitation, double windSpeed, double relativeHumidity) { this.setMonth(Month); this.setLow(low); this.setHigh(high); this.setAverage(average); this.setPrecipitation(precipitation); this.setWindSpeed(windSpeed); this.setRelativeHumidity(relativeHumidity); } private String privateMonth; public final String getMonth() { return privateMonth; } public final void setMonth(String value) { privateMonth = value; } private double privateLow; public final double getLow() { return privateLow; } public final void setLow(double value) { privateLow = value; } private double privateHigh; public final double getHigh() { return privateHigh; } public final void setHigh(double value) { privateHigh = value; } private double privateAverage; public final double getAverage() { return privateAverage; } public final void setAverage(double value) { privateAverage = value; } private double privatePrecipitation; public final double getPrecipitation() { return privatePrecipitation; } public final void setPrecipitation(double value) { privatePrecipitation = value; } private double privateWindSpeed; public final double getWindSpeed() { return privateWindSpeed; } public final void setWindSpeed(double value) { privateWindSpeed = value; } private double privateRelativeHumidity; public final double getRelativeHumidity() { return privateRelativeHumidity; } public final void setRelativeHumidity(double value) { privateRelativeHumidity = value; } }
- Parameters:
value-
-
isRichText
public boolean isRichText()
Sets or Gets a value indicating the Text will be treated as RichText
The
setPointLabelsmethod of thePointAttributesclass returns a PointLabelsAttributes object.The
setTextColormethod is used to get or set a value for the point label color.The
isVisiblemethod is a boolean indicating if point label should be displayed or not.Below, the point labels use the
isRichTextmethod to set the name of the country in bold.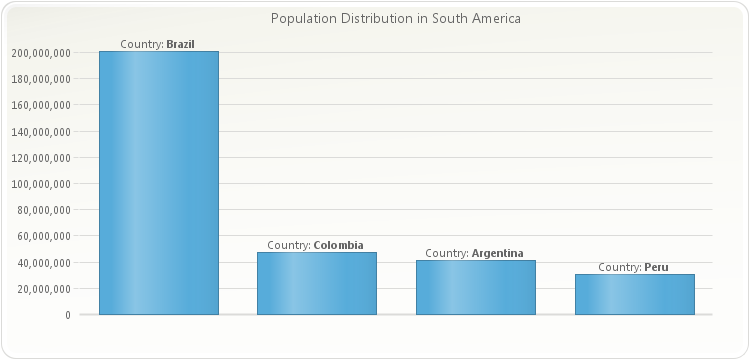
PopulateSouthAmericaPopulation(chart1);
chart1.getTitles().add(new TitleDockable("Population Distribution in South America"));
chart1.setGallery(Gallery.BAR);
chart1.getLegendBox().setVisible(false);
chart1.getAxisX().setScrollView(0, 4);
chart1.getAxisX().setVisible(false);
chart1.getAxisY().getLabelsFormat().setFormat(AxisFormat.NUMBER);
chart1.getAllSeries().getPointLabels().setVisible(true);
chart1.getAllSeries().getPointLabels().setRichText(true);
chart1.getAllSeries().getPointLabels().setFormat("Country: <b>%l</b>");
public static void PopulateSouthAmericaPopulation(Chart chart1) { SouthAmericaPopulation[] data = new SouthAmericaPopulation[]{ new SouthAmericaPopulation("Brazil", 201033000), new SouthAmericaPopulation("Colombia", 47130000), new SouthAmericaPopulation("Argentina", 41350000), new SouthAmericaPopulation("Peru", 30476000), new SouthAmericaPopulation("Venezuela", 29760000), new SouthAmericaPopulation("Chile", 16841000), new SouthAmericaPopulation("Ecuador", 15779000), new SouthAmericaPopulation("Bolivia", 10517000) }; ObjectProvider objProvider = new ObjectProvider(data); chart1.getDataSourceSettings().setDataSource(objProvider); }public static class SouthAmericaPopulation { public SouthAmericaPopulation(String country, double population) { this.setCountry(country); this.setPopulation(population); } private String privateCountry; public final String getCountry() { return privateCountry; } public final void setCountry(String value) { privateCountry = value; } private double privatePopulation; public final double getPopulation() { return privatePopulation; } public final void setPopulation(double value) { privatePopulation = value; } }
To use the PointLabels
isRichTextmethod:chart1.getAllSeries().getPointLabels().setVisible(true); chart1.getAllSeries().getPointLabels().setRichText(true); chart1.getAllSeries().getPointLabels().setFormat("I\'m <b> Point </b> # %N");
-
setRichText
public void setRichText(boolean value)
Sets or Gets a value indicating the Text will be treated as RichText
The
setPointLabelsmethod of thePointAttributesclass returns a PointLabelsAttributes object.The
setTextColormethod is used to get or set a value for the point label color.The
isVisiblemethod is a boolean indicating if point label should be displayed or not.Below, the point labels use the
isRichTextmethod to set the name of the country in bold.PopulateSouthAmericaPopulation(chart1); chart1.getTitles().add(new TitleDockable("Population Distribution in South America")); chart1.setGallery(Gallery.BAR); chart1.getLegendBox().setVisible(false); chart1.getAxisX().setScrollView(0, 4); chart1.getAxisX().setVisible(false); chart1.getAxisY().getLabelsFormat().setFormat(AxisFormat.NUMBER); chart1.getAllSeries().getPointLabels().setVisible(true); chart1.getAllSeries().getPointLabels().setRichText(true); chart1.getAllSeries().getPointLabels().setFormat("Country: <b>%l</b>");public static void PopulateSouthAmericaPopulation(Chart chart1) { SouthAmericaPopulation[] data = new SouthAmericaPopulation[]{ new SouthAmericaPopulation("Brazil", 201033000), new SouthAmericaPopulation("Colombia", 47130000), new SouthAmericaPopulation("Argentina", 41350000), new SouthAmericaPopulation("Peru", 30476000), new SouthAmericaPopulation("Venezuela", 29760000), new SouthAmericaPopulation("Chile", 16841000), new SouthAmericaPopulation("Ecuador", 15779000), new SouthAmericaPopulation("Bolivia", 10517000) }; ObjectProvider objProvider = new ObjectProvider(data); chart1.getDataSourceSettings().setDataSource(objProvider); }public static class SouthAmericaPopulation { public SouthAmericaPopulation(String country, double population) { this.setCountry(country); this.setPopulation(population); } private String privateCountry; public final String getCountry() { return privateCountry; } public final void setCountry(String value) { privateCountry = value; } private double privatePopulation; public final double getPopulation() { return privatePopulation; } public final void setPopulation(double value) { privatePopulation = value; } }
To use the PointLabels
isRichTextmethod:chart1.getAllSeries().getPointLabels().setVisible(true); chart1.getAllSeries().getPointLabels().setRichText(true); chart1.getAllSeries().getPointLabels().setFormat("I\'m <b> Point </b> # %N");
- Parameters:
value-
-
getTextColor
public java.awt.Color getTextColor()
Gets or sets a value for the point label color.
It is recommended to use a light color when the
setPlotAreaBackgroundof the chart is dark (and, vice versa).See Color class in Java documentation.
Below, the text color of the point labels is set to red:
PopulateCarProduction_SUV(chart1);
chart1.getTitles().add(new TitleDockable("Annual Car Production: SUV"));
chart1.getAxisY().getLabelsFormat().setFormat(AxisFormat.NUMBER);
chart1.getLegendBox().setVisible(false);
chart1.getAllSeries().getPointLabels().setVisible(true);
chart1.getAllSeries().getPointLabels().setTextColor(new java.awt.Color(255,0,0,255));
public static void PopulateCarProduction_SUV(Chart chart1) { CarProduction[] production = new CarProduction[] { new CarProduction("Jan", 1760, 535, 695 ) , new CarProduction("Feb", 1849, 395, 688 ) , new CarProduction("Mar", 2831, 685, 1047 ) , new CarProduction("Apr", 2851, 984, 1652 ) , new CarProduction("May", 2961, 1579, 1889 ) , new CarProduction("Jun", 1519, 1539, 1766 ) , new CarProduction("Jul", 2633, 1489, 1361 ) , new CarProduction("Aug", 1140, 650, 874 ) , new CarProduction("Sep", 1626, 653, 693 ) , new CarProduction("Oct", 1478, 2236, 786 ) , new CarProduction("Nov", 1306, 1937, 599 ) , new CarProduction("Dec", 1607, 2138, 678 ) }; ObjectProvider objProvider = new ObjectProvider(production); chart1.getDataSourceSettings().setDataSource(objProvider); // Since not all the fields in the DataSource are required, we must specify the number // of series that will be contained in the chart and perform the corresponding bindings chart1.getData().setSeries(1); NumericDataField numericFieldSUV = new NumericDataField(); numericFieldSUV.setDataPath("SUV"); chart1.getDataSourceSettings().getDataFields().add(numericFieldSUV); chart1.getSeries().get(0).getBindings().setY(numericFieldSUV); StringDataField stringField = new StringDataField(); stringField.setDataPath("Month"); chart1.getDataSourceSettings().getDataFields().add(stringField); chart1.getAxisX().getBindings().setLabel(stringField); }public static void PopulateCarProduction(Chart chart1) { CarProduction[] production = new CarProduction[] { new CarProduction("Jan", 1760, 535, 695 ) , new CarProduction("Feb", 1849, 395, 688 ) , new CarProduction("Mar", 2831, 685, 1047 ) , new CarProduction("Apr", 2851, 984, 1652 ) , new CarProduction("May", 2961, 1579, 1889 ) , new CarProduction("Jun", 1519, 1539, 1766 ) , new CarProduction("Jul", 2633, 1489, 1361 ) , new CarProduction("Aug", 1140, 650, 874 ) , new CarProduction("Sep", 1626, 653, 693 ) , new CarProduction("Oct", 1478, 2236, 786 ) , new CarProduction("Nov", 1306, 1937, 599 ) , new CarProduction("Dec", 1607, 2138, 678 ) }; ObjectProvider objProvider = new ObjectProvider(production); chart1.getDataSourceSettings().setDataSource(objProvider); }public static class CarProduction { private CarProduction(String month, int sedan, int coupe, int SUV) { this.setMonth(month); this.setSedan(sedan); this.setCoupe(coupe); this.setSUV(SUV); } private String privateMonth; public final String getMonth() { return privateMonth; } public final void setMonth(String value) { privateMonth = value; } private int privateSedan; public final int getSedan() { return privateSedan; } public final void setSedan(int value) { privateSedan = value; } private int privateCoupe; public final int getCoupe() { return privateCoupe; } public final void setCoupe(int value) { privateCoupe = value; } private int privateSUV; public final int getSUV() { return privateSUV; } public final void setSUV(int value) { privateSUV = value; } }
-
setTextColor
public void setTextColor(java.awt.Color value)
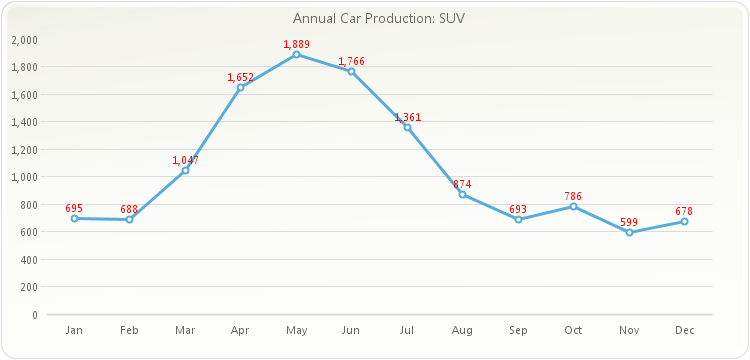
Gets or sets a value for the point label color.
It is recommended to use a light color when the
setPlotAreaBackgroundof the chart is dark (and, vice versa).See Color class in Java documentation.
Below, the text color of the point labels is set to red:
PopulateCarProduction_SUV(chart1);
chart1.getTitles().add(new TitleDockable("Annual Car Production: SUV"));
chart1.getAxisY().getLabelsFormat().setFormat(AxisFormat.NUMBER);
chart1.getLegendBox().setVisible(false);
chart1.getAllSeries().getPointLabels().setVisible(true);
chart1.getAllSeries().getPointLabels().setTextColor(new java.awt.Color(255,0,0,255));
public static void PopulateCarProduction_SUV(Chart chart1) { CarProduction[] production = new CarProduction[] { new CarProduction("Jan", 1760, 535, 695 ) , new CarProduction("Feb", 1849, 395, 688 ) , new CarProduction("Mar", 2831, 685, 1047 ) , new CarProduction("Apr", 2851, 984, 1652 ) , new CarProduction("May", 2961, 1579, 1889 ) , new CarProduction("Jun", 1519, 1539, 1766 ) , new CarProduction("Jul", 2633, 1489, 1361 ) , new CarProduction("Aug", 1140, 650, 874 ) , new CarProduction("Sep", 1626, 653, 693 ) , new CarProduction("Oct", 1478, 2236, 786 ) , new CarProduction("Nov", 1306, 1937, 599 ) , new CarProduction("Dec", 1607, 2138, 678 ) }; ObjectProvider objProvider = new ObjectProvider(production); chart1.getDataSourceSettings().setDataSource(objProvider); // Since not all the fields in the DataSource are required, we must specify the number // of series that will be contained in the chart and perform the corresponding bindings chart1.getData().setSeries(1); NumericDataField numericFieldSUV = new NumericDataField(); numericFieldSUV.setDataPath("SUV"); chart1.getDataSourceSettings().getDataFields().add(numericFieldSUV); chart1.getSeries().get(0).getBindings().setY(numericFieldSUV); StringDataField stringField = new StringDataField(); stringField.setDataPath("Month"); chart1.getDataSourceSettings().getDataFields().add(stringField); chart1.getAxisX().getBindings().setLabel(stringField); }public static void PopulateCarProduction(Chart chart1) { CarProduction[] production = new CarProduction[] { new CarProduction("Jan", 1760, 535, 695 ) , new CarProduction("Feb", 1849, 395, 688 ) , new CarProduction("Mar", 2831, 685, 1047 ) , new CarProduction("Apr", 2851, 984, 1652 ) , new CarProduction("May", 2961, 1579, 1889 ) , new CarProduction("Jun", 1519, 1539, 1766 ) , new CarProduction("Jul", 2633, 1489, 1361 ) , new CarProduction("Aug", 1140, 650, 874 ) , new CarProduction("Sep", 1626, 653, 693 ) , new CarProduction("Oct", 1478, 2236, 786 ) , new CarProduction("Nov", 1306, 1937, 599 ) , new CarProduction("Dec", 1607, 2138, 678 ) }; ObjectProvider objProvider = new ObjectProvider(production); chart1.getDataSourceSettings().setDataSource(objProvider); }public static class CarProduction { private CarProduction(String month, int sedan, int coupe, int SUV) { this.setMonth(month); this.setSedan(sedan); this.setCoupe(coupe); this.setSUV(SUV); } private String privateMonth; public final String getMonth() { return privateMonth; } public final void setMonth(String value) { privateMonth = value; } private int privateSedan; public final int getSedan() { return privateSedan; } public final void setSedan(int value) { privateSedan = value; } private int privateCoupe; public final int getCoupe() { return privateCoupe; } public final void setCoupe(int value) { privateCoupe = value; } private int privateSUV; public final int getSUV() { return privateSUV; } public final void setSUV(int value) { privateSUV = value; } }
- Parameters:
value-
-
isVisible
public boolean isVisible()
Gets or sets a value indicating if point label should be displayed or not.
The
setPointLabelsmethod of thePointAttributesclass returns a PointLabelsAttributes object.The
setAlignmentmethod is used to control the vertical alignment for the point label.The
setBackColormethod gets or sets the background color of the point label.The
setBorderColormethod gets or sets the border color of the point label.The
setBorderWidthmethod gets or sets a value indicating the width of the border surrounding the point label.To show the labels of all the points in the chart: data points:
chart1.getAllSeries().getPointLabels().setVisible(true);
-
setVisible
public void setVisible(boolean value)
Gets or sets a value indicating if point label should be displayed or not.
The
setPointLabelsmethod of thePointAttributesclass returns a PointLabelsAttributes object.The
setAlignmentmethod is used to control the vertical alignment for the point label.The
setBackColormethod gets or sets the background color of the point label.The
setBorderColormethod gets or sets the border color of the point label.The
setBorderWidthmethod gets or sets a value indicating the width of the border surrounding the point label.To show the labels of all the points in the chart: data points:
chart1.getAllSeries().getPointLabels().setVisible(true);
- Parameters:
value-
-
-