- java.lang.Object
-
- com.softwarefx.chartfx.server.PointAttributes
-
- com.softwarefx.chartfx.server.SeriesAttributes
-
- Direct Known Subclasses:
- GlobalAttributes
public class SeriesAttributes
extends PointAttributes
Provides access to the SeriesAttributes object
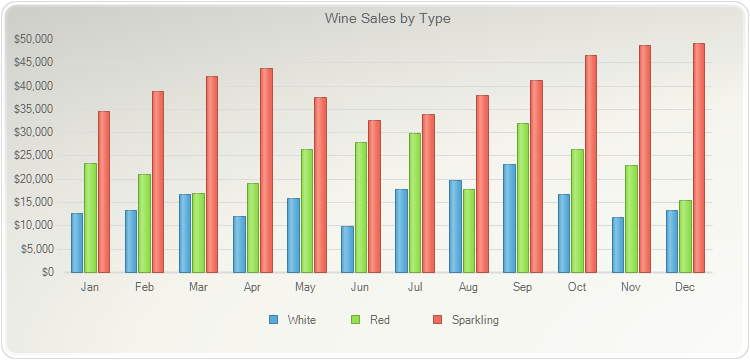
The chart series are represented by groups of data points. For example, consider a company that needs to compare the yearly sales of three (3) different products, each one of these products will be a series. On a bar chart, twelve (12) groups of bars representing each month will appear, each one of these groups will have 3 bars representing actual sales for that particular month, as depicted in the figure below:
The importance of the
SeriesAttributesclass, is that the developer can use the methods available in this object to set specific settings individually to the series, without affecting all of them at the same time. For example, you may want to create a combination (multitype) chart, where a Volume is plotted as Bars, and the Price is plotted as Line.
PopulateFinancialDataAmzn(chart1);
DateTimeDataField dfTransDate;
dfTransDate = new DateTimeDataField();
dfTransDate.setDataPath("TransDate");
NumericDataField dfClose;
dfClose = new NumericDataField();
dfClose.setDataPath("Close");
NumericDataField dfVolume;
dfVolume = new NumericDataField();
dfVolume.setDataPath("Volume");
chart1.getDataSourceSettings().getDataFields().add(((DataField)dfTransDate));
chart1.getDataSourceSettings().getDataFields().add(((DataField)dfClose));
chart1.getDataSourceSettings().getDataFields().add(((DataField)dfVolume));
chart1.getData().setSeries(2);
chart1.getSeries().get(0).getBindings().setY(dfClose);
chart1.getSeries().get(1).getBindings().setY(dfVolume);
chart1.getSeries().get(0).getAxisY().getLabelsFormat().setFormat(AxisFormat.CURRENCY);
chart1.getSeries().get(0).getAxisY().setMin(320);
chart1.getSeries().get(0).getAxisY().setMax(410);
chart1.getSeries().get(0).getAxisY().getTitle().setText("Close Price");
chart1.getSeries().get(1).setGallery(Gallery.BAR);
chart1.getSeries().get(1).setAxisY(chart1.getAxisY2());
chart1.getSeries().get(1).getAxisY().getLabelsFormat().setFormat(AxisFormat.NUMBER);
chart1.getSeries().get(1).getAxisY().getTitle().setText("Volume (M)");
chart1.getSeries().get(1).getAxisY().getScales().get(0).setScaleUnit(1000);
chart1.getAxisX().getBindings().setLabel(dfTransDate);
chart1.getAxisX().getTitle().setText("Date of Transaction");
chart1.getLegendBox().setVisible(false);
chart1.getTitles().add(new TitleDockable("Amazon Stock Price"));
chart1.getTitles().add(new TitleDockable("(Dec-2013)"));
TreeFilteringCondition cond;
cond = new TreeFilteringCondition();
And andCondition;
andCondition = new And();
andCondition.setLeftHandOperand(new DateTimeGreaterThanEqual(dfTransDate, new java.util.GregorianCalendar(2013, 11, 2).getTime()));
andCondition.setRightHandOperand(new DateTimeLessThanEqual(dfTransDate, new java.util.GregorianCalendar(2013, 11, 31).getTime()));
cond.setTree(andCondition);
AnalysisDataTransformer adt;
adt = new AnalysisDataTransformer();
adt.setItemsFilter(cond);
chart1.getDataSourceSettings().getTransformers().add(((IDataTransformer)adt));
public static void PopulateFinancialDataAmzn(Chart chart) { FinancialData[] data = new FinancialData[]{ new FinancialData(new java.util.GregorianCalendar(2013, 0, 2).getTime(), 256.08, 258.1, 253.26, 257.31, 3271279), new FinancialData(new java.util.GregorianCalendar(2013, 0, 3).getTime(), 257.27, 260.88, 256.37, 258.48, 2751611), new FinancialData(new java.util.GregorianCalendar(2013, 0, 4).getTime(), 257.58, 259.8, 256.65, 259.15, 1875900), new FinancialData(new java.util.GregorianCalendar(2013, 0, 7).getTime(), 262.97, 269.72, 262.67, 268.46, 4912360), new FinancialData(new java.util.GregorianCalendar(2013, 0, 8).getTime(), 267.07, 268.98, 263.57, 266.38, 3012356), new FinancialData(new java.util.GregorianCalendar(2013, 0, 9).getTime(), 268.17, 269.5, 265.4, 266.35, 2265991), new FinancialData(new java.util.GregorianCalendar(2013, 0, 10).getTime(), 268.54, 268.74, 262.3, 265.34, 2866093), new FinancialData(new java.util.GregorianCalendar(2013, 0, 11).getTime(), 265.1, 268.43, 264.11, 267.94, 2413364), new FinancialData(new java.util.GregorianCalendar(2013, 0, 14).getTime(), 268, 274.26, 267.54, 272.73, 4274746), new FinancialData(new java.util.GregorianCalendar(2013, 0, 15).getTime(), 270.68, 272.73, 269.3, 271.9, 2327154), new FinancialData(new java.util.GregorianCalendar(2013, 0, 16).getTime(), 270.53, 271.24, 267.83, 268.93, 2066092), new FinancialData(new java.util.GregorianCalendar(2013, 0, 17).getTime(), 271.5, 271.97, 269.21, 270.48, 1884883), new FinancialData(new java.util.GregorianCalendar(2013, 0, 18).getTime(), 270.83, 274.5, 269.6, 272.12, 2944742), new FinancialData(new java.util.GregorianCalendar(2013, 0, 22).getTime(), 271.62, 272.1, 269.23, 270.19, 2139462), new FinancialData(new java.util.GregorianCalendar(2013, 0, 23).getTime(), 270.57, 271.09, 266.65, 268.11, 2513507), new FinancialData(new java.util.GregorianCalendar(2013, 0, 24).getTime(), 269.37, 276.65, 269.37, 273.62, 3416909), new FinancialData(new java.util.GregorianCalendar(2013, 0, 25).getTime(), 275, 284.72, 274.4, 283.99, 4974945), new FinancialData(new java.util.GregorianCalendar(2013, 0, 28).getTime(), 283.78, 284.48, 274.4, 276.04, 4322557), new FinancialData(new java.util.GregorianCalendar(2013, 0, 29).getTime(), 275.35, 275.46, 258.35, 260.35, 10172552), new FinancialData(new java.util.GregorianCalendar(2013, 0, 30).getTime(), 283, 284.2, 267.11, 272.76, 13081805), new FinancialData(new java.util.GregorianCalendar(2013, 0, 31).getTime(), 271.04, 275.94, 263.7, 265.5, 6775977), new FinancialData(new java.util.GregorianCalendar(2013, 1, 1).getTime(), 268.93, 268.93, 262.8, 265, 6118146), new FinancialData(new java.util.GregorianCalendar(2013, 1, 4).getTime(), 262.78, 264.68, 259.07, 259.98, 3723793), new FinancialData(new java.util.GregorianCalendar(2013, 1, 5).getTime(), 262, 268.03, 261.46, 266.89, 4013780), new FinancialData(new java.util.GregorianCalendar(2013, 1, 6).getTime(), 265.16, 266.89, 261.11, 262.22, 2772204), new FinancialData(new java.util.GregorianCalendar(2013, 1, 7).getTime(), 264.1, 264.1, 255.11, 260.23, 3977065), new FinancialData(new java.util.GregorianCalendar(2013, 1, 8).getTime(), 261.4, 265.25, 260.56, 261.95, 3879628), new FinancialData(new java.util.GregorianCalendar(2013, 1, 11).getTime(), 263.2, 263.25, 256.6, 257.21, 3407457), new FinancialData(new java.util.GregorianCalendar(2013, 1, 12).getTime(), 259.19, 260.16, 257, 258.7, 2944730), new FinancialData(new java.util.GregorianCalendar(2013, 1, 13).getTime(), 261.53, 269.96, 260.3, 269.47, 5295786), new FinancialData(new java.util.GregorianCalendar(2013, 1, 14).getTime(), 267.37, 270.65, 265.4, 269.24, 3464080), new FinancialData(new java.util.GregorianCalendar(2013, 1, 15).getTime(), 267.63, 268.92, 263.11, 265.09, 3981233), new FinancialData(new java.util.GregorianCalendar(2013, 1, 19).getTime(), 265.91, 270.11, 264.5, 269.75, 2856410), new FinancialData(new java.util.GregorianCalendar(2013, 1, 20).getTime(), 270.2, 274.3, 266.37, 266.41, 3530656), new FinancialData(new java.util.GregorianCalendar(2013, 1, 21).getTime(), 265.12, 269.48, 263.25, 265.94, 3638795), new FinancialData(new java.util.GregorianCalendar(2013, 1, 22).getTime(), 266.62, 267.11, 261.61, 265.42, 3125202), new FinancialData(new java.util.GregorianCalendar(2013, 1, 25).getTime(), 266.94, 268.69, 259.65, 259.87, 3032709), new FinancialData(new java.util.GregorianCalendar(2013, 1, 26).getTime(), 260.89, 262.04, 255.73, 259.36, 3348760), new FinancialData(new java.util.GregorianCalendar(2013, 1, 27).getTime(), 259.4, 265.83, 256.86, 263.25, 2908410), new FinancialData(new java.util.GregorianCalendar(2013, 1, 28).getTime(), 261.81, 267, 260.63, 264.27, 2668154), new FinancialData(new java.util.GregorianCalendar(2013, 2, 1).getTime(), 263.27, 266.6, 261.04, 265.74, 2958799), new FinancialData(new java.util.GregorianCalendar(2013, 2, 4).getTime(), 265.36, 273.3, 264.14, 273.11, 3457519), new FinancialData(new java.util.GregorianCalendar(2013, 2, 5).getTime(), 274, 276.68, 269.99, 275.59, 3688583), new FinancialData(new java.util.GregorianCalendar(2013, 2, 6).getTime(), 275.76, 276.49, 271.83, 273.79, 2051552), new FinancialData(new java.util.GregorianCalendar(2013, 2, 7).getTime(), 274.1, 274.8, 271.85, 273.88, 1939787), new FinancialData(new java.util.GregorianCalendar(2013, 2, 8).getTime(), 275, 275.44, 271.5, 274.19, 1880117), new FinancialData(new java.util.GregorianCalendar(2013, 2, 11).getTime(), 273.43, 273.99, 270.4, 271.24, 1905076), new FinancialData(new java.util.GregorianCalendar(2013, 2, 12).getTime(), 271, 277.4, 270.36, 274.13, 3246856), new FinancialData(new java.util.GregorianCalendar(2013, 2, 13).getTime(), 275.24, 276.5, 272.64, 275.1, 1884215), new FinancialData(new java.util.GregorianCalendar(2013, 2, 14).getTime(), 269.67, 270, 263.53, 265.74, 5227305), new FinancialData(new java.util.GregorianCalendar(2013, 2, 15).getTime(), 264.98, 267.26, 260.05, 261.82, 4866472), new FinancialData(new java.util.GregorianCalendar(2013, 2, 18).getTime(), 259.3, 261.49, 257.12, 257.89, 2721496), new FinancialData(new java.util.GregorianCalendar(2013, 2, 19).getTime(), 258.4, 259.5, 252.62, 256.41, 3739566), new FinancialData(new java.util.GregorianCalendar(2013, 2, 20).getTime(), 258.05, 259.76, 254.55, 257.28, 2738970), new FinancialData(new java.util.GregorianCalendar(2013, 2, 21).getTime(), 256.11, 257, 252.68, 253.39, 2806446), new FinancialData(new java.util.GregorianCalendar(2013, 2, 22).getTime(), 254.55, 257.77, 252.07, 257.75, 3126299), new FinancialData(new java.util.GregorianCalendar(2013, 2, 25).getTime(), 258.58, 259.43, 254.5, 256.02, 2515058), new FinancialData(new java.util.GregorianCalendar(2013, 2, 26).getTime(), 257.05, 261.48, 256.28, 260.31, 2421160), new FinancialData(new java.util.GregorianCalendar(2013, 2, 27).getTime(), 258.75, 265.93, 257.9, 265.3, 2874924), new FinancialData(new java.util.GregorianCalendar(2013, 2, 28).getTime(), 265.82, 267.38, 264.06, 266.49, 2473857), new FinancialData(new java.util.GregorianCalendar(2013, 3, 1).getTime(), 266.98, 267.4, 261.01, 261.61, 2525200), new FinancialData(new java.util.GregorianCalendar(2013, 3, 2).getTime(), 262.4, 265.89, 260.55, 263.32, 2632338), new FinancialData(new java.util.GregorianCalendar(2013, 3, 3).getTime(), 262.12, 263.67, 257.75, 259.03, 2414484), new FinancialData(new java.util.GregorianCalendar(2013, 3, 4).getTime(), 259.23, 260.41, 256.12, 259.08, 1964612), new FinancialData(new java.util.GregorianCalendar(2013, 3, 5).getTime(), 255.72, 256.18, 253.67, 255.48, 2558157), new FinancialData(new java.util.GregorianCalendar(2013, 3, 8).getTime(), 255.92, 259.68, 255.63, 258.95, 2296823), new FinancialData(new java.util.GregorianCalendar(2013, 3, 9).getTime(), 258.85, 262.61, 257, 261.14, 2158332), new FinancialData(new java.util.GregorianCalendar(2013, 3, 10).getTime(), 261.78, 265.98, 259.32, 264.77, 2322707), new FinancialData(new java.util.GregorianCalendar(2013, 3, 11).getTime(), 264.74, 270.97, 264.74, 269.85, 3092065), new FinancialData(new java.util.GregorianCalendar(2013, 3, 12).getTime(), 270.12, 273.27, 267.02, 272.87, 2868165), new FinancialData(new java.util.GregorianCalendar(2013, 3, 15).getTime(), 271.08, 275.12, 267.1, 267.72, 3325919), new FinancialData(new java.util.GregorianCalendar(2013, 3, 16).getTime(), 269.31, 272.8, 268.06, 272.34, 2138618), new FinancialData(new java.util.GregorianCalendar(2013, 3, 17).getTime(), 270.8, 270.85, 264.25, 267.4, 3135291), new FinancialData(new java.util.GregorianCalendar(2013, 3, 18).getTime(), 266.81, 266.99, 256.6, 259.42, 3138006), new FinancialData(new java.util.GregorianCalendar(2013, 3, 19).getTime(), 258.16, 262.88, 257.5, 260.32, 2602870), new FinancialData(new java.util.GregorianCalendar(2013, 3, 22).getTime(), 259.35, 264.6, 258.03, 263.55, 2119351), new FinancialData(new java.util.GregorianCalendar(2013, 3, 23).getTime(), 264.5, 269.87, 264.5, 268.9, 2274694), new FinancialData(new java.util.GregorianCalendar(2013, 3, 24).getTime(), 269.5, 271.47, 266.81, 268.78, 1855081), new FinancialData(new java.util.GregorianCalendar(2013, 3, 25).getTime(), 271.53, 275.8, 270.5, 274.7, 6116498), new FinancialData(new java.util.GregorianCalendar(2013, 3, 26).getTime(), 269.97, 272.02, 252.81, 254.81, 14035877), new FinancialData(new java.util.GregorianCalendar(2013, 3, 29).getTime(), 254.9, 257.01, 249.15, 249.74, 7120310), new FinancialData(new java.util.GregorianCalendar(2013, 3, 30).getTime(), 249.37, 254.68, 248.56, 253.81, 4250210), new FinancialData(new java.util.GregorianCalendar(2013, 4, 1).getTime(), 253.9, 254.2, 245.75, 248.23, 4392202), new FinancialData(new java.util.GregorianCalendar(2013, 4, 2).getTime(), 248.94, 252.93, 245.78, 252.55, 3936170), new FinancialData(new java.util.GregorianCalendar(2013, 4, 3).getTime(), 256.14, 259.25, 254.7, 258.05, 3514674), new FinancialData(new java.util.GregorianCalendar(2013, 4, 6).getTime(), 258.09, 259.5, 253.42, 255.72, 2349545), new FinancialData(new java.util.GregorianCalendar(2013, 4, 7).getTime(), 256.31, 259.74, 252.91, 257.73, 3134069), new FinancialData(new java.util.GregorianCalendar(2013, 4, 8).getTime(), 256.87, 260.3, 255.33, 258.68, 2677086), new FinancialData(new java.util.GregorianCalendar(2013, 4, 9).getTime(), 258.73, 263.55, 256.88, 260.16, 2769255), new FinancialData(new java.util.GregorianCalendar(2013, 4, 10).getTime(), 260.88, 263.65, 260.21, 263.63, 3145869), new FinancialData(new java.util.GregorianCalendar(2013, 4, 13).getTime(), 262.77, 265.88, 262, 264.51, 2149498), new FinancialData(new java.util.GregorianCalendar(2013, 4, 14).getTime(), 264.5, 269.4, 264.03, 268.33, 2700674), new FinancialData(new java.util.GregorianCalendar(2013, 4, 15).getTime(), 267.07, 269.05, 264.56, 266.56, 2721687), new FinancialData(new java.util.GregorianCalendar(2013, 4, 16).getTime(), 265.96, 268.43, 263.85, 264.12, 1643668), new FinancialData(new java.util.GregorianCalendar(2013, 4, 17).getTime(), 265.83, 269.98, 265, 269.9, 2528227), new FinancialData(new java.util.GregorianCalendar(2013, 4, 20).getTime(), 269, 271.79, 266.5, 267.63, 2209034), new FinancialData(new java.util.GregorianCalendar(2013, 4, 21).getTime(), 268.74, 270.77, 267.66, 268.86, 1741466), new FinancialData(new java.util.GregorianCalendar(2013, 4, 22).getTime(), 267.39, 267.59, 260.8, 262.96, 3324784), new FinancialData(new java.util.GregorianCalendar(2013, 4, 23).getTime(), 260.49, 263.17, 259.59, 261.8, 2007811), new FinancialData(new java.util.GregorianCalendar(2013, 4, 24).getTime(), 259.85, 261.93, 258.34, 261.74, 1696415), new FinancialData(new java.util.GregorianCalendar(2013, 4, 28).getTime(), 266.48, 271.1, 266, 267.29, 3471096), new FinancialData(new java.util.GregorianCalendar(2013, 4, 29).getTime(), 265.46, 268.25, 264.84, 265.53, 1903590), new FinancialData(new java.util.GregorianCalendar(2013, 4, 30).getTime(), 265.71, 268.57, 265.62, 266.83, 1668469), new FinancialData(new java.util.GregorianCalendar(2013, 4, 31).getTime(), 266, 271.91, 265.94, 269.2, 3374919), new FinancialData(new java.util.GregorianCalendar(2013, 5, 3).getTime(), 265.38, 269.11, 262.95, 266.88, 2545284), new FinancialData(new java.util.GregorianCalendar(2013, 5, 4).getTime(), 267, 268.88, 263.02, 265.7, 2088972), new FinancialData(new java.util.GregorianCalendar(2013, 5, 5).getTime(), 265.81, 271.66, 265.02, 267.17, 3512867), new FinancialData(new java.util.GregorianCalendar(2013, 5, 6).getTime(), 267.75, 270.5, 264.21, 267.83, 2476368), new FinancialData(new java.util.GregorianCalendar(2013, 5, 7).getTime(), 269.74, 280.1, 269.13, 276.87, 4632539), new FinancialData(new java.util.GregorianCalendar(2013, 5, 10).getTime(), 276.68, 282.47, 275.24, 281.07, 3088355), new FinancialData(new java.util.GregorianCalendar(2013, 5, 11).getTime(), 276, 278.41, 274.24, 274.78, 3094367), new FinancialData(new java.util.GregorianCalendar(2013, 5, 12).getTime(), 276.6, 276.8, 270.45, 271.67, 2239259), new FinancialData(new java.util.GregorianCalendar(2013, 5, 13).getTime(), 271.5, 276.8, 270.29, 275.79, 2651715), new FinancialData(new java.util.GregorianCalendar(2013, 5, 14).getTime(), 275, 277.07, 273.44, 273.99, 2147223), new FinancialData(new java.util.GregorianCalendar(2013, 5, 17).getTime(), 276.35, 280.2, 275.65, 278.06, 2885680), new FinancialData(new java.util.GregorianCalendar(2013, 5, 18).getTime(), 279.08, 282.91, 278.11, 281.76, 2147649), new FinancialData(new java.util.GregorianCalendar(2013, 5, 19).getTime(), 281.26, 283.34, 277.87, 278.16, 2828375), new FinancialData(new java.util.GregorianCalendar(2013, 5, 20).getTime(), 275.14, 278.6, 272.39, 273.44, 2985196), new FinancialData(new java.util.GregorianCalendar(2013, 5, 21).getTime(), 274.57, 275.84, 269.79, 273.36, 4202058), new FinancialData(new java.util.GregorianCalendar(2013, 5, 24).getTime(), 271.29, 273.16, 265, 270.61, 3866168), new FinancialData(new java.util.GregorianCalendar(2013, 5, 25).getTime(), 272.3, 273.47, 269, 272.09, 2452910), new FinancialData(new java.util.GregorianCalendar(2013, 5, 26).getTime(), 273.98, 277.98, 273.5, 277.57, 3029816), new FinancialData(new java.util.GregorianCalendar(2013, 5, 27).getTime(), 279.18, 280.2, 274.54, 277.55, 2520422), new FinancialData(new java.util.GregorianCalendar(2013, 5, 28).getTime(), 276.19, 279.83, 276.19, 277.69, 3193515), new FinancialData(new java.util.GregorianCalendar(2013, 6, 1).getTime(), 279, 283.29, 277.16, 282.1, 2890065), new FinancialData(new java.util.GregorianCalendar(2013, 6, 2).getTime(), 281.04, 286.58, 280.59, 283.73, 3238618), new FinancialData(new java.util.GregorianCalendar(2013, 6, 3).getTime(), 282, 285.4, 282, 284.03, 1380205), new FinancialData(new java.util.GregorianCalendar(2013, 6, 5).getTime(), 285, 286.38, 282.07, 285.88, 1985923), new FinancialData(new java.util.GregorianCalendar(2013, 6, 8).getTime(), 286.42, 291.67, 286.14, 290.59, 3047197), new FinancialData(new java.util.GregorianCalendar(2013, 6, 9).getTime(), 291, 292.57, 288.01, 291.53, 2775516), new FinancialData(new java.util.GregorianCalendar(2013, 6, 10).getTime(), 291.41, 293.34, 289.4, 292.33, 1810122), new FinancialData(new java.util.GregorianCalendar(2013, 6, 11).getTime(), 294.99, 300.69, 292.1, 299.66, 4007601), new FinancialData(new java.util.GregorianCalendar(2013, 6, 12).getTime(), 298.69, 307.55, 298.5, 307.55, 4543264), new FinancialData(new java.util.GregorianCalendar(2013, 6, 15).getTime(), 307.27, 307.99, 304.35, 306.57, 2245687), new FinancialData(new java.util.GregorianCalendar(2013, 6, 16).getTime(), 307.3, 309.39, 305.51, 306.87, 2660597), new FinancialData(new java.util.GregorianCalendar(2013, 6, 17).getTime(), 306.97, 308.8, 305.69, 308.69, 2031626), new FinancialData(new java.util.GregorianCalendar(2013, 6, 18).getTime(), 306.27, 306.34, 301.87, 304.11, 3064359), new FinancialData(new java.util.GregorianCalendar(2013, 6, 19).getTime(), 304.39, 305.79, 301.91, 305.23, 2973181), new FinancialData(new java.util.GregorianCalendar(2013, 6, 22).getTime(), 309.25, 309.25, 302, 303.48, 2522023), new FinancialData(new java.util.GregorianCalendar(2013, 6, 23).getTime(), 303.16, 305.06, 300.56, 301.06, 1999624), new FinancialData(new java.util.GregorianCalendar(2013, 6, 24).getTime(), 303.02, 303.84, 298.04, 298.94, 2002745), new FinancialData(new java.util.GregorianCalendar(2013, 6, 25).getTime(), 299, 304.5, 296.75, 303.4, 5484465), new FinancialData(new java.util.GregorianCalendar(2013, 6, 26).getTime(), 299.55, 313.62, 295.55, 312.01, 8819755), new FinancialData(new java.util.GregorianCalendar(2013, 6, 29).getTime(), 311.07, 313, 305.9, 306.1, 3213115), new FinancialData(new java.util.GregorianCalendar(2013, 6, 30).getTime(), 307.72, 309.78, 301.57, 302.41, 3053775), new FinancialData(new java.util.GregorianCalendar(2013, 6, 31).getTime(), 303.91, 305.15, 301, 301.22, 1891514), new FinancialData(new java.util.GregorianCalendar(2013, 7, 1).getTime(), 303.08, 306.21, 298.9, 305.57, 2971659), new FinancialData(new java.util.GregorianCalendar(2013, 7, 2).getTime(), 304.63, 305.33, 301.5, 304.21, 2508358), new FinancialData(new java.util.GregorianCalendar(2013, 7, 5).getTime(), 303.4, 303.62, 298.3, 300.99, 2233258), new FinancialData(new java.util.GregorianCalendar(2013, 7, 6).getTime(), 300.51, 301.36, 297.52, 300.75, 1849796), new FinancialData(new java.util.GregorianCalendar(2013, 7, 7).getTime(), 300.15, 300.99, 296.15, 296.91, 1963110), new FinancialData(new java.util.GregorianCalendar(2013, 7, 8).getTime(), 298.52, 298.52, 292.55, 295.74, 2346335), new FinancialData(new java.util.GregorianCalendar(2013, 7, 9).getTime(), 295.68, 299.27, 294.3, 297.26, 1950386), new FinancialData(new java.util.GregorianCalendar(2013, 7, 12).getTime(), 295.79, 299.08, 295.26, 296.69, 1504625), new FinancialData(new java.util.GregorianCalendar(2013, 7, 13).getTime(), 295.88, 296.37, 290.67, 293.97, 2355093), new FinancialData(new java.util.GregorianCalendar(2013, 7, 14).getTime(), 294.29, 294.29, 290.54, 291.34, 1415476), new FinancialData(new java.util.GregorianCalendar(2013, 7, 15).getTime(), 288.79, 289.3, 285.15, 286.47, 2261493), new FinancialData(new java.util.GregorianCalendar(2013, 7, 16).getTime(), 286.55, 288.33, 284.5, 284.82, 2423056), new FinancialData(new java.util.GregorianCalendar(2013, 7, 19).getTime(), 285.19, 289.56, 283.48, 285.57, 2479612), new FinancialData(new java.util.GregorianCalendar(2013, 7, 20).getTime(), 285.88, 289.52, 285.74, 287.09, 1586236), new FinancialData(new java.util.GregorianCalendar(2013, 7, 21).getTime(), 285.09, 288.5, 283.83, 284.57, 1816344), new FinancialData(new java.util.GregorianCalendar(2013, 7, 22).getTime(), 284.8, 289.87, 284.8, 289.73, 1422672), new FinancialData(new java.util.GregorianCalendar(2013, 7, 23).getTime(), 291.21, 291.5, 287.9, 290.01, 1965385), new FinancialData(new java.util.GregorianCalendar(2013, 7, 26).getTime(), 290.43, 291.05, 285.62, 286.21, 1718213), new FinancialData(new java.util.GregorianCalendar(2013, 7, 27).getTime(), 283.87, 285.28, 279.74, 280.93, 2469637), new FinancialData(new java.util.GregorianCalendar(2013, 7, 28).getTime(), 280.36, 283, 279.33, 281.58, 1457461), new FinancialData(new java.util.GregorianCalendar(2013, 7, 29).getTime(), 281.45, 285.98, 280, 283.98, 1566544), new FinancialData(new java.util.GregorianCalendar(2013, 7, 30).getTime(), 284.59, 284.87, 280, 280.98, 1534706), new FinancialData(new java.util.GregorianCalendar(2013, 8, 3).getTime(), 284.73, 291.39, 284.17, 288.8, 2898422), new FinancialData(new java.util.GregorianCalendar(2013, 8, 4).getTime(), 288.33, 295.23, 287.58, 293.64, 2439351), new FinancialData(new java.util.GregorianCalendar(2013, 8, 5).getTime(), 293.63, 297, 292.71, 294.1, 1819790), new FinancialData(new java.util.GregorianCalendar(2013, 8, 6).getTime(), 295.33, 298.88, 290.8, 295.86, 2287606), new FinancialData(new java.util.GregorianCalendar(2013, 8, 9).getTime(), 297.22, 299.96, 296.6, 299.71, 1626753), new FinancialData(new java.util.GregorianCalendar(2013, 8, 10).getTime(), 300.55, 301, 297.22, 300.36, 1781037), new FinancialData(new java.util.GregorianCalendar(2013, 8, 11).getTime(), 298.91, 301.86, 297.84, 299.64, 1742264), new FinancialData(new java.util.GregorianCalendar(2013, 8, 12).getTime(), 299.39, 302, 297.66, 298.86, 1606393), new FinancialData(new java.util.GregorianCalendar(2013, 8, 13).getTime(), 300.14, 300.22, 296.2, 297.92, 1350645), new FinancialData(new java.util.GregorianCalendar(2013, 8, 16).getTime(), 299.82, 301, 295.26, 296.06, 1818400), new FinancialData(new java.util.GregorianCalendar(2013, 8, 17).getTime(), 297.63, 304.65, 296.01, 304.17, 2297381), new FinancialData(new java.util.GregorianCalendar(2013, 8, 18).getTime(), 304.06, 312.74, 302.91, 312.03, 2946988), new FinancialData(new java.util.GregorianCalendar(2013, 8, 19).getTime(), 313.77, 314.54, 311.04, 312.06, 2350946), new FinancialData(new java.util.GregorianCalendar(2013, 8, 20).getTime(), 312.54, 320.57, 312.41, 316.34, 5306003), new FinancialData(new java.util.GregorianCalendar(2013, 8, 23).getTime(), 314.01, 315.9, 308.77, 311.49, 1877677), new FinancialData(new java.util.GregorianCalendar(2013, 8, 24).getTime(), 312.43, 318.08, 311.28, 314.13, 2033546), new FinancialData(new java.util.GregorianCalendar(2013, 8, 25).getTime(), 314.53, 316.71, 310.75, 312.65, 2010249), new FinancialData(new java.util.GregorianCalendar(2013, 8, 26).getTime(), 313.9, 319.37, 313.26, 318.12, 1990982), new FinancialData(new java.util.GregorianCalendar(2013, 8, 27).getTime(), 316.92, 317.21, 313.35, 316.01, 1658435), new FinancialData(new java.util.GregorianCalendar(2013, 8, 30).getTime(), 313.41, 315.31, 311.06, 312.64, 1619102), new FinancialData(new java.util.GregorianCalendar(2013, 9, 1).getTime(), 314.22, 321, 313.65, 320.95, 2398999), new FinancialData(new java.util.GregorianCalendar(2013, 9, 2).getTime(), 318.04, 321.73, 317.52, 320.51, 2210411), new FinancialData(new java.util.GregorianCalendar(2013, 9, 3).getTime(), 320.39, 322.92, 313.02, 314.76, 2679440), new FinancialData(new java.util.GregorianCalendar(2013, 9, 4).getTime(), 315.13, 319.2, 312.62, 319.04, 1814976), new FinancialData(new java.util.GregorianCalendar(2013, 9, 7).getTime(), 315.24, 315.34, 309.74, 310.03, 2085725), new FinancialData(new java.util.GregorianCalendar(2013, 9, 8).getTime(), 311.5, 311.54, 300.27, 303.23, 3160227), new FinancialData(new java.util.GregorianCalendar(2013, 9, 9).getTime(), 303.42, 303.5, 296.5, 298.23, 3252771), new FinancialData(new java.util.GregorianCalendar(2013, 9, 10).getTime(), 304.63, 306.7, 302.59, 305.17, 2557138), new FinancialData(new java.util.GregorianCalendar(2013, 9, 11).getTime(), 304.77, 310.93, 303.84, 310.89, 2163093), new FinancialData(new java.util.GregorianCalendar(2013, 9, 14).getTime(), 309.22, 311.64, 307, 310.7, 1939092), new FinancialData(new java.util.GregorianCalendar(2013, 9, 15).getTime(), 309.87, 310.79, 305.26, 306.4, 2261554), new FinancialData(new java.util.GregorianCalendar(2013, 9, 16).getTime(), 308.38, 310.8, 305.55, 310.49, 2180521), new FinancialData(new java.util.GregorianCalendar(2013, 9, 17).getTime(), 307.07, 311, 305.24, 310.77, 2648384), new FinancialData(new java.util.GregorianCalendar(2013, 9, 18).getTime(), 319.36, 331.89, 316.75, 328.93, 5969814), new FinancialData(new java.util.GregorianCalendar(2013, 9, 21).getTime(), 329.89, 330, 323.8, 326.44, 2527617), new FinancialData(new java.util.GregorianCalendar(2013, 9, 22).getTime(), 327.72, 337.11, 325.68, 332.54, 3942953), new FinancialData(new java.util.GregorianCalendar(2013, 9, 23).getTime(), 330.84, 331.72, 324.06, 326.76, 2818158), new FinancialData(new java.util.GregorianCalendar(2013, 9, 24).getTime(), 329.63, 332.65, 326.75, 332.21, 4891383), new FinancialData(new java.util.GregorianCalendar(2013, 9, 25).getTime(), 358.6, 368.4, 352.62, 363.39, 11997904), new FinancialData(new java.util.GregorianCalendar(2013, 9, 28).getTime(), 359.92, 362.75, 357.2, 358.16, 3635848), new FinancialData(new java.util.GregorianCalendar(2013, 9, 29).getTime(), 358.96, 362.89, 356.29, 362.7, 2190763), new FinancialData(new java.util.GregorianCalendar(2013, 9, 30).getTime(), 362.62, 365, 358.65, 361.08, 4505005), new FinancialData(new java.util.GregorianCalendar(2013, 9, 31).getTime(), 361.73, 366, 359, 364.03, 2466937), new FinancialData(new java.util.GregorianCalendar(2013, 10, 1).getTime(), 365.63, 365.77, 356.1, 359, 3332126), new FinancialData(new java.util.GregorianCalendar(2013, 10, 4).getTime(), 360.12, 361, 354.4, 358.74, 1940496), new FinancialData(new java.util.GregorianCalendar(2013, 10, 5).getTime(), 356.78, 360.17, 354.84, 358.89, 2007275), new FinancialData(new java.util.GregorianCalendar(2013, 10, 6).getTime(), 360.45, 362.87, 354.5, 356.18, 2288077), new FinancialData(new java.util.GregorianCalendar(2013, 10, 7).getTime(), 355.86, 357.9, 341.88, 343.56, 4250065), new FinancialData(new java.util.GregorianCalendar(2013, 10, 8).getTime(), 345.95, 351.05, 344.04, 350.31, 2656865), new FinancialData(new java.util.GregorianCalendar(2013, 10, 11).getTime(), 350.59, 355.37, 348.06, 354.38, 2262538), new FinancialData(new java.util.GregorianCalendar(2013, 10, 12).getTime(), 352.99, 355.48, 347.28, 349.53, 2344304), new FinancialData(new java.util.GregorianCalendar(2013, 10, 13).getTime(), 347.4, 356.22, 345.68, 356.22, 2777832), new FinancialData(new java.util.GregorianCalendar(2013, 10, 14).getTime(), 357.39, 368.94, 356.43, 367.4, 4164128), new FinancialData(new java.util.GregorianCalendar(2013, 10, 15).getTime(), 367.63, 372.9, 365.55, 369.17, 4494773), new FinancialData(new java.util.GregorianCalendar(2013, 10, 18).getTime(), 370.28, 373.49, 364.67, 366.18, 2738214), new FinancialData(new java.util.GregorianCalendar(2013, 10, 19).getTime(), 365.82, 368.78, 362.5, 364.94, 1904797), new FinancialData(new java.util.GregorianCalendar(2013, 10, 20).getTime(), 367.56, 367.56, 360.45, 362.57, 1772984), new FinancialData(new java.util.GregorianCalendar(2013, 10, 21).getTime(), 364.05, 369.25, 363.3, 368.92, 1967041), new FinancialData(new java.util.GregorianCalendar(2013, 10, 22).getTime(), 370, 374.5, 366.31, 372.31, 2967833), new FinancialData(new java.util.GregorianCalendar(2013, 10, 25).getTime(), 373.82, 377.79, 373.18, 376.64, 2972546), new FinancialData(new java.util.GregorianCalendar(2013, 10, 26).getTime(), 377.61, 382.5, 374.82, 381.37, 2730689), new FinancialData(new java.util.GregorianCalendar(2013, 10, 27).getTime(), 383.5, 387, 382.61, 386.71, 2269656), new FinancialData(new java.util.GregorianCalendar(2013, 10, 29).getTime(), 389.1, 394.1, 388.62, 393.62, 2405985), new FinancialData(new java.util.GregorianCalendar(2013, 11, 2).getTime(), 399, 399, 389.1, 392.3, 4718883), new FinancialData(new java.util.GregorianCalendar(2013, 11, 3).getTime(), 390.11, 390.95, 383.1, 384.66, 3707536), new FinancialData(new java.util.GregorianCalendar(2013, 11, 4).getTime(), 383.5, 389.69, 381.49, 385.96, 2355719), new FinancialData(new java.util.GregorianCalendar(2013, 11, 5).getTime(), 386.65, 386.65, 381.37, 384.49, 1906452), new FinancialData(new java.util.GregorianCalendar(2013, 11, 6).getTime(), 388.35, 388.35, 383.83, 386.95, 1987762), new FinancialData(new java.util.GregorianCalendar(2013, 11, 9).getTime(), 388.21, 388.21, 382.57, 384.89, 2766573), new FinancialData(new java.util.GregorianCalendar(2013, 11, 10).getTime(), 383.5, 389.06, 383.02, 387.78, 2739875), new FinancialData(new java.util.GregorianCalendar(2013, 11, 11).getTime(), 387.71, 388.98, 382, 382.19, 2451254), new FinancialData(new java.util.GregorianCalendar(2013, 11, 12).getTime(), 381.55, 385, 379.5, 381.25, 2123652), new FinancialData(new java.util.GregorianCalendar(2013, 11, 13).getTime(), 384.62, 389.42, 383.8, 384.24, 3025145), new FinancialData(new java.util.GregorianCalendar(2013, 11, 16).getTime(), 385.5, 391.7, 385, 388.97, 2258884), new FinancialData(new java.util.GregorianCalendar(2013, 11, 17).getTime(), 391, 391.36, 386.5, 387.65, 2348377), new FinancialData(new java.util.GregorianCalendar(2013, 11, 18).getTime(), 389.56, 396.3, 383.1, 395.96, 3493635), new FinancialData(new java.util.GregorianCalendar(2013, 11, 19).getTime(), 394.36, 397.29, 392.6, 395.19, 2429598), new FinancialData(new java.util.GregorianCalendar(2013, 11, 20).getTime(), 396.84, 404.72, 395.78, 402.2, 5038537), new FinancialData(new java.util.GregorianCalendar(2013, 11, 23).getTime(), 403.69, 405, 399.2, 402.92, 2661823), new FinancialData(new java.util.GregorianCalendar(2013, 11, 24).getTime(), 402.52, 403.72, 396.37, 399.2, 1380373), new FinancialData(new java.util.GregorianCalendar(2013, 11, 26).getTime(), 401.79, 404.52, 396.81, 404.39, 1871590), new FinancialData(new java.util.GregorianCalendar(2013, 11, 27).getTime(), 404.65, 405.63, 396.25, 398.08, 1987280), new FinancialData(new java.util.GregorianCalendar(2013, 11, 30).getTime(), 399.41, 399.92, 392.45, 393.37, 2487812), new FinancialData(new java.util.GregorianCalendar(2013, 11, 31).getTime(), 394.58, 398.83, 393.8, 398.79, 1997051)}; ObjectProvider objProvider = new ObjectProvider(data); chart.setChartDataSource(objProvider); }public static class FinancialData { private FinancialData(Date time, double open, double high, double low, double close, double volume) { this.setTransDate(time); this.setOpen(open); this.setHigh(high); this.setLow(low); this.setClose(close); this.setVolume(volume); } private java.util.Date privateTransDate = new java.util.Date(); public final java.util.Date getTransDate() { return privateTransDate; } public final void setTransDate(java.util.Date value) { privateTransDate = value; } private double privateOpen; public final double getOpen() { return privateOpen; } public final void setOpen(double value) { privateOpen = value; } private double privateHigh; public final double getHigh() { return privateHigh; } public final void setHigh(double value) { privateHigh = value; } private double privateLow; public final double getLow() { return privateLow; } public final void setLow(double value) { privateLow = value; } private double privateClose; public final double getClose() { return privateClose; } public final void setClose(double value) { privateClose = value; } private double privateVolume; public final double getVolume() { return privateVolume; } public final void setVolume(double value) { privateVolume = value; } }
-
-
Nested Class Summary
Nested Classes Modifier and Type Class and Description static classSeriesAttributes.SeriesBindingsDescription goes here
-
Constructor Summary
Constructors Constructor and Description SeriesAttributes()Constructs a newly allocated SeriesAttributes object
-
Method Summary
Methods Modifier and Type Method and Description voidbringToFront()Sends a SeriesAttributes to the first position in the SeriesAttributes Collection.Displays the series to the front of the chart.voiddrawMarker(java.awt.Graphics2D g, java.awt.Point pt, int item, int radius, boolean drawLine)Used to draw a marker on a selected device context.AxisXgetAxisX()Gets or sets a value indicating the AxisX the series is connected to.AxisYgetAxisY()Gets or sets a value indicating the AxisY the series is connected to.SeriesAttributes.SeriesBindingsgetBindings()Provides access to the SeriesAttributes.SeriesBindings properties of the series.java.awt.ColorgetColor()Gets or sets a Color for the selected series.DataUnitgetDataMax()Get the selected series max data valuejava.util.DategetDataMaxDateTime()Description goes here.doublegetDataMaxDouble()Description goes here.TimeSpangetDataMaxTimeSpan()Description goes here.DataUnitgetDataMin()Get the selected series min data valuejava.util.DategetDataMinDateTime()Description goes here.doublegetDataMinDouble()Description goes here.TimeSpangetDataMinTimeSpan()Description goes here.GallerygetGallery()Gets or sets the gallery type for a particular series.java.awt.FontgetMarkerFont()Gets or sets a wingding font for use as marker shapes.shortgetMarkerStep()Controls how frequently point markers are shown in the selected series.intgetOriginalPosition()Returns the original position of the item in the SeriesAttributes Collection.PanegetPane()Gets or sets the Pane which the series belongs to.SeriesStudygetStudy()Provides access to the SeriesStudy properties of the series.booleanisStacked()Gets or sets a value allowing you to stack the selected series with the previous series to achieve multi-stacked charts.booleanisVisible()Gets or sets a value allowing you to show or hide the series.voidresetOriginalPosition()Set the property OriginalPosition to its default value.voidsendToBack()Sends a SeriesAttributes to the last position in the SeriesAttributes Collection.Displays the series to the back of the chart.voidsetAxisX(AxisX value)Gets or sets a value indicating the AxisX the series is connected to.voidsetAxisY(AxisY value)Gets or sets a value indicating the AxisY the series is connected to.voidsetColor(java.awt.Color value)Gets or sets a Color for the selected series.voidsetGallery(Gallery value)Gets or sets the gallery type for a particular series.voidsetMarkerFont(java.awt.Font value)Gets or sets a wingding font for use as marker shapes.voidsetMarkerStep(short value)Controls how frequently point markers are shown in the selected series.voidsetOriginalPosition(int value)Returns the original position of the item in the SeriesAttributes Collection.voidsetPane(Pane value)Gets or sets the Pane which the series belongs to.voidsetStacked(boolean value)Gets or sets a value allowing you to stack the selected series with the previous series to achieve multi-stacked charts.voidsetVisible(boolean value)Gets or sets a value allowing you to show or hide the series.-
Methods inherited from class com.softwarefx.chartfx.server.PointAttributes
getAlternateColor, getBarShape, getBorder, getEffects, getFillMode, getLine, getLink, getMarkerShape, getMarkerShapeCharacter, getMarkerSize, getMarkerStyle, getMarkerTemplate, getMarkerWidth, getPattern, getPicture, getPointLabels, getSeparateSlice, getTag, getText, getVolume, setAlternateColor, setBarShape, setFillMode, setMarkerShape, setMarkerShapeCharacter, setMarkerSize, setMarkerStyle, setMarkerTemplate, setMarkerWidth, setPattern, setPicture, setSeparateSlice, setTag, setText, setVolume
-
-
-
-
Constructor Detail
-
SeriesAttributes
public SeriesAttributes()
Constructs a newly allocated SeriesAttributes object
-
-
Method Detail
-
getAxisX
public AxisX getAxisX()
Gets or sets a value indicating the AxisX the series is connected to.
- You may only assign a series to an AxisX object if the series contains XY data. The X method of the
SeriesAttributesclass allows you to assign XValues in a chart. - The
setAxesXmethod is used to access the AxisXCollection for a chart. ThesetAxisXmethod is used to assign a data series to one of the existing AxisX items in the AxisXCollection. - The
setAxisYmethod gets or sets a value indicating the AxisY the series is connected to. - Here is an example of a chart with a secondary X Axis. Each series is connected to a different XAxis (notice the use of axis
setTextColorto help axis affiliation):
PopulateCarProduction(chart1);
chart1.getTitles().add(new TitleDockable("Vehicles Production by Quarter"));
AxisX axis;
axis = new AxisX();
axis.getGrids().getMajor().setVisible(true);
axis.setMin(0);
axis.setMax(12);
axis.setStep(3);
axis.setChartFont(new java.awt.Font("Segoe UI",java.awt.Font.PLAIN, 10));
axis.setTextColor(new java.awt.Color(255,0,0,255));
axis.getGrids().getMajor().setVisible(true);
axis.getLabels().set((short)0, "1st Q");
axis.getLabels().set((short)3, "2nd Q");
axis.getLabels().set((short)6, "3rd Q");
axis.getLabels().set((short)9, "4th Q");
chart1.getAxesX().add(axis);
public static void PopulateCarProduction(Chart chart1) { CarProduction[] production = new CarProduction[] { new CarProduction("Jan", 1760, 535, 695 ) , new CarProduction("Feb", 1849, 395, 688 ) , new CarProduction("Mar", 2831, 685, 1047 ) , new CarProduction("Apr", 2851, 984, 1652 ) , new CarProduction("May", 2961, 1579, 1889 ) , new CarProduction("Jun", 1519, 1539, 1766 ) , new CarProduction("Jul", 2633, 1489, 1361 ) , new CarProduction("Aug", 1140, 650, 874 ) , new CarProduction("Sep", 1626, 653, 693 ) , new CarProduction("Oct", 1478, 2236, 786 ) , new CarProduction("Nov", 1306, 1937, 599 ) , new CarProduction("Dec", 1607, 2138, 678 ) }; ObjectProvider objProvider = new ObjectProvider(production); chart1.getDataSourceSettings().setDataSource(objProvider); }public static class CarProduction { private CarProduction(String month, int sedan, int coupe, int SUV) { this.setMonth(month); this.setSedan(sedan); this.setCoupe(coupe); this.setSUV(SUV); } private String privateMonth; public final String getMonth() { return privateMonth; } public final void setMonth(String value) { privateMonth = value; } private int privateSedan; public final int getSedan() { return privateSedan; } public final void setSedan(int value) { privateSedan = value; } private int privateCoupe; public final int getCoupe() { return privateCoupe; } public final void setCoupe(int value) { privateCoupe = value; } private int privateSUV; public final int getSUV() { return privateSUV; } public final void setSUV(int value) { privateSUV = value; } }
Connecting a series to the second AxisX is as easy as specifying it through the
setAxisXmethod of the series:chart1.getAxesX().add(new AxisX()); chart1.getSeries().get(0).setAxisX(chart1.getAxesX().get(1));
- You may only assign a series to an AxisX object if the series contains XY data. The X method of the
-
setAxisX
public void setAxisX(AxisX value)
Gets or sets a value indicating the AxisX the series is connected to.
- You may only assign a series to an AxisX object if the series contains XY data. The X method of the
SeriesAttributesclass allows you to assign XValues in a chart. - The
setAxesXmethod is used to access the AxisXCollection for a chart. ThesetAxisXmethod is used to assign a data series to one of the existing AxisX items in the AxisXCollection. - The
setAxisYmethod gets or sets a value indicating the AxisY the series is connected to. - Here is an example of a chart with a secondary X Axis. Each series is connected to a different XAxis (notice the use of axis
setTextColorto help axis affiliation):
PopulateCarProduction(chart1);
chart1.getTitles().add(new TitleDockable("Vehicles Production by Quarter"));
AxisX axis;
axis = new AxisX();
axis.getGrids().getMajor().setVisible(true);
axis.setMin(0);
axis.setMax(12);
axis.setStep(3);
axis.setChartFont(new java.awt.Font("Segoe UI",java.awt.Font.PLAIN, 10));
axis.setTextColor(new java.awt.Color(255,0,0,255));
axis.getGrids().getMajor().setVisible(true);
axis.getLabels().set((short)0, "1st Q");
axis.getLabels().set((short)3, "2nd Q");
axis.getLabels().set((short)6, "3rd Q");
axis.getLabels().set((short)9, "4th Q");
chart1.getAxesX().add(axis);
public static void PopulateCarProduction(Chart chart1) { CarProduction[] production = new CarProduction[] { new CarProduction("Jan", 1760, 535, 695 ) , new CarProduction("Feb", 1849, 395, 688 ) , new CarProduction("Mar", 2831, 685, 1047 ) , new CarProduction("Apr", 2851, 984, 1652 ) , new CarProduction("May", 2961, 1579, 1889 ) , new CarProduction("Jun", 1519, 1539, 1766 ) , new CarProduction("Jul", 2633, 1489, 1361 ) , new CarProduction("Aug", 1140, 650, 874 ) , new CarProduction("Sep", 1626, 653, 693 ) , new CarProduction("Oct", 1478, 2236, 786 ) , new CarProduction("Nov", 1306, 1937, 599 ) , new CarProduction("Dec", 1607, 2138, 678 ) }; ObjectProvider objProvider = new ObjectProvider(production); chart1.getDataSourceSettings().setDataSource(objProvider); }public static class CarProduction { private CarProduction(String month, int sedan, int coupe, int SUV) { this.setMonth(month); this.setSedan(sedan); this.setCoupe(coupe); this.setSUV(SUV); } private String privateMonth; public final String getMonth() { return privateMonth; } public final void setMonth(String value) { privateMonth = value; } private int privateSedan; public final int getSedan() { return privateSedan; } public final void setSedan(int value) { privateSedan = value; } private int privateCoupe; public final int getCoupe() { return privateCoupe; } public final void setCoupe(int value) { privateCoupe = value; } private int privateSUV; public final int getSUV() { return privateSUV; } public final void setSUV(int value) { privateSUV = value; } }
Connecting a series to the second AxisX is as easy as specifying it through the
setAxisXmethod of the series:chart1.getAxesX().add(new AxisX()); chart1.getSeries().get(0).setAxisX(chart1.getAxesX().get(1));
- Parameters:
value-
- You may only assign a series to an AxisX object if the series contains XY data. The X method of the
-
getAxisY
public AxisY getAxisY()
Gets or sets a value indicating the AxisY the series is connected to.
- The
setAxesYmethod is used to access the AxisYCollection for a chart. ThesetAxisYmethod is used to assign a data series to one of the existing AxisY items in the AxisYCollection. - The
setAxisXmethod gets or sets a value indicating the AxisX the series is connected to. - Here is an example of a chart with a secondary Y Axis. Each series is connected to a different YAxis (notice the use of axis
setTextColorto help axis affiliation):
PopulateCompanyDataBubble_Strength_PE(chart1);
chart1.getTitles().add(new TitleDockable("Companies Fundamentals"));
SeriesAttributes series1;
series1 = chart1.getSeries().get(1);
series1.setAxisY(chart1.getAxisY2());
series1.setGallery(Gallery.BAR);
chart1.getAxisY().getLabelsFormat().setDecimals(2);
chart1.getAxisY2().getGrids().getMajor().setTickMark(TickMark.NONE);
chart1.getAxisY2().setTextColor(new java.awt.Color(255,0,0,255));
public static void PopulateCompanyDataBubble_Strength_PE(Chart chart1) { CompanyDataBubble[] companyData = new CompanyDataBubble[]{ new CompanyDataBubble("DODC", 0.97, 85, 39), new CompanyDataBubble("HPLA", 0.75, 74, 54), new CompanyDataBubble("FSTW", 0.73, 74, 23), new CompanyDataBubble("HYSL", 0.83, 72, 55), new CompanyDataBubble("COOG", 0.82, 68, 52), new CompanyDataBubble("JDEC", 0.64, 68, 37), new CompanyDataBubble("OTEX", 0.65, 65, 22), new CompanyDataBubble("NTIQ", 0.52, 60, 24), new CompanyDataBubble("OOGN", 0.59, 58, 39), new CompanyDataBubble("ORCL", 0.54, 58, 65), new CompanyDataBubble("SY", 0.71, 58, 7), new CompanyDataBubble("PRGS", 0.69, 57, 19), new CompanyDataBubble("TALX", 0.34, 54, 16), new CompanyDataBubble("TTS", 0.38, 54, 4), new CompanyDataBubble("PRSE", 0.44, 50, 6), new CompanyDataBubble("BCBJ", 0.37, 48, 0), new CompanyDataBubble("DCTM", 0.53, 46, 67), new CompanyDataBubble("ULCM", 0.31, 44, 71), new CompanyDataBubble("MERQ", 0.56, 43, 38), new CompanyDataBubble("ATRS", 0.78, 42, 0), new CompanyDataBubble("JDAS", 0.34, 41, 32), new CompanyDataBubble("SAP", 0.48, 40, 11), new CompanyDataBubble("VRTY", 0.49, 39, 80), new CompanyDataBubble("PSFT", 0.38, 38, 42), new CompanyDataBubble("SRNA", 0.35, 36, 39), new CompanyDataBubble("SPSS", 0.58, 36, 18), new CompanyDataBubble("QSFT", 0.32, 35, 68), new CompanyDataBubble("PTEC", 0.51, 34, 10), new CompanyDataBubble("BMC", 0.58, 32, 37), new CompanyDataBubble("CTXS", 0.16, 32, 9), new CompanyDataBubble("PDFS", 0.22, 31, 18), new CompanyDataBubble("MRCL", 0.3, 30, 22), new CompanyDataBubble("CA", 0.24, 30, 33), new CompanyDataBubble("VRTS", 0.36, 29, 12), new CompanyDataBubble("TIBX", 0.31, 28, 6), new CompanyDataBubble("LTBG", 0.47, 23, 18), new CompanyDataBubble("RATL", 0.26, 23, 23), new CompanyDataBubble("SEBL", 0.23, 19, 15), new CompanyDataBubble("LWSN", 0.27, 16, 13) }; ObjectProvider objProvider = new ObjectProvider(companyData); chart1.getDataSourceSettings().setDataSource(objProvider); // Since not all the fields in the DataSource are required, we must specify the number // of series that will be contained in the chart and perform the corresponding bindings chart1.getData().setSeries(2); NumericDataField numericFieldStrength = new NumericDataField(); numericFieldStrength.setDataPath("Strength"); chart1.getDataSourceSettings().getDataFields().add(numericFieldStrength); chart1.getSeries().get(0).getBindings().setY(numericFieldStrength); NumericDataField numericFieldPE = new NumericDataField(); numericFieldPE.setDataPath("PE"); chart1.getDataSourceSettings().getDataFields().add(numericFieldPE); chart1.getSeries().get(1).getBindings().setY(numericFieldPE); StringDataField stringFieldMonth = new StringDataField(); stringFieldMonth.setDataPath("Symbol"); chart1.getDataSourceSettings().getDataFields().add(stringFieldMonth); chart1.getAxisX().getBindings().setLabel(stringFieldMonth); }public static void PopulateCompanyDataBubble(Chart chart1) { CompanyDataBubble[] companyData = new CompanyDataBubble[]{ new CompanyDataBubble("DODC", 0.97, 85, 39), new CompanyDataBubble("HPLA", 0.75, 74, 54), new CompanyDataBubble("FSTW", 0.73, 74, 23), new CompanyDataBubble("HYSL", 0.83, 72, 55), new CompanyDataBubble("COOG", 0.82, 68, 52), new CompanyDataBubble("JDEC", 0.64, 68, 37), new CompanyDataBubble("OTEX", 0.65, 65, 22), new CompanyDataBubble("NTIQ", 0.52, 60, 24), new CompanyDataBubble("OOGN", 0.59, 58, 39), new CompanyDataBubble("ORCL", 0.54, 58, 65), new CompanyDataBubble("SY", 0.71, 58, 7), new CompanyDataBubble("PRGS", 0.69, 57, 19), new CompanyDataBubble("TALX", 0.34, 54, 16), new CompanyDataBubble("TTS", 0.38, 54, 4), new CompanyDataBubble("PRSE", 0.44, 50, 6), new CompanyDataBubble("BCBJ", 0.37, 48, 0), new CompanyDataBubble("DCTM", 0.53, 46, 67), new CompanyDataBubble("ULCM", 0.31, 44, 71), new CompanyDataBubble("MERQ", 0.56, 43, 38), new CompanyDataBubble("ATRS", 0.78, 42, 0), new CompanyDataBubble("JDAS", 0.34, 41, 32), new CompanyDataBubble("SAP", 0.48, 40, 11), new CompanyDataBubble("VRTY", 0.49, 39, 80), new CompanyDataBubble("PSFT", 0.38, 38, 42), new CompanyDataBubble("SRNA", 0.35, 36, 39), new CompanyDataBubble("SPSS", 0.58, 36, 18), new CompanyDataBubble("QSFT", 0.32, 35, 68), new CompanyDataBubble("PTEC", 0.51, 34, 10), new CompanyDataBubble("BMC", 0.58, 32, 37), new CompanyDataBubble("CTXS", 0.16, 32, 9), new CompanyDataBubble("PDFS", 0.22, 31, 18), new CompanyDataBubble("MRCL", 0.3, 30, 22), new CompanyDataBubble("CA", 0.24, 30, 33), new CompanyDataBubble("VRTS", 0.36, 29, 12), new CompanyDataBubble("TIBX", 0.31, 28, 6), new CompanyDataBubble("LTBG", 0.47, 23, 18), new CompanyDataBubble("RATL", 0.26, 23, 23), new CompanyDataBubble("SEBL", 0.23, 19, 15), new CompanyDataBubble("LWSN", 0.27, 16, 13) }; ObjectProvider objProvider = new ObjectProvider(companyData); chart1.getDataSourceSettings().setDataSource(objProvider); DataFieldCollection dataFieldCollection = chart1.getDataSourceSettings().getDataFields(); StringDataField dfSymbol = new StringDataField(); dfSymbol.setDataPath("Symbol"); NumericDataField dfStrength = new NumericDataField(); dfStrength.setDataPath("Strength"); NumericDataField dfRank = new NumericDataField(); dfRank.setDataPath("Rank"); NumericDataField dfPE = new NumericDataField(); dfPE.setDataPath("PE"); dataFieldCollection.add(dfSymbol); dataFieldCollection.add(dfStrength); dataFieldCollection.add(dfRank); dataFieldCollection.add(dfPE); chart1.getData().setSeries(2); SeriesBindings series0Bindings = chart1.getSeries().get(0).getBindings(); SeriesBindings series1Bindings = chart1.getSeries().get(1).getBindings(); series0Bindings.setX(dfStrength); series1Bindings.setX(dfStrength); series0Bindings.setY(dfRank); series1Bindings.setY(dfPE); chart1.getDataSourceSettings().readData(); }public static class CompanyDataBubble { public CompanyDataBubble(String symbol, double strengh, double rank, double pe) { this.setSymbol(symbol); this.setStrength(strengh); this.setRank(rank); this.setPE(pe); } private String privateSymbol; public final String getSymbol() { return privateSymbol; } public final void setSymbol(String value) { privateSymbol = value; } private double privateStrength; public final double getStrength() { return privateStrength; } public final void setStrength(double value) { privateStrength = value; } private double privateRank; public final double getRank() { return privateRank; } public final void setRank(double value) { privateRank = value; } private double privatePE; public final double getPE() { return privatePE; } public final void setPE(double value) { privatePE = value; } }
Notice that connecting the second series to the second AxisY is as easy as specifying it through the
setAxisYmethod of the series:SeriesAttributes series1; series1 = chart1.getSeries().get(1); series1.setAxisY(chart1.getAxisY2());
- The
-
setAxisY
public void setAxisY(AxisY value)
Gets or sets a value indicating the AxisY the series is connected to.
- The
setAxesYmethod is used to access the AxisYCollection for a chart. ThesetAxisYmethod is used to assign a data series to one of the existing AxisY items in the AxisYCollection. - The
setAxisXmethod gets or sets a value indicating the AxisX the series is connected to. - Here is an example of a chart with a secondary Y Axis. Each series is connected to a different YAxis (notice the use of axis
setTextColorto help axis affiliation):
PopulateCompanyDataBubble_Strength_PE(chart1);
chart1.getTitles().add(new TitleDockable("Companies Fundamentals"));
SeriesAttributes series1;
series1 = chart1.getSeries().get(1);
series1.setAxisY(chart1.getAxisY2());
series1.setGallery(Gallery.BAR);
chart1.getAxisY().getLabelsFormat().setDecimals(2);
chart1.getAxisY2().getGrids().getMajor().setTickMark(TickMark.NONE);
chart1.getAxisY2().setTextColor(new java.awt.Color(255,0,0,255));
public static void PopulateCompanyDataBubble_Strength_PE(Chart chart1) { CompanyDataBubble[] companyData = new CompanyDataBubble[]{ new CompanyDataBubble("DODC", 0.97, 85, 39), new CompanyDataBubble("HPLA", 0.75, 74, 54), new CompanyDataBubble("FSTW", 0.73, 74, 23), new CompanyDataBubble("HYSL", 0.83, 72, 55), new CompanyDataBubble("COOG", 0.82, 68, 52), new CompanyDataBubble("JDEC", 0.64, 68, 37), new CompanyDataBubble("OTEX", 0.65, 65, 22), new CompanyDataBubble("NTIQ", 0.52, 60, 24), new CompanyDataBubble("OOGN", 0.59, 58, 39), new CompanyDataBubble("ORCL", 0.54, 58, 65), new CompanyDataBubble("SY", 0.71, 58, 7), new CompanyDataBubble("PRGS", 0.69, 57, 19), new CompanyDataBubble("TALX", 0.34, 54, 16), new CompanyDataBubble("TTS", 0.38, 54, 4), new CompanyDataBubble("PRSE", 0.44, 50, 6), new CompanyDataBubble("BCBJ", 0.37, 48, 0), new CompanyDataBubble("DCTM", 0.53, 46, 67), new CompanyDataBubble("ULCM", 0.31, 44, 71), new CompanyDataBubble("MERQ", 0.56, 43, 38), new CompanyDataBubble("ATRS", 0.78, 42, 0), new CompanyDataBubble("JDAS", 0.34, 41, 32), new CompanyDataBubble("SAP", 0.48, 40, 11), new CompanyDataBubble("VRTY", 0.49, 39, 80), new CompanyDataBubble("PSFT", 0.38, 38, 42), new CompanyDataBubble("SRNA", 0.35, 36, 39), new CompanyDataBubble("SPSS", 0.58, 36, 18), new CompanyDataBubble("QSFT", 0.32, 35, 68), new CompanyDataBubble("PTEC", 0.51, 34, 10), new CompanyDataBubble("BMC", 0.58, 32, 37), new CompanyDataBubble("CTXS", 0.16, 32, 9), new CompanyDataBubble("PDFS", 0.22, 31, 18), new CompanyDataBubble("MRCL", 0.3, 30, 22), new CompanyDataBubble("CA", 0.24, 30, 33), new CompanyDataBubble("VRTS", 0.36, 29, 12), new CompanyDataBubble("TIBX", 0.31, 28, 6), new CompanyDataBubble("LTBG", 0.47, 23, 18), new CompanyDataBubble("RATL", 0.26, 23, 23), new CompanyDataBubble("SEBL", 0.23, 19, 15), new CompanyDataBubble("LWSN", 0.27, 16, 13) }; ObjectProvider objProvider = new ObjectProvider(companyData); chart1.getDataSourceSettings().setDataSource(objProvider); // Since not all the fields in the DataSource are required, we must specify the number // of series that will be contained in the chart and perform the corresponding bindings chart1.getData().setSeries(2); NumericDataField numericFieldStrength = new NumericDataField(); numericFieldStrength.setDataPath("Strength"); chart1.getDataSourceSettings().getDataFields().add(numericFieldStrength); chart1.getSeries().get(0).getBindings().setY(numericFieldStrength); NumericDataField numericFieldPE = new NumericDataField(); numericFieldPE.setDataPath("PE"); chart1.getDataSourceSettings().getDataFields().add(numericFieldPE); chart1.getSeries().get(1).getBindings().setY(numericFieldPE); StringDataField stringFieldMonth = new StringDataField(); stringFieldMonth.setDataPath("Symbol"); chart1.getDataSourceSettings().getDataFields().add(stringFieldMonth); chart1.getAxisX().getBindings().setLabel(stringFieldMonth); }public static void PopulateCompanyDataBubble(Chart chart1) { CompanyDataBubble[] companyData = new CompanyDataBubble[]{ new CompanyDataBubble("DODC", 0.97, 85, 39), new CompanyDataBubble("HPLA", 0.75, 74, 54), new CompanyDataBubble("FSTW", 0.73, 74, 23), new CompanyDataBubble("HYSL", 0.83, 72, 55), new CompanyDataBubble("COOG", 0.82, 68, 52), new CompanyDataBubble("JDEC", 0.64, 68, 37), new CompanyDataBubble("OTEX", 0.65, 65, 22), new CompanyDataBubble("NTIQ", 0.52, 60, 24), new CompanyDataBubble("OOGN", 0.59, 58, 39), new CompanyDataBubble("ORCL", 0.54, 58, 65), new CompanyDataBubble("SY", 0.71, 58, 7), new CompanyDataBubble("PRGS", 0.69, 57, 19), new CompanyDataBubble("TALX", 0.34, 54, 16), new CompanyDataBubble("TTS", 0.38, 54, 4), new CompanyDataBubble("PRSE", 0.44, 50, 6), new CompanyDataBubble("BCBJ", 0.37, 48, 0), new CompanyDataBubble("DCTM", 0.53, 46, 67), new CompanyDataBubble("ULCM", 0.31, 44, 71), new CompanyDataBubble("MERQ", 0.56, 43, 38), new CompanyDataBubble("ATRS", 0.78, 42, 0), new CompanyDataBubble("JDAS", 0.34, 41, 32), new CompanyDataBubble("SAP", 0.48, 40, 11), new CompanyDataBubble("VRTY", 0.49, 39, 80), new CompanyDataBubble("PSFT", 0.38, 38, 42), new CompanyDataBubble("SRNA", 0.35, 36, 39), new CompanyDataBubble("SPSS", 0.58, 36, 18), new CompanyDataBubble("QSFT", 0.32, 35, 68), new CompanyDataBubble("PTEC", 0.51, 34, 10), new CompanyDataBubble("BMC", 0.58, 32, 37), new CompanyDataBubble("CTXS", 0.16, 32, 9), new CompanyDataBubble("PDFS", 0.22, 31, 18), new CompanyDataBubble("MRCL", 0.3, 30, 22), new CompanyDataBubble("CA", 0.24, 30, 33), new CompanyDataBubble("VRTS", 0.36, 29, 12), new CompanyDataBubble("TIBX", 0.31, 28, 6), new CompanyDataBubble("LTBG", 0.47, 23, 18), new CompanyDataBubble("RATL", 0.26, 23, 23), new CompanyDataBubble("SEBL", 0.23, 19, 15), new CompanyDataBubble("LWSN", 0.27, 16, 13) }; ObjectProvider objProvider = new ObjectProvider(companyData); chart1.getDataSourceSettings().setDataSource(objProvider); DataFieldCollection dataFieldCollection = chart1.getDataSourceSettings().getDataFields(); StringDataField dfSymbol = new StringDataField(); dfSymbol.setDataPath("Symbol"); NumericDataField dfStrength = new NumericDataField(); dfStrength.setDataPath("Strength"); NumericDataField dfRank = new NumericDataField(); dfRank.setDataPath("Rank"); NumericDataField dfPE = new NumericDataField(); dfPE.setDataPath("PE"); dataFieldCollection.add(dfSymbol); dataFieldCollection.add(dfStrength); dataFieldCollection.add(dfRank); dataFieldCollection.add(dfPE); chart1.getData().setSeries(2); SeriesBindings series0Bindings = chart1.getSeries().get(0).getBindings(); SeriesBindings series1Bindings = chart1.getSeries().get(1).getBindings(); series0Bindings.setX(dfStrength); series1Bindings.setX(dfStrength); series0Bindings.setY(dfRank); series1Bindings.setY(dfPE); chart1.getDataSourceSettings().readData(); }public static class CompanyDataBubble { public CompanyDataBubble(String symbol, double strengh, double rank, double pe) { this.setSymbol(symbol); this.setStrength(strengh); this.setRank(rank); this.setPE(pe); } private String privateSymbol; public final String getSymbol() { return privateSymbol; } public final void setSymbol(String value) { privateSymbol = value; } private double privateStrength; public final double getStrength() { return privateStrength; } public final void setStrength(double value) { privateStrength = value; } private double privateRank; public final double getRank() { return privateRank; } public final void setRank(double value) { privateRank = value; } private double privatePE; public final double getPE() { return privatePE; } public final void setPE(double value) { privatePE = value; } }
Notice that connecting the second series to the second AxisY is as easy as specifying it through the
setAxisYmethod of the series:SeriesAttributes series1; series1 = chart1.getSeries().get(1); series1.setAxisY(chart1.getAxisY2());
- Parameters:
value-
- The
-
getBindings
public SeriesAttributes.SeriesBindings getBindings()
Provides access to the SeriesAttributes.SeriesBindings properties of the series.
-
getColor
public java.awt.Color getColor()
Gets or sets a Color for the selected series.
If no colors are specified, The default color is automatically selected by Chart FX when you create the chart, and chosen according to the current palette and its position in the series array.
Named color are supported (e.g. Red), to use Hex notation you have to use quotes (e.g. "#FF00FF").
For more information regarding the Color type, please refer to the Documentation.
Change the color of the first series to HotPink:
chart1.getSeries().get(0).setColor(new java.awt.Color(255,105,180,255));
- Overrides:
getColorin classPointAttributes
-
setColor
public void setColor(java.awt.Color value)
Gets or sets a Color for the selected series.
If no colors are specified, The default color is automatically selected by Chart FX when you create the chart, and chosen according to the current palette and its position in the series array.
Named color are supported (e.g. Red), to use Hex notation you have to use quotes (e.g. "#FF00FF").
For more information regarding the Color type, please refer to the Documentation.
Change the color of the first series to HotPink:
chart1.getSeries().get(0).setColor(new java.awt.Color(255,105,180,255));
- Overrides:
setColorin classPointAttributes- Parameters:
value-
-
getDataMaxTimeSpan
public TimeSpan getDataMaxTimeSpan()
Description goes here. This member is an Implicit conversion from DataMax member.
-
getDataMax
public DataUnit getDataMax()
Get the selected series max data value
-
getDataMaxDouble
public double getDataMaxDouble()
Description goes here. This member is an Implicit conversion from DataMax member.
-
getDataMaxDateTime
public java.util.Date getDataMaxDateTime()
Description goes here. This member is an Implicit conversion from DataMax member.
-
getDataMinTimeSpan
public TimeSpan getDataMinTimeSpan()
Description goes here. This member is an Implicit conversion from DataMin member.
-
getDataMin
public DataUnit getDataMin()
Get the selected series min data value
-
getDataMinDouble
public double getDataMinDouble()
Description goes here. This member is an Implicit conversion from DataMin member.
-
getDataMinDateTime
public java.util.Date getDataMinDateTime()
Description goes here. This member is an Implicit conversion from DataMin member.
-
getGallery
public Gallery getGallery()
Gets or sets the gallery type for a particular series. All chart types are available in both 2D and 3D modes.
Applying this method to a specific series will create a MultiType chart, where different Chart Types can be combined in the same chart.
You must be careful of the chart types you select to combine as not all of them will produce desirable results. For example, combining a chart that does not have numerical axis (e.g. Pie Chart) with a chart that has a numerical axis (e.g. Line Chart) will produce a chart that can't be read by the end user.
A rule of thumb is that you can combine axis charts with similar types and non-axis charts with similar types, as follows:
Axis Charts: Lines, Bar, Curve, Scatter, Area, Step, HiLowClose, Cube, Bubble, CandleStick, CurveArea, OpenHiLowClose, Pareto.
Non-axis charts:Pie, Radar, Doughnut, Pyramid and Funnel.
Note: Gantt, Surface and Contour can't be combined with other chart types.Another important issue to keep in mind when creating MultiType charts is the number of series each chart type requires to properly plot the data. For example, an Open-Hi-Lo-Close chart requires 4 consecutive series to properly plot the data, so if you want to combine this chart type with a line chart, the series containing the data for the line chart must be either the first or the last series in the data set.
To set the 2nd series to line:
chart1.getSeries().get(1).setGallery(Gallery.LINES);
-
setGallery
public void setGallery(Gallery value)
Gets or sets the gallery type for a particular series. All chart types are available in both 2D and 3D modes.
Applying this method to a specific series will create a MultiType chart, where different Chart Types can be combined in the same chart.
You must be careful of the chart types you select to combine as not all of them will produce desirable results. For example, combining a chart that does not have numerical axis (e.g. Pie Chart) with a chart that has a numerical axis (e.g. Line Chart) will produce a chart that can't be read by the end user.
A rule of thumb is that you can combine axis charts with similar types and non-axis charts with similar types, as follows:
Axis Charts: Lines, Bar, Curve, Scatter, Area, Step, HiLowClose, Cube, Bubble, CandleStick, CurveArea, OpenHiLowClose, Pareto.
Non-axis charts:Pie, Radar, Doughnut, Pyramid and Funnel.
Note: Gantt, Surface and Contour can't be combined with other chart types.Another important issue to keep in mind when creating MultiType charts is the number of series each chart type requires to properly plot the data. For example, an Open-Hi-Lo-Close chart requires 4 consecutive series to properly plot the data, so if you want to combine this chart type with a line chart, the series containing the data for the line chart must be either the first or the last series in the data set.
To set the 2nd series to line:
chart1.getSeries().get(1).setGallery(Gallery.LINES);
- Parameters:
value-
-
getMarkerFont
public java.awt.Font getMarkerFont()
Gets or sets a wingding font for use as marker shapes.chart1.getAllSeries().setMarkerFont(new java.awt.Font("Wingdings2",java.awt.Font.PLAIN, 12));
-
setMarkerFont
public void setMarkerFont(java.awt.Font value)
Gets or sets a wingding font for use as marker shapes.chart1.getAllSeries().setMarkerFont(new java.awt.Font("Wingdings2",java.awt.Font.PLAIN, 12));
- Parameters:
value-
-
getMarkerStep
public short getMarkerStep()
Controls how frequently point markers are shown in the selected series.chart1.getAllSeries().setMarkerStep((short)20);
-
setMarkerStep
public void setMarkerStep(short value)
Controls how frequently point markers are shown in the selected series.chart1.getAllSeries().setMarkerStep((short)20);
- Parameters:
value-
-
getOriginalPosition
public int getOriginalPosition()
Returns the original position of the item in the SeriesAttributes Collection.int orgPos; orgPos = chart1.getSeries().get(0).getOriginalPosition();
- See Also:
resetOriginalPosition
-
setOriginalPosition
public void setOriginalPosition(int value)
Returns the original position of the item in the SeriesAttributes Collection.int orgPos; orgPos = chart1.getSeries().get(0).getOriginalPosition();
- Parameters:
value-- See Also:
resetOriginalPosition
-
getPane
public Pane getPane()
Gets or sets the Pane which the series belongs to.chart1.getPanes().add(new Pane()); chart1.getSeries().get(0).setPane(chart1.getPanes().get(1));
-
setPane
public void setPane(Pane value)
Gets or sets the Pane which the series belongs to.chart1.getPanes().add(new Pane()); chart1.getSeries().get(0).setPane(chart1.getPanes().get(1));
- Parameters:
value-
-
isStacked
public boolean isStacked()
Gets or sets a value allowing you to stack the selected series with the previous series to achieve multi-stacked charts.
Stacked options apply only to Bar and Area charts. So before applying this method, you must make sure the previous series and the selected series are of the same type (Bar or Area).
To set a stacked chart for the 1st and 2nd series:
chart1.getSeries().get(0).setStacked(true);
chart1.getSeries().get(1).setStacked(true);
-
setStacked
public void setStacked(boolean value)
Gets or sets a value allowing you to stack the selected series with the previous series to achieve multi-stacked charts.
Stacked options apply only to Bar and Area charts. So before applying this method, you must make sure the previous series and the selected series are of the same type (Bar or Area).
To set a stacked chart for the 1st and 2nd series:
chart1.getSeries().get(0).setStacked(true);
chart1.getSeries().get(1).setStacked(true);
- Parameters:
value-
-
getStudy
public SeriesStudy getStudy()
Provides access to the SeriesStudy properties of the series.
SeriesAttributes series;
series = new SeriesAttributes();
series.getStudy().setSeriesStudyType(SeriesStudyType.LinearRegression);
series.getStudy().getTargetSeries().setSeriesIndex(1);
chart1.getSeries().add(series);
java.lang.String studyType;
studyType = new SeriesStudyType(series.getStudy().getSeriesStudyType()).toString();
-
isVisible
public boolean isVisible()
Gets or sets a value allowing you to show or hide the series.
Hiding a Series will:
- not recalculate any of the scale values for the axis.
- not remove the data associated with it.
- hide the legend associated with it from the Series Legend.
- hide all the data points in the DataGrid.
Hiding a Series will:
- not recalculate any of the scale values for the axis.
- not remove the data associated with it.
- hide the legend associated with it from the Series Legend.
- hide all the data points in the
setDataGridIf you hide a Series and want Chart FX to recalculate the axis scale values, you must invoke the
recalculateScalemethod when you show and/or hide the selected Series.You can also display hidden series in the data grid using the
isShowHiddenSeriesof theSeriesAttributesclassHide the 1st series:
chart1.getSeries().get(0).setVisible(false);
-
setVisible
public void setVisible(boolean value)
Gets or sets a value allowing you to show or hide the series.
Hiding a Series will:
- not recalculate any of the scale values for the axis.
- not remove the data associated with it.
- hide the legend associated with it from the Series Legend.
- hide all the data points in the DataGrid.
Hiding a Series will:
- not recalculate any of the scale values for the axis.
- not remove the data associated with it.
- hide the legend associated with it from the Series Legend.
- hide all the data points in the
setDataGridIf you hide a Series and want Chart FX to recalculate the axis scale values, you must invoke the
recalculateScalemethod when you show and/or hide the selected Series.You can also display hidden series in the data grid using the
isShowHiddenSeriesof theSeriesAttributesclassHide the 1st series:
chart1.getSeries().get(0).setVisible(false);
- Parameters:
value-
-
bringToFront
public void bringToFront()
Sends a SeriesAttributes to the first position in the SeriesAttributes Collection.Displays the series to the front of the chart.By utilizing the
BringToFront andsendToBackmembers, developers may control the order of SeriesAttributes in the chart. This method may be used to determine the original starting position for a selected SeriesAttributes object in the SeriesAttributesCollection.The user interface controls enable end users to order series. This method is useful to determine the original position of a SeriesAttributes object when this has occured.
The
setOriginalPositionmethod returns the original position of the item in the SeriesAttributes Collection.To display the first series to the Front:
chart1.getSeries().get(0).bringToFront();
-
drawMarker
public void drawMarker(java.awt.Graphics2D g,
              java.awt.Point pt,
              int item,
              int radius,
              boolean drawLine)
Used to draw a marker on a selected device context.
This method allows you to draw a markers to a selected device context without ever assigning the values to a chart.
To draw a marker to a form using the
drawMarkermethod:- Parameters:
g- A Graphics object associated with a specific device context.pt- A Point object with the desired X and Y coordinates where the marker will be drawn.item- Controls the size of the markershape.radius- Index of the marker item you wish to draw. (If a specific point index has been assigned special attributes you want to use, i.e. MarkerShape) Set to -1 to use default series assignments.drawLine- Specifies if the markers will have a line on either side of the marker. (Simulate markers in a line chart)
-
resetOriginalPosition
public void resetOriginalPosition()
Set the property OriginalPosition to its default value.- See Also:
setOriginalPosition
-
sendToBack
public void sendToBack()
Sends a SeriesAttributes to the last position in the SeriesAttributes Collection.Displays the series to the back of the chart.By utilizing the
bringToFrontandSendToBack members, developers may control the order of SeriesAttributes in the chart. This method may be used to determine the original starting position for a selected SeriesAttributes object in the SeriesAttributesCollection.The user interface controls enable end users to order series. This method is useful to determine the original position of a SeriesAttributes object when this has occured.
The
setOriginalPositionmethod returns the original position of the item in the SeriesAttributes Collection.To display the first series to the back:
chart1.getSeries().get(0).sendToBack();
-
-