- java.lang.Object
-
- com.softwarefx.chartfx.server.DataValues
-
public final class DataValues
extends java.lang.Object
Provides access to the DataValues object which is the key component to pass data to the chart.
You can also assign x-values to create an XY Plot using the X method.
You can set initial values using the
setYFrommethod. Used in conjunction with the Y method, you can create a 'floating bars' effect for bar charts.Please note that instead of the value associated with the point, you can assign a hidden constant which will cause the point to be hidden in the chart. Although a hidden point is physically in the data array, when you use this constant the marker will not appear in the chart, and if you have charts like a line or area chart, the line will break at that particular point.
-
-
Constructor Summary
Constructors Constructor and Description DataValues()
-
Method Summary
Methods Modifier and Type Method and Description voidclear()Clears all the data values in the chart.booleancommitChanges()Finalizes chart data and invokes selected data related tasks.voidcompact(DataUnit step)Compacts the data in order to display more summarized information.voidcompact(java.util.Date step)Compacts the data in order to display more summarized information.voidcompact(double step)Compacts the data in order to display more summarized information.voidcompact(TimeSpan step)Compacts the data in order to display more summarized information.DataUnitget(int series, int point)Provides access to the Y value for the specific series and point.DataUnitgetCompactedBy()Gets or sets a value indicating the interval of units to compress data.java.util.DategetCompactedByDateTime()Gets or sets a value indicating the interval of units to compress data.doublegetCompactedByDouble()Gets or sets a value indicating the interval of units to compress data.TimeSpangetCompactedByTimeSpan()Gets or sets a value indicating the interval of units to compress data.java.util.DategetDateTime(int series, int point)Provides access to the Y value for the specific series and point.doublegetDouble(int series, int point)Provides access to the Y value for the specific series and point.java.util.List<java.lang.String>getLabels()Provides access to label collection of the main x-axis.intgetPoints()Gets or sets a value indicating the number of series allocated for the chart.intgetSeries()Gets or sets a value indicating the number of series allocated for the chart.TimeSpangetTimeSpan(int series, int point)Provides access to the Y value for the specific series and point.IDataArraygetX()Allows you to set X-Values for specific point of XY plots.IDataArraygetY()Allows you to access the Y coordinates of the data points.IDataArraygetYFrom()Allows you to set the starting Y-value for a specific value on the chart.booleanisAggressiveAllocation()Gets or sets a value indicating ChartFX should agreesively allocate space for future values.booleanisCompacted()Gets a value indicating whether or not the data is compacted.booleanisInitializeHidden()Gets or sets a value indicating to intialize all non-initialized values to hidden value.booleanisInterpolateHidden()Gets or sets a value specifying to draw a connecting line over a missing data point.voidrecalculateScale()Recalculates the scale of the chart based on the data available.voidremoveSeries(int seriesIndex)Remove a Series from the collection by index.voidresetCompactedBy()Set the property CompactedBy to its default value.voidresetFlags()Set the property Flags to its default value.voidset(int series, int point, DataUnit value)Provides access to the Y value for the specific series and point.voidset(int series, int point, java.util.Date value)Provides access to the Y value for the specific series and point.voidset(int series, int point, double value)Provides access to the Y value for the specific series and point.voidset(int series, int point, TimeSpan value)Provides access to the Y value for the specific series and point.voidsetAggressiveAllocation(boolean value)Gets or sets a value indicating ChartFX should agreesively allocate space for future values.voidsetCompactedBy(DataUnit value)Gets or sets a value indicating the interval of units to compress data.voidsetCompactedBy(java.util.Date value)Gets or sets a value indicating the interval of units to compress data.voidsetCompactedBy(double value)Gets or sets a value indicating the interval of units to compress data.voidsetCompactedBy(TimeSpan value)Gets or sets a value indicating the interval of units to compress data.voidsetInitializeHidden(boolean value)Gets or sets a value indicating to intialize all non-initialized values to hidden value.voidsetInterpolateHidden(boolean value)Gets or sets a value specifying to draw a connecting line over a missing data point.voidsetPoints(int value)Gets or sets a value indicating the number of series allocated for the chart.voidsetSeries(int value)Gets or sets a value indicating the number of series allocated for the chart.voidundoCompact()If the data is compacted, this method uncompacts the data and shows all values.
-
-
-
Method Detail
-
isAggressiveAllocation
public boolean isAggressiveAllocation()
Gets or sets a value indicating ChartFX should agreesively allocate space for future values. This increases performance at the cost of additional memory usage.chart1.getData().setAggressiveAllocation(true);
-
setAggressiveAllocation
public void setAggressiveAllocation(boolean value)
Gets or sets a value indicating ChartFX should agreesively allocate space for future values. This increases performance at the cost of additional memory usage.chart1.getData().setAggressiveAllocation(true);
- Parameters:
value-
-
isCompacted
public boolean isCompacted()
Gets a value indicating whether or not the data is compacted.boolean isCompacted; isCompacted = chart1.getData().getCompacted();
-
getCompactedByTimeSpan
public TimeSpan getCompactedByTimeSpan()
Gets or sets a value indicating the interval of units to compress data.
This method is used to configure the units for compression in the X Axis. If the XAxis has been passed DateTime XValues and has been formated for Date, the units represented by the
setCompactedBymethod would be Days. For example a value of 30 would be interperted into 1 Month. If you do not have configured XValues in the chart, then the unit base is 1 (categorical axis).The data compression features provide developers with a mechanism to display data in different intervals, summarizing historical data. The
compactmethod is used to complete the compacting process.The
isCompactedreturns a value indicating whether or not the data is compacted.The
undoCompactmethod is used to decompress compacted data and show all values.The
setDatamethod is used to access the DataValues object for a chart.To configure the number of units to Compact a chart to 30:
chart1.getData().setCompactedBy(5);
- See Also:
resetCompactedBy
-
setCompactedBy
public void setCompactedBy(TimeSpan value)
Gets or sets a value indicating the interval of units to compress data.
This method is used to configure the units for compression in the X Axis. If the XAxis has been passed DateTime XValues and has been formated for Date, the units represented by the
setCompactedBymethod would be Days. For example a value of 30 would be interperted into 1 Month. If you do not have configured XValues in the chart, then the unit base is 1 (categorical axis).The data compression features provide developers with a mechanism to display data in different intervals, summarizing historical data. The
compactmethod is used to complete the compacting process.The
isCompactedreturns a value indicating whether or not the data is compacted.The
undoCompactmethod is used to decompress compacted data and show all values.The
setDatamethod is used to access the DataValues object for a chart.To configure the number of units to Compact a chart to 30:
chart1.getData().setCompactedBy(5);
- Parameters:
value-- See Also:
resetCompactedBy
-
getCompactedBy
public DataUnit getCompactedBy()
Gets or sets a value indicating the interval of units to compress data.
This method is used to configure the units for compression in the X Axis. If the XAxis has been passed DateTime XValues and has been formated for Date, the units represented by the
setCompactedBymethod would be Days. For example a value of 30 would be interperted into 1 Month. If you do not have configured XValues in the chart, then the unit base is 1 (categorical axis).The data compression features provide developers with a mechanism to display data in different intervals, summarizing historical data. The
compactmethod is used to complete the compacting process.The
isCompactedreturns a value indicating whether or not the data is compacted.The
undoCompactmethod is used to decompress compacted data and show all values.The
setDatamethod is used to access the DataValues object for a chart.To configure the number of units to Compact a chart to 30:
chart1.getData().setCompactedBy(5);
- See Also:
resetCompactedBy
-
setCompactedBy
public void setCompactedBy(DataUnit value)
Gets or sets a value indicating the interval of units to compress data.
This method is used to configure the units for compression in the X Axis. If the XAxis has been passed DateTime XValues and has been formated for Date, the units represented by the
setCompactedBymethod would be Days. For example a value of 30 would be interperted into 1 Month. If you do not have configured XValues in the chart, then the unit base is 1 (categorical axis).The data compression features provide developers with a mechanism to display data in different intervals, summarizing historical data. The
compactmethod is used to complete the compacting process.The
isCompactedreturns a value indicating whether or not the data is compacted.The
undoCompactmethod is used to decompress compacted data and show all values.The
setDatamethod is used to access the DataValues object for a chart.To configure the number of units to Compact a chart to 30:
chart1.getData().setCompactedBy(5);
- Parameters:
value-- See Also:
resetCompactedBy
-
getCompactedByDouble
public double getCompactedByDouble()
Gets or sets a value indicating the interval of units to compress data.
This method is used to configure the units for compression in the X Axis. If the XAxis has been passed DateTime XValues and has been formated for Date, the units represented by the
setCompactedBymethod would be Days. For example a value of 30 would be interperted into 1 Month. If you do not have configured XValues in the chart, then the unit base is 1 (categorical axis).The data compression features provide developers with a mechanism to display data in different intervals, summarizing historical data. The
compactmethod is used to complete the compacting process.The
isCompactedreturns a value indicating whether or not the data is compacted.The
undoCompactmethod is used to decompress compacted data and show all values.The
setDatamethod is used to access the DataValues object for a chart.To configure the number of units to Compact a chart to 30:
chart1.getData().setCompactedBy(5);
- See Also:
resetCompactedBy
-
setCompactedBy
public void setCompactedBy(double value)
Gets or sets a value indicating the interval of units to compress data.
This method is used to configure the units for compression in the X Axis. If the XAxis has been passed DateTime XValues and has been formated for Date, the units represented by the
setCompactedBymethod would be Days. For example a value of 30 would be interperted into 1 Month. If you do not have configured XValues in the chart, then the unit base is 1 (categorical axis).The data compression features provide developers with a mechanism to display data in different intervals, summarizing historical data. The
compactmethod is used to complete the compacting process.The
isCompactedreturns a value indicating whether or not the data is compacted.The
undoCompactmethod is used to decompress compacted data and show all values.The
setDatamethod is used to access the DataValues object for a chart.To configure the number of units to Compact a chart to 30:
chart1.getData().setCompactedBy(5);
- Parameters:
value-- See Also:
resetCompactedBy
-
getCompactedByDateTime
public java.util.Date getCompactedByDateTime()
Gets or sets a value indicating the interval of units to compress data.
This method is used to configure the units for compression in the X Axis. If the XAxis has been passed DateTime XValues and has been formated for Date, the units represented by the
setCompactedBymethod would be Days. For example a value of 30 would be interperted into 1 Month. If you do not have configured XValues in the chart, then the unit base is 1 (categorical axis).The data compression features provide developers with a mechanism to display data in different intervals, summarizing historical data. The
compactmethod is used to complete the compacting process.The
isCompactedreturns a value indicating whether or not the data is compacted.The
undoCompactmethod is used to decompress compacted data and show all values.The
setDatamethod is used to access the DataValues object for a chart.To configure the number of units to Compact a chart to 30:
chart1.getData().setCompactedBy(5);
- See Also:
resetCompactedBy
-
setCompactedBy
public void setCompactedBy(java.util.Date value)
Gets or sets a value indicating the interval of units to compress data.
This method is used to configure the units for compression in the X Axis. If the XAxis has been passed DateTime XValues and has been formated for Date, the units represented by the
setCompactedBymethod would be Days. For example a value of 30 would be interperted into 1 Month. If you do not have configured XValues in the chart, then the unit base is 1 (categorical axis).The data compression features provide developers with a mechanism to display data in different intervals, summarizing historical data. The
compactmethod is used to complete the compacting process.The
isCompactedreturns a value indicating whether or not the data is compacted.The
undoCompactmethod is used to decompress compacted data and show all values.The
setDatamethod is used to access the DataValues object for a chart.To configure the number of units to Compact a chart to 30:
chart1.getData().setCompactedBy(5);
- Parameters:
value-- See Also:
resetCompactedBy
-
isInitializeHidden
public boolean isInitializeHidden()
Gets or sets a value indicating to intialize all non-initialized values to hidden value.
chart1.setGallery(Gallery.LINES);
chart1.getLegendBox().setVisible(false);
chart1.getData().setSeries(1);
chart1.getData().setPoints(10);
chart1.getData().setInitializeHidden(false);
java.util.Random rand;
rand = new java.util.Random();
chart1.getData().set(0, 3, ((DataUnit)(10.0 * (rand.nextDouble()))));
chart1.getData().set(0, 5, ((DataUnit)(10.0 * (rand.nextDouble()))));
chart1.getAxisY().setMax(10);
chart1.getAxisY().setMin(-10);
chart1.setGallery(Gallery.LINES);
chart1.getLegendBox().setVisible(false);
chart1.getData().setSeries(1);
chart1.getData().setPoints(10);
chart1.getData().setInitializeHidden(true);
java.util.Random rand;
rand = new java.util.Random();
chart1.getData().set(0, 3, ((DataUnit)(10.0 * (rand.nextDouble()))));
chart1.getData().set(0, 5, ((DataUnit)(10.0 * (rand.nextDouble()))));
chart1.getAxisY().setMax(10);
chart1.getAxisY().setMin(-10);
-
setInitializeHidden
public void setInitializeHidden(boolean value)
Gets or sets a value indicating to intialize all non-initialized values to hidden value.
chart1.setGallery(Gallery.LINES);
chart1.getLegendBox().setVisible(false);
chart1.getData().setSeries(1);
chart1.getData().setPoints(10);
chart1.getData().setInitializeHidden(false);
java.util.Random rand;
rand = new java.util.Random();
chart1.getData().set(0, 3, ((DataUnit)(10.0 * (rand.nextDouble()))));
chart1.getData().set(0, 5, ((DataUnit)(10.0 * (rand.nextDouble()))));
chart1.getAxisY().setMax(10);
chart1.getAxisY().setMin(-10);
chart1.setGallery(Gallery.LINES);
chart1.getLegendBox().setVisible(false);
chart1.getData().setSeries(1);
chart1.getData().setPoints(10);
chart1.getData().setInitializeHidden(true);
java.util.Random rand;
rand = new java.util.Random();
chart1.getData().set(0, 3, ((DataUnit)(10.0 * (rand.nextDouble()))));
chart1.getData().set(0, 5, ((DataUnit)(10.0 * (rand.nextDouble()))));
chart1.getAxisY().setMax(10);
chart1.getAxisY().setMin(-10);
- Parameters:
value-
-
isInterpolateHidden
public boolean isInterpolateHidden()
Gets or sets a value specifying to draw a connecting line over a missing data point.chart1.getData().setInterpolateHidden(true);
-
setInterpolateHidden
public void setInterpolateHidden(boolean value)
Gets or sets a value specifying to draw a connecting line over a missing data point.chart1.getData().setInterpolateHidden(true);
- Parameters:
value-
-
getTimeSpan
public TimeSpan getTimeSpan(int series,
                   int point)
Provides access to the Y value for the specific series and point.- Parameters:
series-point-
-
set
public void set(int series,
       int point,
       TimeSpan value)
Provides access to the Y value for the specific series and point.- Parameters:
series-point-value-
-
get
public DataUnit get(int series,
           int point)
Provides access to the Y value for the specific series and point.- Parameters:
series-point-
-
set
public void set(int series,
       int point,
       DataUnit value)
Provides access to the Y value for the specific series and point.- Parameters:
series-point-value-
-
getDouble
public double getDouble(int series,
               int point)
Provides access to the Y value for the specific series and point.- Parameters:
series-point-
-
set
public void set(int series,
       int point,
       double value)
Provides access to the Y value for the specific series and point.- Parameters:
series-point-value-
-
getDateTime
public java.util.Date getDateTime(int series,
                         int point)
Provides access to the Y value for the specific series and point.- Parameters:
series-point-
-
set
public void set(int series,
       int point,
       java.util.Date value)
Provides access to the Y value for the specific series and point.- Parameters:
series-point-value-
-
getLabels
public java.util.List<java.lang.String> getLabels()
Provides access to label collection of the main x-axis.
int i;
i = 0;
for(; (i < (chart1.getData().getPoints())); ++(i))
{
    chart1.getData().getLabels().set((short)i, "Label" + SfxNET.System.Int32.Set_System_Int32(i));
}
-
getPoints
public int getPoints()
Gets or sets a value indicating the number of series allocated for the chart.
The Points and
setSeriesmethods are usually set a design-time using the method dialog box for the Chart object. The only time these methods should be included in code is when you wish to read the number of series or points in a chart.This methody is normally used to get the number of data points per series available in the chart for administration purposes. For example, if you want to change the values of each data point in a series, you will need the number of available points per series to complete the For loop.
To set a chart with two series, and five points per series:
chart1.getData().setSeries(2);
chart1.getData().setPoints(5);
-
setPoints
public void setPoints(int value)
Gets or sets a value indicating the number of series allocated for the chart.
The Points and
setSeriesmethods are usually set a design-time using the method dialog box for the Chart object. The only time these methods should be included in code is when you wish to read the number of series or points in a chart.This methody is normally used to get the number of data points per series available in the chart for administration purposes. For example, if you want to change the values of each data point in a series, you will need the number of available points per series to complete the For loop.
To set a chart with two series, and five points per series:
chart1.getData().setSeries(2);
chart1.getData().setPoints(5);
- Parameters:
value-
-
getSeries
public int getSeries()
Gets or sets a value indicating the number of series allocated for the chart.
The
setPointsandsetSeriesmethods are usually set a design-time using the method dialog box for theChartobject. The only time these methods should be included in code is when you wish to read the number of series or points in a chart.This method is normally used to get the number of series available on the chart for administration purposes. For example, if you want to set a different color for each data series using the
setColormethod, you will need the number of available data series to complete the For loop.To set a chart with five series, and two points per series:
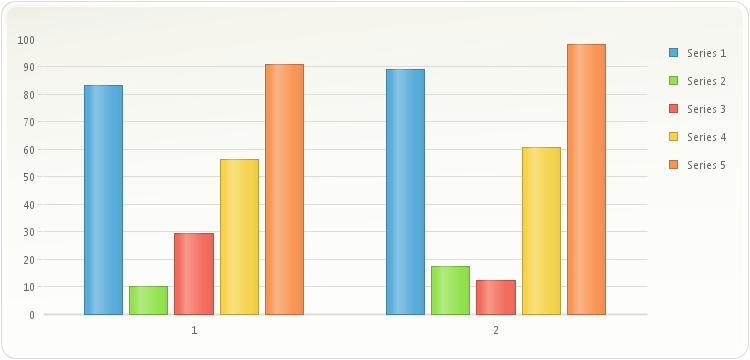
chart1.setGallery(Gallery.BAR);
chart1.getData().setSeries(5);
chart1.getData().setPoints(2);
-
setSeries
public void setSeries(int value)
Gets or sets a value indicating the number of series allocated for the chart.
The
setPointsandsetSeriesmethods are usually set a design-time using the method dialog box for theChartobject. The only time these methods should be included in code is when you wish to read the number of series or points in a chart.This method is normally used to get the number of series available on the chart for administration purposes. For example, if you want to set a different color for each data series using the
setColormethod, you will need the number of available data series to complete the For loop.To set a chart with five series, and two points per series:
chart1.setGallery(Gallery.BAR);
chart1.getData().setSeries(5);
chart1.getData().setPoints(2);
- Parameters:
value-
-
getX
public IDataArray getX()
Allows you to set X-Values for specific point of XY plots.
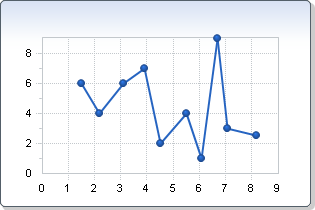
chart1.getData().getX().set(0, 0, ((DataUnit)2.9));
chart1.getData().getY().set(0, 0, ((DataUnit)10.5));
-
getY
public IDataArray getY()
Allows you to access the Y coordinates of the data points.
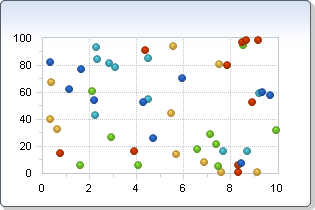
chart1.getData().getX().set(0, 0, ((DataUnit)1.2));
chart1.getData().getY().set(0, 0, ((DataUnit)5.3));
-
getYFrom
public IDataArray getYFrom()
Allows you to set the starting Y-value for a specific value on the chart.
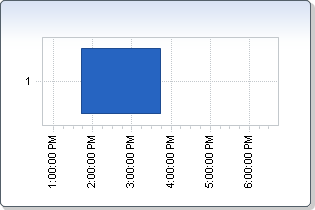
chart1.setGallery(Gallery.GANTT);
chart1.getData().getYFrom().set(0, 0, ((DataUnit)SfxNET.System.DateTime.getNow().AddHours(1.0).ToOADate()));
chart1.getData().getY().set(0, 0, ((DataUnit)SfxNET.System.DateTime.getNow().AddHours(3.0).ToOADate()));
-
clear
public void clear()
Clears all the data values in the chart.
After calling the method, the chart displays "No Data Available" message.
To clear passed values in a chart:
chart1.getData().clear();
-
commitChanges
public boolean commitChanges()
Finalizes chart data and invokes selected data related tasks.This method should not be required for normal chart generation, however it was found that it was useful in selected scenarios. This method instructs the chart to:
1) Compact data if Data Compaction features are used.
2) Equalizes Point and Series allocations.
3) Axis adjustments based on data.
These tasks will also be completed before the chart is rendered, however using this method developers may force this to occur on demand.
This method also returns a boolean value specifying if this has been completed.
To Commit data changes to the chart:
chart1.getData().CommitChanges();
-
compact
public void compact(TimeSpan step)
Compacts the data in order to display more summarized information.
- By default, Chart FX utilizes the CompactFormulas.Min.
- When compacting data, the data will require summarization of some form. Chart FX allows you to specify how to summarize data in the form of a DataCompacting formula. For convenience, Chart FX provides predefined formulas for popular compacting schemes such as First, Last, Min, Max, and Average.
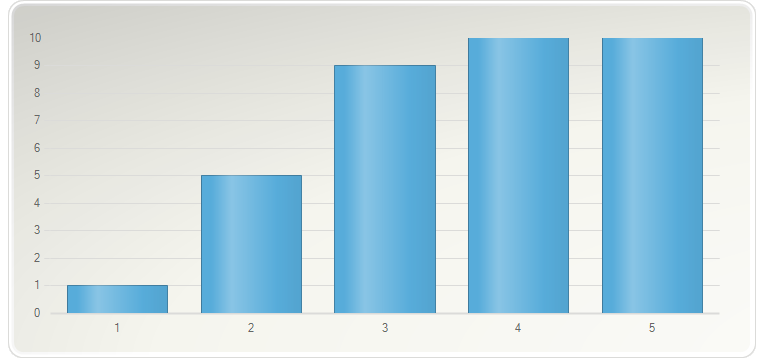
For example, there is a chart of 1 series and 10 points:
chart1.setGallery(Gallery.BAR);
chart1.getLegendBox().setVisible(false);
chart1.getData().setSeries(1);
chart1.getData().setPoints(10);
int i;
i = 0;
for(; (i < 10); (i)++)
{
    chart1.getData().set(0, i, ((DataUnit)(1 + i)));
}
After calling the
compactmethod with a step set to two (2), the result chart provides summarized data compacting every two bars into one and producing a new bar which is the minimum Y value of both bars:chart1.setGallery(Gallery.BAR); chart1.getLegendBox().setVisible(false); chart1.getData().setSeries(1); chart1.getData().setPoints(10); int i; i = 0; for(; (i < 10); (i)++) { chart1.getData().set(0, i, ((DataUnit)(1 + i))); } chart1.getData().getY().setCompactFormula(CompactFormulas.getMin()); chart1.getData().Compact(((DataUnit)2.0));
Similarly, this is the resulting chart when the step is set to five (5) and the CompactFormula is set to Max:
chart1.setGallery(Gallery.BAR);
chart1.getLegendBox().setVisible(false);
chart1.getData().setSeries(1);
chart1.getData().setPoints(10);
int i;
i = 0;
for(; (i < 10); (i)++)
{
    chart1.getData().set(0, i, ((DataUnit)(1 + i)));
}
chart1.getData().getY().setCompactFormula(CompactFormulas.getMax());
chart1.getData().Compact(((DataUnit)5.0));
- From time to time, the developer requires specific analysis and summarization of data not available through one of the predefined formulas. For this, Chart FX provides the ability for specifying a custom formula to use when compacting data allowing unlimited possibilities for summarizing your compacted data. Chart FX provides a way for the developer to delegate the computation to a specific handling function.
The following is a sample code defining a custom handler to sum the values to be compacted.
Below is a chart using custom handler to sum the values to be compacted with a step set to 2:
- The
undoCompactmethod is used to decompress compacted data and show all values.
- The
setDatamethod is used to access the DataValues object for a chart.
- Parameters:
step-
-
compact
public void compact(DataUnit step)
Compacts the data in order to display more summarized information.
- By default, Chart FX utilizes the CompactFormulas.Min.
- When compacting data, the data will require summarization of some form. Chart FX allows you to specify how to summarize data in the form of a DataCompacting formula. For convenience, Chart FX provides predefined formulas for popular compacting schemes such as First, Last, Min, Max, and Average.
For example, there is a chart of 1 series and 10 points:
chart1.setGallery(Gallery.BAR);
chart1.getLegendBox().setVisible(false);
chart1.getData().setSeries(1);
chart1.getData().setPoints(10);
int i;
i = 0;
for(; (i < 10); (i)++)
{
    chart1.getData().set(0, i, ((DataUnit)(1 + i)));
}
After calling the
compactmethod with a step set to two (2), the result chart provides summarized data compacting every two bars into one and producing a new bar which is the minimum Y value of both bars:chart1.setGallery(Gallery.BAR); chart1.getLegendBox().setVisible(false); chart1.getData().setSeries(1); chart1.getData().setPoints(10); int i; i = 0; for(; (i < 10); (i)++) { chart1.getData().set(0, i, ((DataUnit)(1 + i))); } chart1.getData().getY().setCompactFormula(CompactFormulas.getMin()); chart1.getData().Compact(((DataUnit)2.0));
Similarly, this is the resulting chart when the step is set to five (5) and the CompactFormula is set to Max:
chart1.setGallery(Gallery.BAR);
chart1.getLegendBox().setVisible(false);
chart1.getData().setSeries(1);
chart1.getData().setPoints(10);
int i;
i = 0;
for(; (i < 10); (i)++)
{
    chart1.getData().set(0, i, ((DataUnit)(1 + i)));
}
chart1.getData().getY().setCompactFormula(CompactFormulas.getMax());
chart1.getData().Compact(((DataUnit)5.0));
- From time to time, the developer requires specific analysis and summarization of data not available through one of the predefined formulas. For this, Chart FX provides the ability for specifying a custom formula to use when compacting data allowing unlimited possibilities for summarizing your compacted data. Chart FX provides a way for the developer to delegate the computation to a specific handling function.
The following is a sample code defining a custom handler to sum the values to be compacted.
Below is a chart using custom handler to sum the values to be compacted with a step set to 2:
- The
undoCompactmethod is used to decompress compacted data and show all values.
- The
setDatamethod is used to access the DataValues object for a chart.
- Parameters:
step-
-
compact
public void compact(double step)
Compacts the data in order to display more summarized information.
- By default, Chart FX utilizes the CompactFormulas.Min.
- When compacting data, the data will require summarization of some form. Chart FX allows you to specify how to summarize data in the form of a DataCompacting formula. For convenience, Chart FX provides predefined formulas for popular compacting schemes such as First, Last, Min, Max, and Average.
For example, there is a chart of 1 series and 10 points:
chart1.setGallery(Gallery.BAR);
chart1.getLegendBox().setVisible(false);
chart1.getData().setSeries(1);
chart1.getData().setPoints(10);
int i;
i = 0;
for(; (i < 10); (i)++)
{
    chart1.getData().set(0, i, ((DataUnit)(1 + i)));
}
After calling the
compactmethod with a step set to two (2), the result chart provides summarized data compacting every two bars into one and producing a new bar which is the minimum Y value of both bars:chart1.setGallery(Gallery.BAR); chart1.getLegendBox().setVisible(false); chart1.getData().setSeries(1); chart1.getData().setPoints(10); int i; i = 0; for(; (i < 10); (i)++) { chart1.getData().set(0, i, ((DataUnit)(1 + i))); } chart1.getData().getY().setCompactFormula(CompactFormulas.getMin()); chart1.getData().Compact(((DataUnit)2.0));
Similarly, this is the resulting chart when the step is set to five (5) and the CompactFormula is set to Max:
chart1.setGallery(Gallery.BAR);
chart1.getLegendBox().setVisible(false);
chart1.getData().setSeries(1);
chart1.getData().setPoints(10);
int i;
i = 0;
for(; (i < 10); (i)++)
{
    chart1.getData().set(0, i, ((DataUnit)(1 + i)));
}
chart1.getData().getY().setCompactFormula(CompactFormulas.getMax());
chart1.getData().Compact(((DataUnit)5.0));
- From time to time, the developer requires specific analysis and summarization of data not available through one of the predefined formulas. For this, Chart FX provides the ability for specifying a custom formula to use when compacting data allowing unlimited possibilities for summarizing your compacted data. Chart FX provides a way for the developer to delegate the computation to a specific handling function.
The following is a sample code defining a custom handler to sum the values to be compacted.
Below is a chart using custom handler to sum the values to be compacted with a step set to 2:
- The
undoCompactmethod is used to decompress compacted data and show all values.
- The
setDatamethod is used to access the DataValues object for a chart.
- Parameters:
step-
-
compact
public void compact(java.util.Date step)
Compacts the data in order to display more summarized information.
- By default, Chart FX utilizes the CompactFormulas.Min.
- When compacting data, the data will require summarization of some form. Chart FX allows you to specify how to summarize data in the form of a DataCompacting formula. For convenience, Chart FX provides predefined formulas for popular compacting schemes such as First, Last, Min, Max, and Average.
For example, there is a chart of 1 series and 10 points:
chart1.setGallery(Gallery.BAR);
chart1.getLegendBox().setVisible(false);
chart1.getData().setSeries(1);
chart1.getData().setPoints(10);
int i;
i = 0;
for(; (i < 10); (i)++)
{
    chart1.getData().set(0, i, ((DataUnit)(1 + i)));
}
After calling the
compactmethod with a step set to two (2), the result chart provides summarized data compacting every two bars into one and producing a new bar which is the minimum Y value of both bars:chart1.setGallery(Gallery.BAR); chart1.getLegendBox().setVisible(false); chart1.getData().setSeries(1); chart1.getData().setPoints(10); int i; i = 0; for(; (i < 10); (i)++) { chart1.getData().set(0, i, ((DataUnit)(1 + i))); } chart1.getData().getY().setCompactFormula(CompactFormulas.getMin()); chart1.getData().Compact(((DataUnit)2.0));
Similarly, this is the resulting chart when the step is set to five (5) and the CompactFormula is set to Max:
chart1.setGallery(Gallery.BAR);
chart1.getLegendBox().setVisible(false);
chart1.getData().setSeries(1);
chart1.getData().setPoints(10);
int i;
i = 0;
for(; (i < 10); (i)++)
{
    chart1.getData().set(0, i, ((DataUnit)(1 + i)));
}
chart1.getData().getY().setCompactFormula(CompactFormulas.getMax());
chart1.getData().Compact(((DataUnit)5.0));
- From time to time, the developer requires specific analysis and summarization of data not available through one of the predefined formulas. For this, Chart FX provides the ability for specifying a custom formula to use when compacting data allowing unlimited possibilities for summarizing your compacted data. Chart FX provides a way for the developer to delegate the computation to a specific handling function.
The following is a sample code defining a custom handler to sum the values to be compacted.
Below is a chart using custom handler to sum the values to be compacted with a step set to 2:
- The
undoCompactmethod is used to decompress compacted data and show all values.
- The
setDatamethod is used to access the DataValues object for a chart.
- Parameters:
step-
-
recalculateScale
public void recalculateScale()
Recalculates the scale of the chart based on the data available.The
recalculateScaleof theChartmethod is a shortcut to this method.Please keep in mind that this method reads the entire data array, so abusing this method could affect the performance of your application, as Chart FX will read the entire data array every time this method is called.
This method should be invoked to force Chart FX to calculate the
setMin,setMax,setMinorStepDateTime, andsetStepfor theAxis.This method will not affect the
setStepandsetMinorStepDateTimemethods if they have been previously set. To make sure that they respond to this method, set thesetStepandsetMinorStepDateTimemethods to zero (0).A typical case of when to use this method is when you disable the
isAutoScalemethod to calculate thesetMinandsetMaxmethods and you set new data to the chart that causes the scale values to be recalculated to show the appropriate data.When using a
isStackedstyle chart, recalculating the scale will sometimes make the chart more readable.To recalculate scale values for all numerical axes:
chart1.getData().recalculateScale();
-
removeSeries
public void removeSeries(int seriesIndex)
Remove a Series from the collection by index.When a Series is removed from the collection using this method, all the indexes will be recalculated and the methods will remain associated with the old index. So if you assign methods to Series index 2, and then remove that series, Series index 3 (if it exists) will assume all the methods of old Series index 2 (including the index number).
To remove the Series index 2 from collection.
chart1.getData().RemoveSeries(2);
- Parameters:
seriesIndex- Index of Series to be removed.
-
resetCompactedBy
public void resetCompactedBy()
Set the property CompactedBy to its default value.- See Also:
setCompactedBy
-
resetFlags
public void resetFlags()
Set the property Flags to its default value.
-
undoCompact
public void undoCompact()
If the data is compacted, this method uncompacts the data and shows all values.
The data compression features provide developers with a mechanism to display data in different intervals, summarizing historical data. The
compactmethod is used to complete the compacting process.The
isCompactedreturns a value indicating whether or not the data is compacted.The
setDatamethod is used to access the DataValues object for a chart.To decompress a chart with Compacted data:
chart1.getData().UndoCompact();
-
-