- java.lang.Object
-
- com.softwarefx.chartfx.server.DockableBar
-
- com.softwarefx.chartfx.server.LegendBox
-
public final class LegendBox
extends DockableBar
Provides access to the LegendBox object.
The statistical legend is not only used to display statistical analysis values, but also allows your end users to interact with any interactive studies applied to the chart. The supported members of this class allow you to apply visual attributes to the statistical legend.
-
-
Constructor Summary
Constructors Constructor and Description LegendBox()Constructs a newly allocated LegendBox object
-
Method Summary
Methods Modifier and Type Method and Description ContentLayoutgetContentLayout()Allows you to align the content for the legend box.java.util.List<CustomLegendItem>getCustomItems()Returns the collection of the custom items in the legend box.java.awt.FontgetFont()Gets or sets the font of the Legend Box.HighlightLegendAttributesgetHighlight()Returns a HighlightLegendAttributes object.LegendItemAttributesCollectiongetItemAttributes()Allows you to configure the Legend Box Items in the chart.doublegetLineSpacing()Gets or sets the space in pixels between the LegendBox itemsintgetMarginX()Gets or sets a value specifying the margin width for a LegendBox.intgetMarginY()Gets or sets a value specifying the margin height for a LegendBox.java.util.EnumSet<LegendBoxStyles>getStyle()Gets or sets the style of the legend box.java.awt.ColorgetTextColor()Gets or sets the color used for the text in the legend box.java.util.List<TitleDockable>getTitles()Returns a title object for the legend box.booleanisPlotAreaOnly()Allows the legend box margins to go outside of the chart's drawing area.voidresetContentLayout()Set the property ContentLayout to its default value.voidresetFont()Set the property Font to its default value.voidresetLineSpacing()Set the property LineSpacing to its default value.voidresetMarginX()Set the property MarginX to its default value.voidresetMarginY()Set the property MarginY to its default value.voidresetPlotAreaOnly()Set the property PlotAreaOnly to its default value.voidresetStyle()Set the property Style to its default value.voidresetTextColor()Set the property TextColor to its default value.voidsetContentLayout(ContentLayout value)Allows you to align the content for the legend box.voidsetFont(java.awt.Font value)Gets or sets the font of the Legend Box.voidsetLineSpacing(double value)Gets or sets the space in pixels between the LegendBox itemsvoidsetMarginX(int value)Gets or sets a value specifying the margin width for a LegendBox.voidsetMarginY(int value)Gets or sets a value specifying the margin height for a LegendBox.voidsetPlotAreaOnly(boolean value)Allows the legend box margins to go outside of the chart's drawing area.voidsetStyle(java.util.EnumSet<LegendBoxStyles> value)Gets or sets the style of the legend box.voidsetTextColor(java.awt.Color value)Gets or sets the color used for the text in the legend box.voidsizeToFit()Calculates and sets the best-fit size for the legend box.-
Methods inherited from class com.softwarefx.chartfx.server.DockableBar
addVisibleChangedListener, getBackColor, getBorder, getDock, getHeight, getWidth, getZOrder, isAutoSize, isVisible, removeVisibleChangedListener, resetAutoSize, resetBackColor, resetBorder, resetDock, resetHeight, resetVisible, resetWidth, resetZOrder, setAutoSize, setBackColor, setBorder, setDock, setHeight, setVisible, setWidth, setZOrder
-
-
-
-
Method Detail
-
getContentLayout
public ContentLayout getContentLayout()
Allows you to align the content for the legend box.
chart1.getLegendBox().setContentLayout(ContentLayout.NEAR);
PopulateSouthAmericaPopulation(chart1);
chart1.setGallery(Gallery.BAR);
chart1.getTitles().add(new TitleDockable("South American Countries Population"));
chart1.getAxisY().setScaleUnit(1000000);
chart1.getAxisY().getTitle().setText("(in Millions)");
public static void PopulateSouthAmericaPopulation(Chart chart1) { SouthAmericaPopulation[] data = new SouthAmericaPopulation[]{ new SouthAmericaPopulation("Brazil", 201033000), new SouthAmericaPopulation("Colombia", 47130000), new SouthAmericaPopulation("Argentina", 41350000), new SouthAmericaPopulation("Peru", 30476000), new SouthAmericaPopulation("Venezuela", 29760000), new SouthAmericaPopulation("Chile", 16841000), new SouthAmericaPopulation("Ecuador", 15779000), new SouthAmericaPopulation("Bolivia", 10517000) }; ObjectProvider objProvider = new ObjectProvider(data); chart1.getDataSourceSettings().setDataSource(objProvider); }public static class SouthAmericaPopulation { public SouthAmericaPopulation(String country, double population) { this.setCountry(country); this.setPopulation(population); } private String privateCountry; public final String getCountry() { return privateCountry; } public final void setCountry(String value) { privateCountry = value; } private double privatePopulation; public final double getPopulation() { return privatePopulation; } public final void setPopulation(double value) { privatePopulation = value; } }public static class Countries { public Countries(String country, double lei, double gdppc, java.awt.Image flag) { this.setCountry(country); this.setLEI(lei); this.setGDPPC(gdppc); this.setFlag(flag); } private String privateCountry; public final String getCountry() { return privateCountry; } public final void setCountry(String value) { privateCountry = value; } private double privateLEI; public final double getLEI() { return privateLEI; } public final void setLEI(double value) { privateLEI = value; } private double privateGDPPC; public final double getGDPPC() { return privateGDPPC; } public final void setGDPPC(double value) { privateGDPPC = value; } private java.awt.Image privateFlag; public final java.awt.Image getFlag() { return privateFlag; } public final void setFlag(java.awt.Image value) { privateFlag = value; } }
- See Also:
resetContentLayout
-
setContentLayout
public void setContentLayout(ContentLayout value)
Allows you to align the content for the legend box.
chart1.getLegendBox().setContentLayout(ContentLayout.NEAR);
PopulateSouthAmericaPopulation(chart1);
chart1.setGallery(Gallery.BAR);
chart1.getTitles().add(new TitleDockable("South American Countries Population"));
chart1.getAxisY().setScaleUnit(1000000);
chart1.getAxisY().getTitle().setText("(in Millions)");
public static void PopulateSouthAmericaPopulation(Chart chart1) { SouthAmericaPopulation[] data = new SouthAmericaPopulation[]{ new SouthAmericaPopulation("Brazil", 201033000), new SouthAmericaPopulation("Colombia", 47130000), new SouthAmericaPopulation("Argentina", 41350000), new SouthAmericaPopulation("Peru", 30476000), new SouthAmericaPopulation("Venezuela", 29760000), new SouthAmericaPopulation("Chile", 16841000), new SouthAmericaPopulation("Ecuador", 15779000), new SouthAmericaPopulation("Bolivia", 10517000) }; ObjectProvider objProvider = new ObjectProvider(data); chart1.getDataSourceSettings().setDataSource(objProvider); }public static class SouthAmericaPopulation { public SouthAmericaPopulation(String country, double population) { this.setCountry(country); this.setPopulation(population); } private String privateCountry; public final String getCountry() { return privateCountry; } public final void setCountry(String value) { privateCountry = value; } private double privatePopulation; public final double getPopulation() { return privatePopulation; } public final void setPopulation(double value) { privatePopulation = value; } }public static class Countries { public Countries(String country, double lei, double gdppc, java.awt.Image flag) { this.setCountry(country); this.setLEI(lei); this.setGDPPC(gdppc); this.setFlag(flag); } private String privateCountry; public final String getCountry() { return privateCountry; } public final void setCountry(String value) { privateCountry = value; } private double privateLEI; public final double getLEI() { return privateLEI; } public final void setLEI(double value) { privateLEI = value; } private double privateGDPPC; public final double getGDPPC() { return privateGDPPC; } public final void setGDPPC(double value) { privateGDPPC = value; } private java.awt.Image privateFlag; public final java.awt.Image getFlag() { return privateFlag; } public final void setFlag(java.awt.Image value) { privateFlag = value; } }
- Parameters:
value-- See Also:
resetContentLayout
-
getCustomItems
public java.util.List<CustomLegendItem> getCustomItems()
Returns the collection of the custom items in the legend box.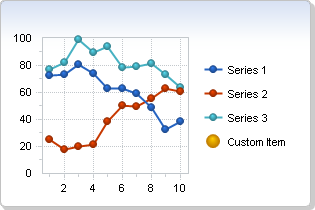
CustomLegendItem c;
c = new CustomLegendItem();
c.setText("Custom Item");
c.setMarkerShape(MarkerShape.MARBLE);
c.setColor(new java.awt.Color(255,165,0,255));
chart1.getLegendBox().getCustomItems().add(c);
-
getFont
public java.awt.Font getFont()
Gets or sets the font of the Legend Box.
You can set the font for the entire chart using the
setChartFontmethod.When setting a font in Chart FX, you must create a new font object with the desired attributes and assign that object to the desired chart element every time you want to change the font.
Fonts can be specified by using the standard string notation for fully or partially qualifying a font object. For example, "Verdana,12,style=italic,Bold" produces a font of type Verdana, point size of 12 and font style of Italic and Bold.
For more information regarding the Font type, please refer to the Documentation.
To change the font for the series legend box text:
chart1.getLegendBox().setFont(new java.awt.Font("Arial",java.awt.Font.PLAIN, 12));
- See Also:
resetFont
-
setFont
public void setFont(java.awt.Font value)
Gets or sets the font of the Legend Box.
You can set the font for the entire chart using the
setChartFontmethod.When setting a font in Chart FX, you must create a new font object with the desired attributes and assign that object to the desired chart element every time you want to change the font.
Fonts can be specified by using the standard string notation for fully or partially qualifying a font object. For example, "Verdana,12,style=italic,Bold" produces a font of type Verdana, point size of 12 and font style of Italic and Bold.
For more information regarding the Font type, please refer to the Documentation.
To change the font for the series legend box text:
chart1.getLegendBox().setFont(new java.awt.Font("Arial",java.awt.Font.PLAIN, 12));
- Parameters:
value-- See Also:
resetFont
-
getHighlight
public HighlightLegendAttributes getHighlight()
Returns a HighlightLegendAttributes object.chart1.getLegendBox().getHighlight().setEnabled(true);
-
getItemAttributes
public LegendItemAttributesCollection getItemAttributes()
Allows you to configure the Legend Box Items in the chart.LegendItemAttributes lia; lia = new LegendItemAttributes(); chart1.getLegendBox().getItemAttributes().set(chart1.getSeries(), 1, lia); lia.setFontStyle(FontStyle.BOLD);
-
getLineSpacing
public double getLineSpacing()
Gets or sets the space in pixels between the LegendBox itemschart1.getLegendBox().setLineSpacing(3);
- See Also:
resetLineSpacing
-
setLineSpacing
public void setLineSpacing(double value)
Gets or sets the space in pixels between the LegendBox itemschart1.getLegendBox().setLineSpacing(3);
- Parameters:
value-- See Also:
resetLineSpacing
-
getMarginX
public int getMarginX()
Gets or sets a value specifying the margin width for a LegendBox.
The
setMarginYmethod may be used to control the margin height for a LegendBox.The
setLegendBoxmethod of theChartclass is used to return the chart's LegendBox object.To configure the X Margin for a legendbox to 50:
chart1.getLegendBox().setMarginX(50);
- See Also:
resetMarginX
-
setMarginX
public void setMarginX(int value)
Gets or sets a value specifying the margin width for a LegendBox.
The
setMarginYmethod may be used to control the margin height for a LegendBox.The
setLegendBoxmethod of theChartclass is used to return the chart's LegendBox object.To configure the X Margin for a legendbox to 50:
chart1.getLegendBox().setMarginX(50);
- Parameters:
value-- See Also:
resetMarginX
-
getMarginY
public int getMarginY()
Gets or sets a value specifying the margin height for a LegendBox.
The
setMarginXmethod may be used to control the margin width for a LegendBox.The
setLegendBoxmethod of theChartclass is used to return the chart's LegendBox object.To configure the Y Margin for a legendbox to 50:
chart1.getLegendBox().setMarginY(50);
- See Also:
resetMarginY
-
setMarginY
public void setMarginY(int value)
Gets or sets a value specifying the margin height for a LegendBox.
The
setMarginXmethod may be used to control the margin width for a LegendBox.The
setLegendBoxmethod of theChartclass is used to return the chart's LegendBox object.To configure the Y Margin for a legendbox to 50:
chart1.getLegendBox().setMarginY(50);
- Parameters:
value-- See Also:
resetMarginY
-
isPlotAreaOnly
public boolean isPlotAreaOnly()
Allows the legend box margins to go outside of the chart's drawing area.
If there is enough space and the legend is centered (default), there will be no noticeable difference when this method is configured. The difference is visible when there are many legend values, the drawing area is too small, the opposite gaps (e.g. top and bottom) are different or the legend is not centered.
By default the legends are drawn inside the chart drawing area, for example when the legend box is at the right, the first legend will be at the top of the chart area, it will not use the margin on top. If you set PlotAreaOnly to false, the margins will also be available for the legend.
To set the
isPlotAreaOnlymethod to false:chart1.getLegendBox().setPlotAreaOnly(false);
- See Also:
resetPlotAreaOnly
-
setPlotAreaOnly
public void setPlotAreaOnly(boolean value)
Allows the legend box margins to go outside of the chart's drawing area.
If there is enough space and the legend is centered (default), there will be no noticeable difference when this method is configured. The difference is visible when there are many legend values, the drawing area is too small, the opposite gaps (e.g. top and bottom) are different or the legend is not centered.
By default the legends are drawn inside the chart drawing area, for example when the legend box is at the right, the first legend will be at the top of the chart area, it will not use the margin on top. If you set PlotAreaOnly to false, the margins will also be available for the legend.
To set the
isPlotAreaOnlymethod to false:chart1.getLegendBox().setPlotAreaOnly(false);
- Parameters:
value-- See Also:
resetPlotAreaOnly
-
getStyle
public java.util.EnumSet<LegendBoxStyles> getStyle()
Gets or sets the style of the legend box.
This method uses bitwise operators to turn on and off settings. To combine two flags. use the 'Or' bitwise operator.
This method uses bitwise operators to turn on and off settings. To combine two flags. use the 'Or' bitwise operator.
Configures the legend box to enables the context menu:
java.util.EnumSet<LegendBoxStyles> style = chart1.getLegendBox().getStyle();

style.add(LegendBoxStyles.SHOW_MENU);

chart1.getLegendBox().setStyle(style);
- See Also:
resetStyle
-
setStyle
public void setStyle(java.util.EnumSet<LegendBoxStyles> value)
Gets or sets the style of the legend box.
This method uses bitwise operators to turn on and off settings. To combine two flags. use the 'Or' bitwise operator.
This method uses bitwise operators to turn on and off settings. To combine two flags. use the 'Or' bitwise operator.
Configures the legend box to enables the context menu:
java.util.EnumSet<LegendBoxStyles> style = chart1.getLegendBox().getStyle();

style.add(LegendBoxStyles.SHOW_MENU);

chart1.getLegendBox().setStyle(style);
- Parameters:
value-- See Also:
resetStyle
-
getTextColor
public java.awt.Color getTextColor()
Gets or sets the color used for the text in the legend box.
Before you can see the text color assignments, the selected legend box must be visible.
You can assign the text for the values legend box using the
setLabelsorsetTextmethods.Named color are supported (e.g. Red), to use Hex notation you have to use quotes (e.g. "#FF00FF").
For more information regarding the Color type, please refer to the Documentation.
To set the legend box text to red:
chart1.getLegendBox().setTextColor(new java.awt.Color(255,0,0,255));
- See Also:
resetTextColor
-
setTextColor
public void setTextColor(java.awt.Color value)
Gets or sets the color used for the text in the legend box.
Before you can see the text color assignments, the selected legend box must be visible.
You can assign the text for the values legend box using the
setLabelsorsetTextmethods.Named color are supported (e.g. Red), to use Hex notation you have to use quotes (e.g. "#FF00FF").
For more information regarding the Color type, please refer to the Documentation.
To set the legend box text to red:
chart1.getLegendBox().setTextColor(new java.awt.Color(255,0,0,255));
- Parameters:
value-- See Also:
resetTextColor
-
getTitles
public java.util.List<TitleDockable> getTitles()
Returns a title object for the legend box.TitleDockable newTitle; newTitle = new TitleDockable(); chart1.getLegendBox().getTitles().add(newTitle); newTitle.setText("My Title"); newTitle.setChartFont(new java.awt.Font(newTitle.getFont(), FontStyle.BOLD)); newTitle.setDock(DockArea.TOP);
-
resetContentLayout
public void resetContentLayout()
Set the property ContentLayout to its default value.- See Also:
setContentLayout
-
resetFont
public void resetFont()
Set the property Font to its default value.- See Also:
setFont
-
resetLineSpacing
public void resetLineSpacing()
Set the property LineSpacing to its default value.- See Also:
setLineSpacing
-
resetMarginX
public void resetMarginX()
Set the property MarginX to its default value.- See Also:
setMarginX
-
resetMarginY
public void resetMarginY()
Set the property MarginY to its default value.- See Also:
setMarginY
-
resetPlotAreaOnly
public void resetPlotAreaOnly()
Set the property PlotAreaOnly to its default value.- See Also:
isPlotAreaOnly
-
resetStyle
public void resetStyle()
Set the property Style to its default value.- See Also:
setStyle
-
resetTextColor
public void resetTextColor()
Set the property TextColor to its default value.- See Also:
setTextColor
-
sizeToFit
public void sizeToFit()
Calculates and sets the best-fit size for the legend box.This method is particularly useful when the
isAutoSizemethod is set to False, as it will allow you to recalculate the best-fit size of the legend box.Instructs Chart FX to calculate the best-fit for the legend box:
chart1.getLegendBox().sizeToFit();
-
-