- java.lang.Object
-
- com.softwarefx.chartfx.server.CellAttributes
-
public class CellAttributes
extends java.lang.Object
Allows you to modify the attributes of a cell in the DataGrid.
Allows you to modify the attributes of a particular Cell or entire Row in the
DataGrid.The following image shows a particular Cell in the DataGrid with a yellow background, Italic font, and a thicker border:
chart1.getDataGrid().setVisible(true);
CellAttributes cell;
cell = chart1.getDataGrid().getCells().get(0, 5);
cell.setBackColor(new java.awt.Color(255,255,0,255));
cell.setTextColor(new java.awt.Color(0,0,0,255));
cell.setBorderColor(new java.awt.Color(0,0,0,255));
cell.setBorderWidth(3);
java.util.EnumSet<FontStyle> style = cell.getFontStyle();

style.add(FontStyle.ITALIC);

cell.setFontStyle(style);
PopulateProductSales(chart1);
chart1.getTitles().add(new TitleDockable("Monthly Wine Sales by Type"));
chart1.getAxisY().getLabelsFormat().setFormat(AxisFormat.CURRENCY);
chart1.getLegendBox().setVisible(false);
chart1.getData().setSeries(3);
chart1.getSeries().get(0).setColor(new java.awt.Color(251, 246, 175));
chart1.getSeries().get(1).setColor(new java.awt.Color(117, 12, 9));
chart1.getSeries().get(2).setColor(new java.awt.Color(250, 217, 138));
public static void PopulateProductSales(Chart chart1) { ProductSales[] data = new ProductSales[]{ new ProductSales("Jan", 12560, 23400, 34500), new ProductSales("Feb", 13400, 21000, 38900), new ProductSales("Mar", 16700, 17000, 42100), new ProductSales("Apr", 12000, 19020, 43800), new ProductSales("May", 15800, 26500, 37540), new ProductSales("Jun", 9800, 27800, 32580), new ProductSales("Jul", 17800, 29820, 34000), new ProductSales("Aug", 19800, 17800, 38000), new ProductSales("Sep", 23200, 32000, 41300), new ProductSales("Oct", 16700, 26500, 46590), new ProductSales("Nov", 11800, 23000, 48700), new ProductSales("Dec", 13400, 15400, 49100) }; ObjectProvider objProvider = new ObjectProvider(data); chart1.getDataSourceSettings().setDataSource(objProvider); }public static class ProductSales { public ProductSales(String month, double white, double red, double sparkling) { this.setMonth(month); this.setWhite(white); this.setRed(red); this.setSparkling(sparkling); } private String privateMonth; public final String getMonth() { return privateMonth; } public final void setMonth(String value) { privateMonth = value; } private double privateWhite; public final double getWhite() { return privateWhite; } public final void setWhite(double value) { privateWhite = value; } private double privateRed; public final double getRed() { return privateRed; } public final void setRed(double value) { privateRed = value; } private double privateSparkling; public final double getSparkling() { return privateSparkling; } public final void setSparkling(double value) { privateSparkling = value; } }

-
-
Constructor Summary
Constructors Constructor and Description CellAttributes()Constructs a newly allocated CellAttributes object
-
Method Summary
Methods Modifier and Type Method and Description java.awt.ColorgetBackColor()Sets the background color for a particular Cell or entire Row in the Data Grid.java.awt.ColorgetBorderColor()Allows you to set the color of the border for a particular Cell or entire Row in the DataGrid.intgetBorderWidth()Allows you to set the width of the Cell border in pixels for a particular Cell or entire Row in the DataGrid.java.util.EnumSet<FontStyle>getFontStyle()Allows you to set the style of the font for a particular Cell or entire Row in the DataGrid.java.awt.ColorgetTextColor()Allows you to set the text color for a particular Cell or entire Row in the DataGrid.voidresetBackColor()Set the property BackColor to its default value.voidresetBorderColor()Set the property BorderColor to its default value.voidresetBorderWidth()Set the property BorderWidth to its default value.voidresetFontStyle()Set the property FontStyle to its default value.voidresetTextColor()Set the property TextColor to its default value.voidsetBackColor(java.awt.Color value)Sets the background color for a particular Cell or entire Row in the Data Grid.voidsetBorderColor(java.awt.Color value)Allows you to set the color of the border for a particular Cell or entire Row in the DataGrid.voidsetBorderWidth(int value)Allows you to set the width of the Cell border in pixels for a particular Cell or entire Row in the DataGrid.voidsetFontStyle(java.util.EnumSet<FontStyle> value)Allows you to set the style of the font for a particular Cell or entire Row in the DataGrid.voidsetTextColor(java.awt.Color value)Allows you to set the text color for a particular Cell or entire Row in the DataGrid.
-
-
-
Constructor Detail
-
CellAttributes
public CellAttributes()
Constructs a newly allocated CellAttributes object
-
-
Method Detail
-
getBackColor
public java.awt.Color getBackColor()
Sets the background color for a particular Cell or entire Row in the Data Grid.
You need to have the data grid visible in order to see the changes made with BackColor method. Use the
isVisiblemethod to enable the data grid.For more information regarding the Color type, please refer to the Java Documentation.
Below, the data grid cell Attribute backcolor for the first cell is set to LightBlue:
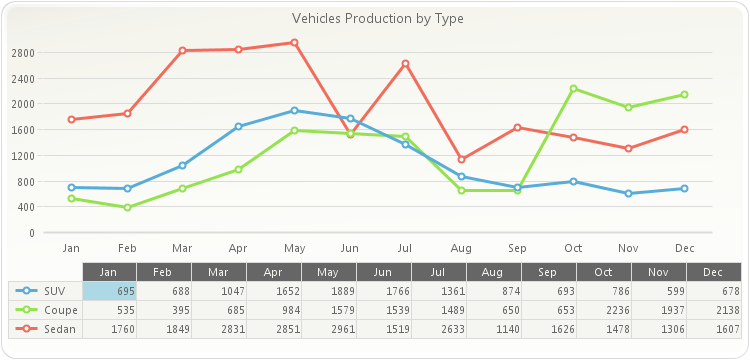
chart1.getDataGrid().setVisible(true);
chart1.getDataGrid().getCells().get(0, 0).setBackColor(new java.awt.Color(173,216,230,255));
chart1.getLegendBox().setVisible(false);
PopulateCarProduction(chart1);
chart1.getTitles().add(new TitleDockable("Vehicles Production by Type"));
public static void PopulateCarProduction(Chart chart1) { CarProduction[] production = new CarProduction[] { new CarProduction("Jan", 1760, 535, 695 ) , new CarProduction("Feb", 1849, 395, 688 ) , new CarProduction("Mar", 2831, 685, 1047 ) , new CarProduction("Apr", 2851, 984, 1652 ) , new CarProduction("May", 2961, 1579, 1889 ) , new CarProduction("Jun", 1519, 1539, 1766 ) , new CarProduction("Jul", 2633, 1489, 1361 ) , new CarProduction("Aug", 1140, 650, 874 ) , new CarProduction("Sep", 1626, 653, 693 ) , new CarProduction("Oct", 1478, 2236, 786 ) , new CarProduction("Nov", 1306, 1937, 599 ) , new CarProduction("Dec", 1607, 2138, 678 ) }; ObjectProvider objProvider = new ObjectProvider(production); chart1.getDataSourceSettings().setDataSource(objProvider); }public static class CarProduction { private CarProduction(String month, int sedan, int coupe, int SUV) { this.setMonth(month); this.setSedan(sedan); this.setCoupe(coupe); this.setSUV(SUV); } private String privateMonth; public final String getMonth() { return privateMonth; } public final void setMonth(String value) { privateMonth = value; } private int privateSedan; public final int getSedan() { return privateSedan; } public final void setSedan(int value) { privateSedan = value; } private int privateCoupe; public final int getCoupe() { return privateCoupe; } public final void setCoupe(int value) { privateCoupe = value; } private int privateSUV; public final int getSUV() { return privateSUV; } public final void setSUV(int value) { privateSUV = value; } }
- See Also:
resetBackColor
-
setBackColor
public void setBackColor(java.awt.Color value)
Sets the background color for a particular Cell or entire Row in the Data Grid.
You need to have the data grid visible in order to see the changes made with BackColor method. Use the
isVisiblemethod to enable the data grid.For more information regarding the Color type, please refer to the Java Documentation.
Below, the data grid cell Attribute backcolor for the first cell is set to LightBlue:
chart1.getDataGrid().setVisible(true);
chart1.getDataGrid().getCells().get(0, 0).setBackColor(new java.awt.Color(173,216,230,255));
chart1.getLegendBox().setVisible(false);
PopulateCarProduction(chart1);
chart1.getTitles().add(new TitleDockable("Vehicles Production by Type"));
public static void PopulateCarProduction(Chart chart1) { CarProduction[] production = new CarProduction[] { new CarProduction("Jan", 1760, 535, 695 ) , new CarProduction("Feb", 1849, 395, 688 ) , new CarProduction("Mar", 2831, 685, 1047 ) , new CarProduction("Apr", 2851, 984, 1652 ) , new CarProduction("May", 2961, 1579, 1889 ) , new CarProduction("Jun", 1519, 1539, 1766 ) , new CarProduction("Jul", 2633, 1489, 1361 ) , new CarProduction("Aug", 1140, 650, 874 ) , new CarProduction("Sep", 1626, 653, 693 ) , new CarProduction("Oct", 1478, 2236, 786 ) , new CarProduction("Nov", 1306, 1937, 599 ) , new CarProduction("Dec", 1607, 2138, 678 ) }; ObjectProvider objProvider = new ObjectProvider(production); chart1.getDataSourceSettings().setDataSource(objProvider); }public static class CarProduction { private CarProduction(String month, int sedan, int coupe, int SUV) { this.setMonth(month); this.setSedan(sedan); this.setCoupe(coupe); this.setSUV(SUV); } private String privateMonth; public final String getMonth() { return privateMonth; } public final void setMonth(String value) { privateMonth = value; } private int privateSedan; public final int getSedan() { return privateSedan; } public final void setSedan(int value) { privateSedan = value; } private int privateCoupe; public final int getCoupe() { return privateCoupe; } public final void setCoupe(int value) { privateCoupe = value; } private int privateSUV; public final int getSUV() { return privateSUV; } public final void setSUV(int value) { privateSUV = value; } }
- Parameters:
value-- See Also:
resetBackColor
-
getBorderColor
public java.awt.Color getBorderColor()
Allows you to set the color of the border for a particular Cell or entire Row in the DataGrid.
For more information regarding the Color type, please refer to the Documentation.
Below, the border color for the first cell is set to Red:
chart1.getDataGrid().setVisible(true);
chart1.getDataGrid().getCells().get(0, 0).setBorderColor(new java.awt.Color(255,0,0,255));
chart1.getLegendBox().setVisible(false);
PopulateSouthAmericaPopulation(chart1);
chart1.setGallery(Gallery.BAR);
chart1.getLegendBox().setVisible(false);
chart1.getTitles().add(new TitleDockable("South American Countries Population"));
chart1.getAxisY().setScaleUnit(1000000);
chart1.getAxisY().getTitle().setText("(in Millions)");
public static void PopulateSouthAmericaPopulation(Chart chart1) { SouthAmericaPopulation[] data = new SouthAmericaPopulation[]{ new SouthAmericaPopulation("Brazil", 201033000), new SouthAmericaPopulation("Colombia", 47130000), new SouthAmericaPopulation("Argentina", 41350000), new SouthAmericaPopulation("Peru", 30476000), new SouthAmericaPopulation("Venezuela", 29760000), new SouthAmericaPopulation("Chile", 16841000), new SouthAmericaPopulation("Ecuador", 15779000), new SouthAmericaPopulation("Bolivia", 10517000) }; ObjectProvider objProvider = new ObjectProvider(data); chart1.getDataSourceSettings().setDataSource(objProvider); }public static class SouthAmericaPopulation { public SouthAmericaPopulation(String country, double population) { this.setCountry(country); this.setPopulation(population); } private String privateCountry; public final String getCountry() { return privateCountry; } public final void setCountry(String value) { privateCountry = value; } private double privatePopulation; public final double getPopulation() { return privatePopulation; } public final void setPopulation(double value) { privatePopulation = value; } }public static class Countries { public Countries(String country, double lei, double gdppc, java.awt.Image flag) { this.setCountry(country); this.setLEI(lei); this.setGDPPC(gdppc); this.setFlag(flag); } private String privateCountry; public final String getCountry() { return privateCountry; } public final void setCountry(String value) { privateCountry = value; } private double privateLEI; public final double getLEI() { return privateLEI; } public final void setLEI(double value) { privateLEI = value; } private double privateGDPPC; public final double getGDPPC() { return privateGDPPC; } public final void setGDPPC(double value) { privateGDPPC = value; } private java.awt.Image privateFlag; public final java.awt.Image getFlag() { return privateFlag; } public final void setFlag(java.awt.Image value) { privateFlag = value; } }
- See Also:
resetBorderColor
-
setBorderColor
public void setBorderColor(java.awt.Color value)
Allows you to set the color of the border for a particular Cell or entire Row in the DataGrid.
For more information regarding the Color type, please refer to the Documentation.
Below, the border color for the first cell is set to Red:
chart1.getDataGrid().setVisible(true);
chart1.getDataGrid().getCells().get(0, 0).setBorderColor(new java.awt.Color(255,0,0,255));
chart1.getLegendBox().setVisible(false);
PopulateSouthAmericaPopulation(chart1);
chart1.setGallery(Gallery.BAR);
chart1.getLegendBox().setVisible(false);
chart1.getTitles().add(new TitleDockable("South American Countries Population"));
chart1.getAxisY().setScaleUnit(1000000);
chart1.getAxisY().getTitle().setText("(in Millions)");
public static void PopulateSouthAmericaPopulation(Chart chart1) { SouthAmericaPopulation[] data = new SouthAmericaPopulation[]{ new SouthAmericaPopulation("Brazil", 201033000), new SouthAmericaPopulation("Colombia", 47130000), new SouthAmericaPopulation("Argentina", 41350000), new SouthAmericaPopulation("Peru", 30476000), new SouthAmericaPopulation("Venezuela", 29760000), new SouthAmericaPopulation("Chile", 16841000), new SouthAmericaPopulation("Ecuador", 15779000), new SouthAmericaPopulation("Bolivia", 10517000) }; ObjectProvider objProvider = new ObjectProvider(data); chart1.getDataSourceSettings().setDataSource(objProvider); }public static class SouthAmericaPopulation { public SouthAmericaPopulation(String country, double population) { this.setCountry(country); this.setPopulation(population); } private String privateCountry; public final String getCountry() { return privateCountry; } public final void setCountry(String value) { privateCountry = value; } private double privatePopulation; public final double getPopulation() { return privatePopulation; } public final void setPopulation(double value) { privatePopulation = value; } }public static class Countries { public Countries(String country, double lei, double gdppc, java.awt.Image flag) { this.setCountry(country); this.setLEI(lei); this.setGDPPC(gdppc); this.setFlag(flag); } private String privateCountry; public final String getCountry() { return privateCountry; } public final void setCountry(String value) { privateCountry = value; } private double privateLEI; public final double getLEI() { return privateLEI; } public final void setLEI(double value) { privateLEI = value; } private double privateGDPPC; public final double getGDPPC() { return privateGDPPC; } public final void setGDPPC(double value) { privateGDPPC = value; } private java.awt.Image privateFlag; public final java.awt.Image getFlag() { return privateFlag; } public final void setFlag(java.awt.Image value) { privateFlag = value; } }
- Parameters:
value-- See Also:
resetBorderColor
-
getBorderWidth
public int getBorderWidth()
Allows you to set the width of the Cell border in pixels for a particular Cell or entire Row in the DataGrid.
This method allows you to configure the width of the DataGrid Cell border using units other than pixels.
Below, the border width for the first cell is set to 4:
chart1.getDataGrid().setVisible(true);
chart1.getDataGrid().getCells().get(0, 0).setBorderWidth(4);
chart1.getLegendBox().setVisible(false);
PopulateCarProduction(chart1);
chart1.getTitles().add(new TitleDockable("Vehicles Production by Type"));
public static void PopulateCarProduction(Chart chart1) { CarProduction[] production = new CarProduction[] { new CarProduction("Jan", 1760, 535, 695 ) , new CarProduction("Feb", 1849, 395, 688 ) , new CarProduction("Mar", 2831, 685, 1047 ) , new CarProduction("Apr", 2851, 984, 1652 ) , new CarProduction("May", 2961, 1579, 1889 ) , new CarProduction("Jun", 1519, 1539, 1766 ) , new CarProduction("Jul", 2633, 1489, 1361 ) , new CarProduction("Aug", 1140, 650, 874 ) , new CarProduction("Sep", 1626, 653, 693 ) , new CarProduction("Oct", 1478, 2236, 786 ) , new CarProduction("Nov", 1306, 1937, 599 ) , new CarProduction("Dec", 1607, 2138, 678 ) }; ObjectProvider objProvider = new ObjectProvider(production); chart1.getDataSourceSettings().setDataSource(objProvider); }public static class CarProduction { private CarProduction(String month, int sedan, int coupe, int SUV) { this.setMonth(month); this.setSedan(sedan); this.setCoupe(coupe); this.setSUV(SUV); } private String privateMonth; public final String getMonth() { return privateMonth; } public final void setMonth(String value) { privateMonth = value; } private int privateSedan; public final int getSedan() { return privateSedan; } public final void setSedan(int value) { privateSedan = value; } private int privateCoupe; public final int getCoupe() { return privateCoupe; } public final void setCoupe(int value) { privateCoupe = value; } private int privateSUV; public final int getSUV() { return privateSUV; } public final void setSUV(int value) { privateSUV = value; } }
- See Also:
resetBorderWidth
-
setBorderWidth
public void setBorderWidth(int value)
Allows you to set the width of the Cell border in pixels for a particular Cell or entire Row in the DataGrid.
This method allows you to configure the width of the DataGrid Cell border using units other than pixels.
Below, the border width for the first cell is set to 4:
chart1.getDataGrid().setVisible(true);
chart1.getDataGrid().getCells().get(0, 0).setBorderWidth(4);
chart1.getLegendBox().setVisible(false);
PopulateCarProduction(chart1);
chart1.getTitles().add(new TitleDockable("Vehicles Production by Type"));
public static void PopulateCarProduction(Chart chart1) { CarProduction[] production = new CarProduction[] { new CarProduction("Jan", 1760, 535, 695 ) , new CarProduction("Feb", 1849, 395, 688 ) , new CarProduction("Mar", 2831, 685, 1047 ) , new CarProduction("Apr", 2851, 984, 1652 ) , new CarProduction("May", 2961, 1579, 1889 ) , new CarProduction("Jun", 1519, 1539, 1766 ) , new CarProduction("Jul", 2633, 1489, 1361 ) , new CarProduction("Aug", 1140, 650, 874 ) , new CarProduction("Sep", 1626, 653, 693 ) , new CarProduction("Oct", 1478, 2236, 786 ) , new CarProduction("Nov", 1306, 1937, 599 ) , new CarProduction("Dec", 1607, 2138, 678 ) }; ObjectProvider objProvider = new ObjectProvider(production); chart1.getDataSourceSettings().setDataSource(objProvider); }public static class CarProduction { private CarProduction(String month, int sedan, int coupe, int SUV) { this.setMonth(month); this.setSedan(sedan); this.setCoupe(coupe); this.setSUV(SUV); } private String privateMonth; public final String getMonth() { return privateMonth; } public final void setMonth(String value) { privateMonth = value; } private int privateSedan; public final int getSedan() { return privateSedan; } public final void setSedan(int value) { privateSedan = value; } private int privateCoupe; public final int getCoupe() { return privateCoupe; } public final void setCoupe(int value) { privateCoupe = value; } private int privateSUV; public final int getSUV() { return privateSUV; } public final void setSUV(int value) { privateSUV = value; } }
- Parameters:
value-- See Also:
resetBorderWidth
-
getFontStyle
public java.util.EnumSet<FontStyle> getFontStyle()
Allows you to set the style of the font for a particular Cell or entire Row in the DataGrid.
For more information regarding the FontStyle type, please refer to the Documentation.
Below, the font style for the first cell is set to Underline:
chart1.getDataGrid().setVisible(true);
chart1.getDataGrid().getCells().get(0, 0).setFontStyle(FontStyle.UNDERLINE);
chart1.getLegendBox().setVisible(false);
PopulateCarProduction(chart1);
chart1.getTitles().add(new TitleDockable("Vehicles Production by Type"));
public static void PopulateCarProduction(Chart chart1) { CarProduction[] production = new CarProduction[] { new CarProduction("Jan", 1760, 535, 695 ) , new CarProduction("Feb", 1849, 395, 688 ) , new CarProduction("Mar", 2831, 685, 1047 ) , new CarProduction("Apr", 2851, 984, 1652 ) , new CarProduction("May", 2961, 1579, 1889 ) , new CarProduction("Jun", 1519, 1539, 1766 ) , new CarProduction("Jul", 2633, 1489, 1361 ) , new CarProduction("Aug", 1140, 650, 874 ) , new CarProduction("Sep", 1626, 653, 693 ) , new CarProduction("Oct", 1478, 2236, 786 ) , new CarProduction("Nov", 1306, 1937, 599 ) , new CarProduction("Dec", 1607, 2138, 678 ) }; ObjectProvider objProvider = new ObjectProvider(production); chart1.getDataSourceSettings().setDataSource(objProvider); }public static class CarProduction { private CarProduction(String month, int sedan, int coupe, int SUV) { this.setMonth(month); this.setSedan(sedan); this.setCoupe(coupe); this.setSUV(SUV); } private String privateMonth; public final String getMonth() { return privateMonth; } public final void setMonth(String value) { privateMonth = value; } private int privateSedan; public final int getSedan() { return privateSedan; } public final void setSedan(int value) { privateSedan = value; } private int privateCoupe; public final int getCoupe() { return privateCoupe; } public final void setCoupe(int value) { privateCoupe = value; } private int privateSUV; public final int getSUV() { return privateSUV; } public final void setSUV(int value) { privateSUV = value; } }
You can also use this method with bitwise or to combine FontStyles.
chart1.getDataGrid().setVisible(true);
java.util.EnumSet<FontStyle> style = chart1.getDataGrid().getCells().get(0, 0).getFontStyle();

style.add(FontStyle.ITALIC);

chart1.getDataGrid().getCells().get(0, 0).setFontStyle(style);
chart1.getLegendBox().setVisible(false);
PopulateCarProduction(chart1);
chart1.getTitles().add(new TitleDockable("Vehicles Production by Type"));
public static void PopulateCarProduction(Chart chart1) { CarProduction[] production = new CarProduction[] { new CarProduction("Jan", 1760, 535, 695 ) , new CarProduction("Feb", 1849, 395, 688 ) , new CarProduction("Mar", 2831, 685, 1047 ) , new CarProduction("Apr", 2851, 984, 1652 ) , new CarProduction("May", 2961, 1579, 1889 ) , new CarProduction("Jun", 1519, 1539, 1766 ) , new CarProduction("Jul", 2633, 1489, 1361 ) , new CarProduction("Aug", 1140, 650, 874 ) , new CarProduction("Sep", 1626, 653, 693 ) , new CarProduction("Oct", 1478, 2236, 786 ) , new CarProduction("Nov", 1306, 1937, 599 ) , new CarProduction("Dec", 1607, 2138, 678 ) }; ObjectProvider objProvider = new ObjectProvider(production); chart1.getDataSourceSettings().setDataSource(objProvider); }public static class CarProduction { private CarProduction(String month, int sedan, int coupe, int SUV) { this.setMonth(month); this.setSedan(sedan); this.setCoupe(coupe); this.setSUV(SUV); } private String privateMonth; public final String getMonth() { return privateMonth; } public final void setMonth(String value) { privateMonth = value; } private int privateSedan; public final int getSedan() { return privateSedan; } public final void setSedan(int value) { privateSedan = value; } private int privateCoupe; public final int getCoupe() { return privateCoupe; } public final void setCoupe(int value) { privateCoupe = value; } private int privateSUV; public final int getSUV() { return privateSUV; } public final void setSUV(int value) { privateSUV = value; } }
- See Also:
resetFontStyle
-
setFontStyle
public void setFontStyle(java.util.EnumSet<FontStyle> value)
Allows you to set the style of the font for a particular Cell or entire Row in the DataGrid.
For more information regarding the FontStyle type, please refer to the Documentation.
Below, the font style for the first cell is set to Underline:
chart1.getDataGrid().setVisible(true);
chart1.getDataGrid().getCells().get(0, 0).setFontStyle(FontStyle.UNDERLINE);
chart1.getLegendBox().setVisible(false);
PopulateCarProduction(chart1);
chart1.getTitles().add(new TitleDockable("Vehicles Production by Type"));
public static void PopulateCarProduction(Chart chart1) { CarProduction[] production = new CarProduction[] { new CarProduction("Jan", 1760, 535, 695 ) , new CarProduction("Feb", 1849, 395, 688 ) , new CarProduction("Mar", 2831, 685, 1047 ) , new CarProduction("Apr", 2851, 984, 1652 ) , new CarProduction("May", 2961, 1579, 1889 ) , new CarProduction("Jun", 1519, 1539, 1766 ) , new CarProduction("Jul", 2633, 1489, 1361 ) , new CarProduction("Aug", 1140, 650, 874 ) , new CarProduction("Sep", 1626, 653, 693 ) , new CarProduction("Oct", 1478, 2236, 786 ) , new CarProduction("Nov", 1306, 1937, 599 ) , new CarProduction("Dec", 1607, 2138, 678 ) }; ObjectProvider objProvider = new ObjectProvider(production); chart1.getDataSourceSettings().setDataSource(objProvider); }public static class CarProduction { private CarProduction(String month, int sedan, int coupe, int SUV) { this.setMonth(month); this.setSedan(sedan); this.setCoupe(coupe); this.setSUV(SUV); } private String privateMonth; public final String getMonth() { return privateMonth; } public final void setMonth(String value) { privateMonth = value; } private int privateSedan; public final int getSedan() { return privateSedan; } public final void setSedan(int value) { privateSedan = value; } private int privateCoupe; public final int getCoupe() { return privateCoupe; } public final void setCoupe(int value) { privateCoupe = value; } private int privateSUV; public final int getSUV() { return privateSUV; } public final void setSUV(int value) { privateSUV = value; } }
You can also use this method with bitwise or to combine FontStyles.
chart1.getDataGrid().setVisible(true);
java.util.EnumSet<FontStyle> style = chart1.getDataGrid().getCells().get(0, 0).getFontStyle();

style.add(FontStyle.ITALIC);

chart1.getDataGrid().getCells().get(0, 0).setFontStyle(style);
chart1.getLegendBox().setVisible(false);
PopulateCarProduction(chart1);
chart1.getTitles().add(new TitleDockable("Vehicles Production by Type"));
public static void PopulateCarProduction(Chart chart1) { CarProduction[] production = new CarProduction[] { new CarProduction("Jan", 1760, 535, 695 ) , new CarProduction("Feb", 1849, 395, 688 ) , new CarProduction("Mar", 2831, 685, 1047 ) , new CarProduction("Apr", 2851, 984, 1652 ) , new CarProduction("May", 2961, 1579, 1889 ) , new CarProduction("Jun", 1519, 1539, 1766 ) , new CarProduction("Jul", 2633, 1489, 1361 ) , new CarProduction("Aug", 1140, 650, 874 ) , new CarProduction("Sep", 1626, 653, 693 ) , new CarProduction("Oct", 1478, 2236, 786 ) , new CarProduction("Nov", 1306, 1937, 599 ) , new CarProduction("Dec", 1607, 2138, 678 ) }; ObjectProvider objProvider = new ObjectProvider(production); chart1.getDataSourceSettings().setDataSource(objProvider); }public static class CarProduction { private CarProduction(String month, int sedan, int coupe, int SUV) { this.setMonth(month); this.setSedan(sedan); this.setCoupe(coupe); this.setSUV(SUV); } private String privateMonth; public final String getMonth() { return privateMonth; } public final void setMonth(String value) { privateMonth = value; } private int privateSedan; public final int getSedan() { return privateSedan; } public final void setSedan(int value) { privateSedan = value; } private int privateCoupe; public final int getCoupe() { return privateCoupe; } public final void setCoupe(int value) { privateCoupe = value; } private int privateSUV; public final int getSUV() { return privateSUV; } public final void setSUV(int value) { privateSUV = value; } }
- Parameters:
value-- See Also:
resetFontStyle
-
getTextColor
public java.awt.Color getTextColor()
Allows you to set the text color for a particular Cell or entire Row in the DataGrid.
For more information regarding the Color type, please refer to the Documentation.
Below, the text color for the first cell is set to Red:
chart1.getDataGrid().setVisible(true);
chart1.getDataGrid().getCells().get(0, 0).setTextColor(new java.awt.Color(255,0,0,255));
chart1.getLegendBox().setVisible(false);
PopulateSouthAmericaPopulation(chart1);
chart1.setGallery(Gallery.BAR);
chart1.getLegendBox().setVisible(false);
chart1.getTitles().add(new TitleDockable("South American Countries Population"));
chart1.getAxisY().setScaleUnit(1000000);
chart1.getAxisY().getTitle().setText("(in Millions)");
public static void PopulateSouthAmericaPopulation(Chart chart1) { SouthAmericaPopulation[] data = new SouthAmericaPopulation[]{ new SouthAmericaPopulation("Brazil", 201033000), new SouthAmericaPopulation("Colombia", 47130000), new SouthAmericaPopulation("Argentina", 41350000), new SouthAmericaPopulation("Peru", 30476000), new SouthAmericaPopulation("Venezuela", 29760000), new SouthAmericaPopulation("Chile", 16841000), new SouthAmericaPopulation("Ecuador", 15779000), new SouthAmericaPopulation("Bolivia", 10517000) }; ObjectProvider objProvider = new ObjectProvider(data); chart1.getDataSourceSettings().setDataSource(objProvider); }public static class SouthAmericaPopulation { public SouthAmericaPopulation(String country, double population) { this.setCountry(country); this.setPopulation(population); } private String privateCountry; public final String getCountry() { return privateCountry; } public final void setCountry(String value) { privateCountry = value; } private double privatePopulation; public final double getPopulation() { return privatePopulation; } public final void setPopulation(double value) { privatePopulation = value; } }public static class Countries { public Countries(String country, double lei, double gdppc, java.awt.Image flag) { this.setCountry(country); this.setLEI(lei); this.setGDPPC(gdppc); this.setFlag(flag); } private String privateCountry; public final String getCountry() { return privateCountry; } public final void setCountry(String value) { privateCountry = value; } private double privateLEI; public final double getLEI() { return privateLEI; } public final void setLEI(double value) { privateLEI = value; } private double privateGDPPC; public final double getGDPPC() { return privateGDPPC; } public final void setGDPPC(double value) { privateGDPPC = value; } private java.awt.Image privateFlag; public final java.awt.Image getFlag() { return privateFlag; } public final void setFlag(java.awt.Image value) { privateFlag = value; } }
- See Also:
resetTextColor
-
setTextColor
public void setTextColor(java.awt.Color value)
Allows you to set the text color for a particular Cell or entire Row in the DataGrid.
For more information regarding the Color type, please refer to the Documentation.
Below, the text color for the first cell is set to Red:
chart1.getDataGrid().setVisible(true);
chart1.getDataGrid().getCells().get(0, 0).setTextColor(new java.awt.Color(255,0,0,255));
chart1.getLegendBox().setVisible(false);
PopulateSouthAmericaPopulation(chart1);
chart1.setGallery(Gallery.BAR);
chart1.getLegendBox().setVisible(false);
chart1.getTitles().add(new TitleDockable("South American Countries Population"));
chart1.getAxisY().setScaleUnit(1000000);
chart1.getAxisY().getTitle().setText("(in Millions)");
public static void PopulateSouthAmericaPopulation(Chart chart1) { SouthAmericaPopulation[] data = new SouthAmericaPopulation[]{ new SouthAmericaPopulation("Brazil", 201033000), new SouthAmericaPopulation("Colombia", 47130000), new SouthAmericaPopulation("Argentina", 41350000), new SouthAmericaPopulation("Peru", 30476000), new SouthAmericaPopulation("Venezuela", 29760000), new SouthAmericaPopulation("Chile", 16841000), new SouthAmericaPopulation("Ecuador", 15779000), new SouthAmericaPopulation("Bolivia", 10517000) }; ObjectProvider objProvider = new ObjectProvider(data); chart1.getDataSourceSettings().setDataSource(objProvider); }public static class SouthAmericaPopulation { public SouthAmericaPopulation(String country, double population) { this.setCountry(country); this.setPopulation(population); } private String privateCountry; public final String getCountry() { return privateCountry; } public final void setCountry(String value) { privateCountry = value; } private double privatePopulation; public final double getPopulation() { return privatePopulation; } public final void setPopulation(double value) { privatePopulation = value; } }public static class Countries { public Countries(String country, double lei, double gdppc, java.awt.Image flag) { this.setCountry(country); this.setLEI(lei); this.setGDPPC(gdppc); this.setFlag(flag); } private String privateCountry; public final String getCountry() { return privateCountry; } public final void setCountry(String value) { privateCountry = value; } private double privateLEI; public final double getLEI() { return privateLEI; } public final void setLEI(double value) { privateLEI = value; } private double privateGDPPC; public final double getGDPPC() { return privateGDPPC; } public final void setGDPPC(double value) { privateGDPPC = value; } private java.awt.Image privateFlag; public final java.awt.Image getFlag() { return privateFlag; } public final void setFlag(java.awt.Image value) { privateFlag = value; } }
- Parameters:
value-- See Also:
resetTextColor
-
resetBackColor
public void resetBackColor()
Set the property BackColor to its default value.- See Also:
setBackColor
-
resetBorderColor
public void resetBorderColor()
Set the property BorderColor to its default value.- See Also:
setBorderColor
-
resetBorderWidth
public void resetBorderWidth()
Set the property BorderWidth to its default value.- See Also:
setBorderWidth
-
resetFontStyle
public void resetFontStyle()
Set the property FontStyle to its default value.- See Also:
setFontStyle
-
resetTextColor
public void resetTextColor()
Set the property TextColor to its default value.- See Also:
setTextColor
-
-