- java.lang.Object
-
- com.softwarefx.chartfx.server.ToolBarItem
-
public final class ToolBarItem
extends java.lang.Object
Provides access to an item ot the ToolBar object.
The
ToolBarItemclass is accessed using the indexer of thesetToolBarclass. Please refer to thesetmethod of thesetToolBarclass for more information.Each ToolBarItem object needs to be associated with a Command object. Since a Command object is uniquely identified by an ID, a ToolBarItem is associated to a Command object using the
setCommandIdmethod. Besides, the CommandStyle method provides a shortcut to the style of the associated Command.In the following screenshot, a custom command has been defined using the
setCommandsmethod of theChart. The first item of thesetToolBarobject has been associated to this custom Command: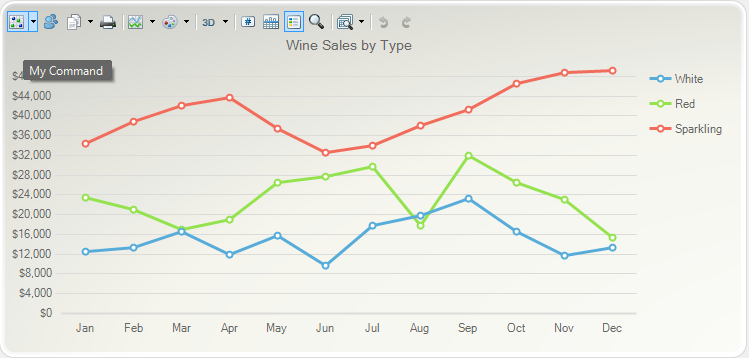
-
-
Constructor Summary
Constructors Constructor and Description ToolBarItem()Constructs a newly allocated ToolBarItem objectToolBarItem(CommandId commandId)Constructs a newly allocated ToolBarItem objectToolBarItem(int commandId)Constructs a newly allocated ToolBarItem object
-
Method Summary
Methods Modifier and Type Method and Description intgetCommandId()Gets or sets the Command ID of the ToolBarItem.voidsetCommandId(int value)Gets or sets the Command ID of the ToolBarItem.
-
-
-
Constructor Detail
-
ToolBarItem
public ToolBarItem()
Constructs a newly allocated ToolBarItem object
-
ToolBarItem
public ToolBarItem(CommandId commandId)
Constructs a newly allocated ToolBarItem object- Parameters:
commandId-
-
ToolBarItem
public ToolBarItem(int commandId)
Constructs a newly allocated ToolBarItem object- Parameters:
commandId-
-
-
Method Detail
-
getCommandId
public int getCommandId()
Gets or sets the Command ID of the ToolBarItem.
A Command ID is a unique identifier. Please refer to the Commands List available in Chart FX.
Below, the first command of the
setToolBaris related to the CommandId.About command:chart1.getToolBar().setVisible(true); chart1.getToolBar().get(0).setCommandId(CommandId.ABOUT); PopulateProductSales(chart1); chart1.getTitles().add(new TitleDockable("Wine Sales by Type")); chart1.getAxisY().getLabelsFormat().setFormat(AxisFormat.CURRENCY);public static void PopulateProductSales(Chart chart1) { ProductSales[] data = new ProductSales[]{ new ProductSales("Jan", 12560, 23400, 34500), new ProductSales("Feb", 13400, 21000, 38900), new ProductSales("Mar", 16700, 17000, 42100), new ProductSales("Apr", 12000, 19020, 43800), new ProductSales("May", 15800, 26500, 37540), new ProductSales("Jun", 9800, 27800, 32580), new ProductSales("Jul", 17800, 29820, 34000), new ProductSales("Aug", 19800, 17800, 38000), new ProductSales("Sep", 23200, 32000, 41300), new ProductSales("Oct", 16700, 26500, 46590), new ProductSales("Nov", 11800, 23000, 48700), new ProductSales("Dec", 13400, 15400, 49100) }; ObjectProvider objProvider = new ObjectProvider(data); chart1.getDataSourceSettings().setDataSource(objProvider); }public static class ProductSales { public ProductSales(String month, double white, double red, double sparkling) { this.setMonth(month); this.setWhite(white); this.setRed(red); this.setSparkling(sparkling); } private String privateMonth; public final String getMonth() { return privateMonth; } public final void setMonth(String value) { privateMonth = value; } private double privateWhite; public final double getWhite() { return privateWhite; } public final void setWhite(double value) { privateWhite = value; } private double privateRed; public final double getRed() { return privateRed; } public final void setRed(double value) { privateRed = value; } private double privateSparkling; public final double getSparkling() { return privateSparkling; } public final void setSparkling(double value) { privateSparkling = value; } }
-
setCommandId
public void setCommandId(int value)
Gets or sets the Command ID of the ToolBarItem.
A Command ID is a unique identifier. Please refer to the Commands List available in Chart FX.
Below, the first command of the
setToolBaris related to the CommandId.About command:chart1.getToolBar().setVisible(true); chart1.getToolBar().get(0).setCommandId(CommandId.ABOUT); PopulateProductSales(chart1); chart1.getTitles().add(new TitleDockable("Wine Sales by Type")); chart1.getAxisY().getLabelsFormat().setFormat(AxisFormat.CURRENCY);public static void PopulateProductSales(Chart chart1) { ProductSales[] data = new ProductSales[]{ new ProductSales("Jan", 12560, 23400, 34500), new ProductSales("Feb", 13400, 21000, 38900), new ProductSales("Mar", 16700, 17000, 42100), new ProductSales("Apr", 12000, 19020, 43800), new ProductSales("May", 15800, 26500, 37540), new ProductSales("Jun", 9800, 27800, 32580), new ProductSales("Jul", 17800, 29820, 34000), new ProductSales("Aug", 19800, 17800, 38000), new ProductSales("Sep", 23200, 32000, 41300), new ProductSales("Oct", 16700, 26500, 46590), new ProductSales("Nov", 11800, 23000, 48700), new ProductSales("Dec", 13400, 15400, 49100) }; ObjectProvider objProvider = new ObjectProvider(data); chart1.getDataSourceSettings().setDataSource(objProvider); }public static class ProductSales { public ProductSales(String month, double white, double red, double sparkling) { this.setMonth(month); this.setWhite(white); this.setRed(red); this.setSparkling(sparkling); } private String privateMonth; public final String getMonth() { return privateMonth; } public final void setMonth(String value) { privateMonth = value; } private double privateWhite; public final double getWhite() { return privateWhite; } public final void setWhite(double value) { privateWhite = value; } private double privateRed; public final double getRed() { return privateRed; } public final void setRed(double value) { privateRed = value; } private double privateSparkling; public final double getSparkling() { return privateSparkling; } public final void setSparkling(double value) { privateSparkling = value; } }
- Parameters:
value-
-
-