 com.softwarefx.chartfx.server.AxisSectionBase
com.softwarefx.chartfx.server.Axis
com.softwarefx.chartfx.server.AxisSectionBase
com.softwarefx.chartfx.server.Axis
|
Chart FX 7 for Java Server | |||||||
| PREV CLASS NEXT CLASS | FRAMES NO FRAMES | |||||||
| SUMMARY: NESTED | FIELD | CONSTR | METHOD | DETAIL: FIELD | CONSTR | METHOD | |||||||
java.lang.Object
public abstract class Axis
This is the base for the Axis object.
Axes are one of the most important aspects in a chart since they provide users with visual means to read and analyze data; therefore, a charting tool must provide mechanisms to manipulate axis settings programmatically.
Chart FX for Java automatically configures the chart's axes accommodating the data that was used to populate the chart. This behavior will minimize the initial programming effort of customizing the chart's axes; however, in some cases, programmers will face complex needs like special labeling, scrolling, formatting, and scaling that must be addressed via code. To achieve this, Chart FX for Java provides a powerful object-oriented API so programmers can customize virtually any axis setting.
It's important to be aware that Chart FX for Java supports many different axes: The main Y-Axis, the Secondary Y-Axis and the X-Axis as illustrated in the following figure:
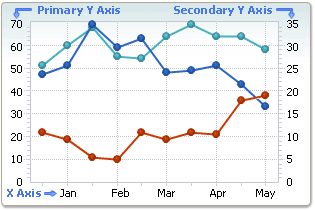
Normally, the X-Axis is a categorical axis (although it can also be a numerical axis in XY Plots) and the Y axes are numerical axes that you can independently control through different properties available in the axis object.
The Chart.setAxesStyle(com.softwarefx.chartfx.server.AxesStyle) property of the Chart
Class
is also used to change the style of all the axes surrounding the chart area.
| Constructor Summary | |
|---|---|
Axis()
|
|
| Method Summary | |
|---|---|
void |
adjustScale()
Adjusts the selected axis to "nice" scale values. |
CustomGridLineCollection |
getCustomGridLines()
Gets the collection of CustomGridLines that belong to the Chart. |
double[] |
getCustomSteps()
Gets the CustomSteps. |
ValueFormat |
getDataFormat()
Used to format the data displayed on point labels, and tool tips shown at mouseover. |
int |
getFirstLabel()
Gets the FirstLabel. |
Font |
getFont()
Gets the Font. |
LabelCollection |
getKeyLabels()
Used to assign a key (short) legend to tickmarks in a categorical axis. |
short |
getLabelAngle()
Gets the LabelAngle. |
LabelCollection |
getLabels()
Allows you to get or set the tick mark labels for the selected axis. |
ValueFormat |
getLabelsFormat()
Used to format the labels displayed on the selected axis. |
StringTrimming |
getLabelTrimming()
Gets the LabelTrimming. |
double |
getLabelValue()
Gets the LabelValue. |
Line |
getLine()
Allows you to apply supported Line Class members to a selected axis line. |
double |
getLineSpacing()
Gets the LineSpacing. |
double |
getLogBase()
Gets the LogBase. |
double |
getMax()
Gets the Max. |
int |
getMaxSizePercentage()
Gets the MaxSizePercentage. |
double |
getMin()
Gets the Min. |
double |
getMinorStep()
Gets the MinorStep. |
double |
getPixelsPerUnit()
Gets the PixelsPerUnit. |
AxisPosition |
getPosition()
Gets the Position. |
double |
getScaleUnit()
Gets the ScaleUnit. |
int |
getScrollPosition()
Gets the ScrollPosition. |
int |
getScrollSize()
Returns the number of scrolls in a chart based on the scroll view configuration. |
double |
getScrollViewMax()
Error: Member Axis.ScrollViewMax member not found |
double |
getScrollViewMin()
Error: Member Axis.ScrollViewMin member not found |
AxisSectionCollection |
getSections()
Returns a selected AxisSection object. |
int |
getSeparation()
Gets the Separation. |
double |
getStep()
Gets the Step. |
EnumSet<AxisStyles> |
getStyle()
Gets the Style. |
Title |
getTitle()
Gets the Title. |
boolean |
isAutoScale()
Gets the AutoScale. |
boolean |
isAutoScroll()
Gets the AutoScroll. |
boolean |
isForceZero()
Gets the ForceZero. |
boolean |
isHorizontal()
Returns a boolean value specifying whether the selected axis is a horizontal or vertical axis. |
boolean |
isInverted()
Gets the Inverted. |
boolean |
isNotify()
Gets the Notify. |
boolean |
isStaggered()
Gets the Staggered. |
boolean |
isVisible()
Gets the Visible. |
double |
pixelToValue(int pixel)
Converts a position in pixels in the chart area to its representation on the respective axis. |
void |
resetScale()
Prepares the selected axis to receive new data by resetting scale values. |
void |
setAutoScale(boolean value)
Instructs Chart FX for Java to always recalculate the specified Axis scale values (Min, Max) when new values are set to the chart. |
void |
setAutoScroll(boolean value)
Enables or disables scrolling in an Axis. |
void |
setCustomSteps(double[] value)
Allows you to set a custom step for the selected axis. |
void |
setFirstLabel(int value)
Sets a value used to customize the first label displayed on a selected axis. |
void |
setFont(Font value)
Allows you to change the label Font attributes of the selected axis. |
void |
setForceZero(boolean value)
Used to set the minimum value of a numerical axis to zero even if the data minimum value does not start at zero. |
void |
setInverted(boolean value)
Sets a selected numerical axis max value lesser than the min value. |
void |
setLabelAngle(short value)
Sets the text rotation for the labels in the selected axis. |
void |
setLabelTrimming(StringTrimming value)
Sets a StringTrimming value. |
void |
setLabelValue(double value)
Allows you to set and associate text labels to major tick marks in a numerical axis. |
void |
setLineSpacing(double value)
Sets a value indicating the LineSpacing for an axis. |
void |
setLogBase(double value)
Used to set a logarithmic scale for a numerical axis and recalculate the values as powers equal to the setting of this property. |
void |
setMax(double value)
Sets the Max value assigned to the specified axis. |
void |
setMaxSizePercentage(int value)
Allows you to specify the maximum percentage of the chart area the AxisX labels may occupy. |
void |
setMin(double value)
Sets the Min value assigned to the specified axis. |
void |
setMinorStep(double value)
Specifies the increment you want between minor tick marks and minor gridlines (if they are displayed) on the selected axis. |
void |
setNotify(boolean value)
Used to enable or disable the GetAxisLabel event so you can customize labels on the specified axis. |
void |
setPixelsPerUnit(double value)
Gives you the ability to control how many pixels per unit are in the selected axis. |
void |
setPosition(AxisPosition value)
Specifies the placement of the axis labels and tick marks relative to the chart. |
void |
setScaleUnit(double value)
Returns or sets the scale unit of a selected axis. |
void |
setScrollPosition(int value)
Allows you to set the starting scroll position when a chart is scrollable. |
void |
setScrollView(double min,
              double max)
Creates a scroll bar to view a portion of the selected axis. |
void |
setSeparation(int value)
Allows you to specify a gap in pixels between multiple axis. |
void |
setStaggered(boolean value)
Alternates the level of the axis labels for the selected axis. |
void |
setStep(double value)
Specifies the interval of major tick marks and gridlines on the selected axis. |
void |
setStyle(EnumSet<AxisStyles> value)
Allows you to add additional styles to the selected axis. |
void |
setTitle(Title value)
Sets the title for a specific axis. |
void |
setVisible(boolean value)
Shows or hides the lines, labels, tick marks and grids for the selected axis. |
int |
valueToPixel(double value)
Converts a value to its position in pixels on a selected axis. |
void |
zoom(double min,
     double max)
Allows you to specify a min and max zoom value for a selected axis. |
void |
zoomOff()
Allows you to ignore any zoom attributes set using the Zoom method and return to the default axis view. |
| Methods inherited from class com.softwarefx.chartfx.server.AxisSectionBase |
|---|
getGrids, getLink, getTextColor, setTextColor |
| Methods inherited from class java.lang.Object |
|---|
equals, getClass, hashCode, notify, notifyAll, toString, wait, wait, wait |
| Constructor Detail |
|---|
public Axis()
| Method Detail |
|---|
public void adjustScale()
Adjusts the selected axis to "nice" scale values.
This method is ONLY useful if the setAutoScale(boolean) property is disabled, as Chart FX will recalculate scale values and adjust the axis accordingly. But if you disable the AutoScale feature to set your own Min and Max (and Step when applicable) you can use this method to round them to "nice" values.
"Nice" values are calculated according to the values associated with the axis in powers of 10, For example:
If your y axis ranges from 0-18, the AdjustScale method can round the Max value to 20.
If your y axis ranges from 0-0.56, the AdjustScale method can round the Max Value to 0.6.
If your y axis ranges from 0-234, the AdjustScale method can round the Max Value to 300.
This method will not affect the setStep(double) and setMinorStep(double) properties if they have been previously set. To make sure they respond to this method, make sure the Step and MinorStep properties are set to zero (0).
A typical case of when to use this method is when you disable the setAutoScale(boolean) property to calculate your Min and Max and any of them are not a "nice" number because they are being calculated according to the data being sent to the chart. At this time, you can invoke the AdjustScale method so they are rounded to "nice" numbers.
setAutoScale(boolean),
setMinorStep(double),
setStep(double),
Axispublic CustomGridLineCollection getCustomGridLines()
Gets the collection of CustomGridLines that belong to the Chart.
CustomGridLines are lines that you can draw anywhere in the chart area and they associate themselves with a particular value in the Axis that they are assigned to.
public double[] getCustomSteps()
Gets the CustomSteps. For more detail see setCustomSteps(double[]).
public ValueFormat getDataFormat()
Used to format the data displayed on point labels, and tool tips shown at mouseover.
The PointLabelAttributes.setFormat(java.lang.String) property of the PointLabelAttributes
Class
will overwrite the settings to the point labels using this property; however, the mouse over tips will keep the DataFormat set.
The getLabelsFormat() property can be used to format the selected axis labels.
Setting this property for the chart will also format the data viewed via the chart's data editor.
PointLabelAttributes.setFormat(java.lang.String),
getLabelsFormat(),
PointAttributes.getPointLabels(),
Chart.getAxisX(),
Chart.getAxisY(),
Chart.getDataGrid(),
Chartpublic int getFirstLabel()
Gets the FirstLabel. For more detail see setFirstLabel(int).
public Font getFont()
Gets the Font. For more detail see setFont(java.awt.Font).
public LabelCollection getKeyLabels()
Used to assign a key (short) legend to tickmarks in a categorical axis.
You normally use the getLabels() property to assign labels to the tickmarks in the X axis (when it is categorical); however, depending on the amount of points in the chart, these labels may be too long to properly fit in the space allotted for each tickmark in the X axis.
You can control the frequency or how labels are displayed with other properties supported by the Axis object; sometimes you will still have space limitations because of the size of the chart or the number of points.
This property can help you display shorter labels in the X axis while maintaining longer labels in the legend window. Let's give you an example:
Let's suppose you have assigned the following labels to the X axis using the Label property:
"January", "February", "March", "April", "May", "June", "July", "August", "September", "October", "November" and "December"
Now, these labels may or may not fit in the space allotted for each tickmark in the X axis. If one of them does not fit, Chart FX for Java will immediately display a TAG (red number) indicating that such label can not fit in the space allotted for it. This problem increases as the number of points in the chart increases as well.
With this property you can assign key labels (shorter strings) like: "Jan","Feb","Mar",Apr", etc... that will be displayed in the X axis itself, while the Legend window will display both the Key Legend and the Legend set with the Label property.
Chart.getAxisX(),
Chart.getAxisY(),
getLabels(),
Chart.getLegendBox(),
Chart,
LegendBoxpublic short getLabelAngle()
Gets the LabelAngle. For more detail see setLabelAngle(short).
public StringTrimming getLabelTrimming()
Gets the LabelTrimming. For more detail see setLabelTrimming(com.softwarefx.StringTrimming).
public double getLabelValue()
Gets the LabelValue. For more detail see setLabelValue(double).
public LabelCollection getLabels()
Allows you to get or set the tick mark labels for the selected axis.
This property is used to read or write labels for a categorical axis. Normally, the X axis is a categorical axis containing labels associated with each major tick mark, while the Y axis is a numerical axis where labels are controlled by the scale (Min, Max, etc) and numerical data contained in the chart.
You can set as many labels as points are available in the chart. These labels will be shown in the major tick marks of the selected axis. Some of them can be left empty so no labels are shown on that specific major tick mark.
You can control how frequent these labels are displayed by using the setStep(double) property. Label visual attributes like rotation, color, and font are also accessible through the setLabelAngle(short), AxisSectionBase.setTextColor(java.awt.Color), and setFont(java.awt.Font) properties, respectively.
By default, Chart FX for Java does not associate any labels to the categorical axis (X axis) and a "TAG" number will be shown. When you use this property, the TAG numbers will be replaced by settings specified in this property.
When used in conjunction with the setLabelValue(double) property, this property can be used to set string values to a numerical axis.
You can easily remove all labels set to an axis with the DataValues.clear() method of the DataValues
Class
.
The DataValues.getLabels() property of the DataValues
Class
is a shortcut to the Labels property of the main Chart.getAxisX() object of the Chart.
Chart.getAxisX(),
Chart.getAxisY(),
setStep(double),
setLabelAngle(short),
setLabelValue(double),
AxisSectionBase.setTextColor(java.awt.Color),
setFont(java.awt.Font),
DataValues.clear(),
Chartpublic ValueFormat getLabelsFormat()
Used to format the labels displayed on the selected axis.
This property allows you to format axis labels without affecting the format of the data values contained in the chart.
You can use the getDataFormat() property to set a format for selected point labels, mouseover tips or values.
Chart.getAxisX(),
Chart.getAxisY(),
getDataFormat(),
Chart,
ValueFormatpublic Line getLine()
Allows you to apply supported Line Class members to a selected axis line.
You may control the Line.setColor(java.awt.Color), Line.setWidth(int), and Line.setStyle(com.softwarefx.DashStyle) properties of the selected line using the supported members of the Line
Class
.
The Line.setEndCap(com.softwarefx.LineCap) and Line.setStartCap(com.softwarefx.LineCap) properties allow you to configured various shapes at the beginning and end of a selected line.
Below, the Y axis line color is set to red:
Line.setColor(java.awt.Color),
Line.setWidth(int),
Line.setStyle(com.softwarefx.DashStyle),
Line.setEndCap(com.softwarefx.LineCap),
Line.setStartCap(com.softwarefx.LineCap),
Chart.getAxisX(),
Chart.getAxisY(),
Line,
Axispublic double getLineSpacing()
Gets the LineSpacing. For more detail see setLineSpacing(double).
public double getLogBase()
Gets the LogBase. For more detail see setLogBase(double).
public double getMax()
Gets the Max. For more detail see setMax(double).
public int getMaxSizePercentage()
Gets the MaxSizePercentage. For more detail see setMaxSizePercentage(int).
public double getMin()
Gets the Min. For more detail see setMin(double).
public double getMinorStep()
Gets the MinorStep. For more detail see setMinorStep(double).
public double getPixelsPerUnit()
Gets the PixelsPerUnit. For more detail see setPixelsPerUnit(double).
public AxisPosition getPosition()
Gets the Position. For more detail see setPosition(com.softwarefx.chartfx.server.AxisPosition).
public double getScaleUnit()
Gets the ScaleUnit. For more detail see setScaleUnit(double).
public int getScrollPosition()
Gets the ScrollPosition. For more detail see setScrollPosition(int).
public int getScrollSize()
Returns the number of scrolls in a chart based on the scroll view configuration.
You may set the scroll position using the setScrollPosition(int) property.
You may set the scroll view for a selected axis using the setScrollView(double, double) method. The #GetScrollViewMin and #GetScrollViewMax methods may be used to read these values.
setScrollPosition(int),
setScrollView(double, double)public double getScrollViewMax()
Error: Member Axis.ScrollViewMax member not found
ERROR: Doc member not found
public double getScrollViewMin()
Error: Member Axis.ScrollViewMin member not found
ERROR: Doc member not found
public AxisSectionCollection getSections()
Returns a selected AxisSection object.
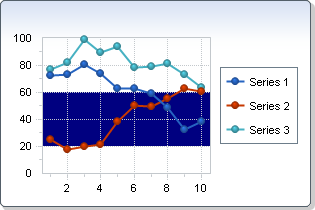
This property exposes the members of the AxisSection and AxisSectionBase classes. Please see the AxisSection and AxisSectionBaseclasses for additional information regarding those supported members.
Below, the axis have a section from 20 to 60:
AxisSection,
AxisSectionBasepublic int getSeparation()
Gets the Separation. For more detail see setSeparation(int).
public double getStep()
Gets the Step. For more detail see setStep(double).
public EnumSet<AxisStyles> getStyle()
Gets the Style. For more detail see setStyle(java.util.EnumSet.
public Title getTitle()
Gets the Title. For more detail see setTitle(com.softwarefx.chartfx.server.Title).
public boolean isAutoScale()
Gets the AutoScale. For more detail see setAutoScale(boolean).
public boolean isAutoScroll()
Gets the AutoScroll. For more detail see setAutoScroll(boolean).
public boolean isForceZero()
Gets the ForceZero. For more detail see setForceZero(boolean).
public boolean isHorizontal()
Returns a boolean value specifying whether the selected axis is a horizontal or vertical axis.
When the return value of this property is True, the selected axis is horizontal. If False, the selected axis is a vertical axis.
This property will return False if the selected axis has not been enabled in the chart.
Chart.getAxisX(),
Chart.getAxisY(),
Chartpublic boolean isInverted()
Gets the Inverted. For more detail see setInverted(boolean).
public boolean isNotify()
Gets the Notify. For more detail see setNotify(boolean).
public boolean isStaggered()
Gets the Staggered. For more detail see setStaggered(boolean).
public boolean isVisible()
Gets the Visible. For more detail see setVisible(boolean).
public double pixelToValue(int pixel)
Converts a position in pixels in the chart area to its representation on the respective axis.
The origin or (0,0) coordinate in pixels, is always positioned in the top/left corner of the chart, without including the toolbar or other tools that may be showing in the chart area.
This method is useful when customizing the chart painting or positioning annotation objects in the chart area. For example, you may want to convert a particular position in pixels to axis coordinates.
All the mouse events return an object that holds the X and Y pixel values where the mouse event was fired in the chart area. By converting the pixels you can determine the point value where the mouse event occured.
pixel - Chart.getAxisX(),
Chart.getAxisY(),
valueToPixel(double),
Chartpublic void resetScale()
Prepares the selected axis to receive new data by resetting scale values.
This method is to be called before new data is going to be sent to the chart.
This method resets all scale values for the selected axis. When new data is provided, Chart FX can recalculate values accordingly.
The affected scale values are:
setMin(double) and setMax(double) which are set to undefined so when new data arrives they can be calculated accordingly by Chart FX.
setStep(double) and setMinorStep(double) which are set to Automatic.
This method should be called before sending new data to the chart. Calling this method after setting the data to the chart will cause undesired results. Please refer to the Chart.recalculateScale() method to recalculate automatic values for existent data.
setMax(double),
setMin(double),
setStep(double),
setMinorStep(double),
Chartpublic void setAutoScale(boolean value)
Instructs Chart FX for Java to always recalculate the specified Axis scale values (Min, Max) when new values are set to the chart.
If you set a Min or Max value and new data is received by the chart when the AutoScale property is enabled, the scale values will be overwritten by
Chart FX for Java
. This method will not affect the Step property if it has previously set to a specific value. If you want the AutoScale property to recalculate the setStep(double) value, make sure the Step property is set to zero (0).
Instead of having the AutoScale enabled, you can call the Chart.recalculateScale() method so you can control when the axis scale values are actually overwritten.
Chart.getAxisX(),
Chart.getAxisY(),
setMin(double),
setMax(double),
setStep(double),
setMinorStep(double),
Chart.recalculateScale(),
Chartpublic void setAutoScroll(boolean value)
Enables or disables scrolling in an Axis.
When the axis is a categorical axis and the number of data points (or tick marks) do not fit in one screen,
Chart FX for Java
will display a scroll bar so the end user can scroll through the data (maintaining the tick mark separation set with the setPixelsPerUnit(double) property). This is particularly useful when the labels associated with tick marks are long strings but still important to improve chart's readability or when a particular marker separation is important.
In some other cases, having a scroll bar associated with the axis is not desired and you can use this property to force Chart FX for Java to display all data points in one screen. If you have a large number of points or long strings associated with tick marks this could affect the chart's readability and you'll need to reset the labels associated with the tick marks in the X axis.
This property controls the scroll bar when the axis is a categorical axis. If you want to show a scroll bar for a numerical axis, please refer to the setPixelsPerUnit(double) property or the setScrollView(double, double) method.
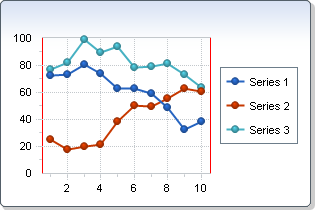
To scroll a chart, you may use the keyboard arrows or drag the scroll thumb with your mouse cursor.
Here the AutoScroll property has been set to True, notice the scroll thumb located along the X axis:
setPixelsPerUnit(double),
zoom(double, double),
setScrollView(double, double),
Axispublic void setCustomSteps(double[] value)
Allows you to set a custom step for the selected axis.
The CustomSteps property holds an array of numbers (double) that specifies a series of step values for the selected axis.
The step applied to the axis will begin to cycle if your chart contains enough points. For example, if you set the CustomStep to (5,10,20,30) the axis step would look like the following:
0,5,15,35,65,70,80,100,130,135,...
Below, the Y Axis custom step has been set to {5, 10, 20, 30}:
setStep(double),
setMinorStep(double),
Chart.getAxisX(),
Chart.getAxisY(),
Chartpublic void setFirstLabel(int value)
Sets a value used to customize the first label displayed on a selected axis.
The setting must be an integer specifying where you want labels to begin. The axis will then follow the setStep(double) associated with it to display subsequent labels.
When using this property in the X Axis of a chart with values ranging from 0 to 1, the axis' setMinorStep(double) is used to calculate which label is the first, second, third, etc. When X Axis values range >1, then the axis' setStep(double) is used for this calculation.
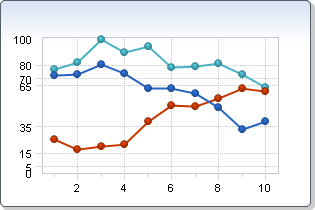
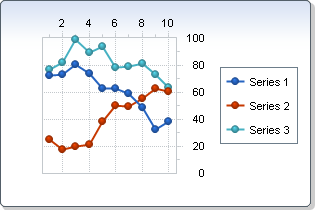
Below, the first label in the X-Axis is set to 3:
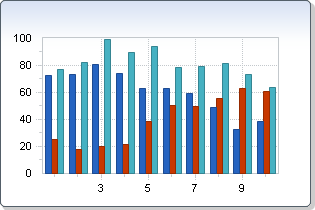
Chart.getAxisX(),
Chart.getAxisY(),
getLabels(),
getKeyLabels(),
setStep(double),
setMinorStep(double),
Chartpublic void setFont(Font value)
Allows you to change the label Font attributes of the selected axis.
The Font property is used to change the font settings for the labels in the selected axis; if you're trying to change the font settings for the axis title, please refer to the Title.setFont(java.awt.Font) Property of the Title object.
When setting a font in Chart FX for Java , you must create a new font object with the desired attributes and assign that object to the desired chart element every time you want to change the font.
For more information regarding the Font type, please refer to the Java API Documentation.
Below, the Y axis labels font is set to "Arial" 14:
public void setForceZero(boolean value)
Used to set the minimum value of a numerical axis to zero even if the data minimum value does not start at zero.
By default, Chart FX for Java will set the minimum value of a numerical axis to zero even if the data set starts at a greater value. If you want Chart FX for Java to automatically set the minimum value of the axis to the minimum value in the data passed, set this property to FALSE.
This property applies to numerical axes only.
public void setInverted(boolean value)
Sets a selected numerical axis max value lesser than the min value.
This property should be applied to a numerical axis. Assignment to categorical axes will not have an effect.
This property can only be applied to the X Axis in an XY plot chart. In an XY plot, the X Axis is a numerical axis rather than categorical.
When a selected axis is inverted, the alignment of the categorical axis of the chart will be reversed to make the chart more readable.
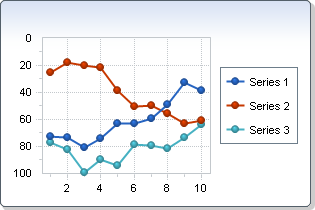
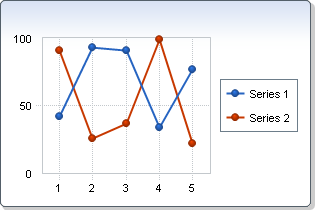
Below, the Y Axis is set to be inverted:
setMax(double),
setMin(double),
Chart.getAxisY(),
Chart.getAxisX(),
Chart.recalculateScale(),
Chartpublic void setLabelAngle(short value)
Sets the text rotation for the labels in the selected axis.
This property uses an integer (degrees) ranging from [-90,90], depending on the rotation angle you want to set. Set this property to 90 to show labels vertically.
In order to set this property, you must make sure that the font type associated with the axis is a True Type Font.
Use a positive number to rotate the labels from lower left to upper right. Use negative degrees to rotate the text from upper left to lower right.
If you would like to change the angle of PointLabels, you can use the PointLabelAttributes.setAngle(short) property of the PointLabelAttributes class.
Below, the X axis label angle is set to 90:
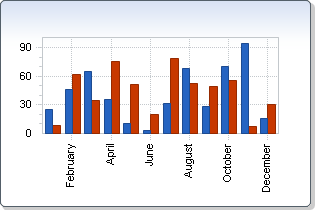
Chart.getAxisX(),
Chart.getAxisY(),
getLabels(),
PointLabelAttributes.setAngle(short),
Chartpublic void setLabelTrimming(StringTrimming value)
Sets a StringTrimming value.
The LabelTrimming property trims characters from a string that does not completely fit into a layout rectangle.
StringTrimmingpublic void setLabelValue(double value)
Allows you to set and associate text labels to major tick marks in a numerical axis.
This property can get or set the LabelValue assigned to any of the axes.
Normally, labels in a numerical axis are automatically controlled and displayed according to the setMin(double), setMax(double) and setStep(double) properties. In some cases, you'll need to associate text labels with a numerical axis (using the getLabels() property), but when any of the scale values (Min, Max, Step, etc) change, these labels will no longer serve their purpose as the tick marks will be recalculated according to scale settings.
For example, if you have a chart where the Y axis ranges from Min=0 to Max=100 and Step=25, you'll have 4 tick marks on 25,50,75 and 100. By default Chart FX for Java will display numbers (as labels) associated with each tick mark.
Now let's say you want to associate text labels (instead of the number) with each tick mark in the Y axis and you use the Label Property to set the following text labels: "Twenty-Five", "Fifty", "Seventy-Five", "One Hundred".
When you do this, everything will work out fine and the 4 tick marks will be labeled accordingly; however, if during the execution of your program or through user interaction, the Step suddenly changes from 25 to 12.5, you'll have 8 tick marks instead of 4 because you used the Label property with indexes 0,1,2 and 3, the "Fifty" tickmark will no longer correspond to the 50 value.
If you would have set the LabelValue Property to 25, when the Step changes from 25 to 12.5 Chart FX for Java will label every other tick mark and the labels will correspond to their initial setting.
Label visual attributes like rotation, color and font are also accessible through the setLabelAngle(short), AxisSectionBase.setTextColor(java.awt.Color), and setFont(java.awt.Font) properties, respectively.
Chart.getAxisX(),
Chart.getAxisY(),
setStep(double),
getLabels(),
setLabelAngle(short),
AxisSectionBase.setTextColor(java.awt.Color),
setFont(java.awt.Font),
Chartpublic void setLineSpacing(double value)
Sets a value indicating the LineSpacing for an axis.
This property specifies the LineSpacing for vertical axes. The labels in the selected axis will never be painted less than the configured LineSpacing.
Setting the LineSpacing property to 2 will instruct the axis to use double line spacing. Setting the value to 1 instructs the chart to use single line spacing. The default value is 1.5.
public void setLogBase(double value)
Used to set a logarithmic scale for a numerical axis and recalculate the values as powers equal to the setting of this property.
The LogBase property can be applied only to a numerical axis, a categorical axis will ignore this setting.
The LogBase property is a member of the axis object, therefore the axis object must be referenced in order to properly access the LogBase property.
No zeros or negative data values are permitted in logarithmic charts.
The setStep(double) and setMinorStep(double) properties setting must be equal or greater than the LogBase property setting.
Resetting the data contained in a chart will not automatically recalculate axis values, unless the Chart.recalculateScale() method is called.
The LogBase has been set to 10 in the following bar chart:
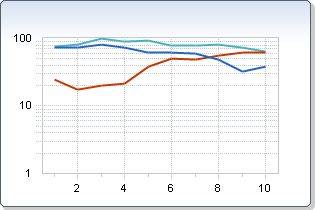
Chart.getAxisX(),
Chart.getAxisY(),
setMin(double),
setMax(double),
setStep(double),
setMinorStep(double),
Chart.recalculateScale(),
Chartpublic void setMax(double value)
Sets the Max value assigned to the specified axis.
The Max property can be applied only to a numerical axis, a categorical axis will ignore this setting.
The Max property is a member of the axis object, therefore the axis object must be referenced in order to properly access the Max property.
If no Max value is specified, Chart FX for Java will automatically set a maximum value according to the data provided, you can use this property to read or write this default value.
Resetting the data contained in a chart will not automatically set a new Max value unless the Chart.recalculateScale() method is called or the setAutoScale(boolean) property is set to True.
The value of the Max property must be greater than the value of the Min property.
There is no automatic method for aligning a main and secondary axis, it is required that you set the Min and Max in order to align them manually. The generic algorithm used to find these values is the following:
Axis.Min = OtherAxis.Min/(OtherAxis.Max / Axis.Max)
setAutoScale(boolean),
Chart.getAxisX(),
Chart.getAxisY(),
setMin(double),
Chart.recalculateScale(),
Chartpublic void setMaxSizePercentage(int value)
Allows you to specify the maximum percentage of the chart area the AxisX labels may occupy.
This property is particularly useful when plotting angled or vertical labels along the x-axis; since the labels may be too long thus shrinking the plotted area of the chart, you may want to set the setMaxSizePercentage(int) property to increase it.
This property may be configured with values ranging from 0 - 100. Specifying 0 will instruct Chart FX for Java to try hiding the labels area and cover it by the chart.
public void setMin(double value)
Sets the Min value assigned to the specified axis.
The Min property can be applied only to a numerical axis, a categorical axis will ignore this setting.
The Min property is a member of the axis object, therefore the axis object must be referenced in order to properly access the Min property.
If no Min value is specified, Chart FX for Java will automatically set a minimum value according to the data provided, you can use this property to read or write this default value.
Changing the data contained in a chart will not automatically set a new Min value unless the Chart.recalculateScale() method is called or the setAutoScale(boolean) property is set to True.
The value of the Min property must be lesser than the value of the Max property.
There is no automatic method for aligning a main and secondary axis, it is required that you set the Min and Max in order to align them manually. The generic algorithm used to find these values is the following:
Axis.Min = OtherAxis.Min/(OtherAxis.Max / Axis.Max)
setAutoScale(boolean),
Chart.getAxisX(),
Chart.getAxisY(),
setMax(double),
Chart.recalculateScale(),
Chartpublic void setMinorStep(double value)
Specifies the increment you want between minor tick marks and minor gridlines (if they are displayed) on the selected axis.
This property is used to control the interval of minor tick marks and gridlines in the selected axis. For example, if the selected axis ranges from 0-100 and you have specified a setStep(double) value of 10, labels and gridlines will appear at 10, 20, 30, etc. If you would like to have 5 minor tick marks in each major interval, set the MinorStep to 2. Please note the values for the Step and MinorStep properties are data related.
Labels will not appear at minor tick marks.
The value of the MinorStep Property must be lesser than the value of the setStep(double) property.
When using the setFirstLabel(int) property in the X Axis of a chart with values ranging from 0 to 1, the axis' MinorStep is used to calculate which label is the first, second, third, etc. When X Axis values range >1, then the axis' setStep(double) is used for this calcuation.
Below, the Y axis minorstep is set to 2:
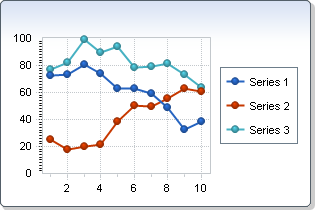
Chart.getAxisX(),
Chart.getAxisY(),
AxisSectionBase.getGrids(),
setAutoScale(boolean),
setStep(double),
setFirstLabel(int),
Chart.recalculateScale(),
Chartpublic void setNotify(boolean value)
Used to enable or disable the GetAxisLabel event so you can customize labels on the specified axis.
This property also applies to the GetPointLabel event.
Chart.getAxisX(),
Chart.getAxisY(),
Chartpublic void setPixelsPerUnit(double value)
Gives you the ability to control how many pixels per unit are in the selected axis.
This property is very useful if you want a scroll bar in the selected axis.
The Chart.getAxisY2() does not support scrolling capabilities; therefore, this property is not supported for the Secondary Y axis.
If the setAutoScroll(boolean) property is set to False, the PixelsPerUnit will not have any effect on the axis. Make sure that the AutoScroll property is set to True when using the PixelsPerUnit property.
The PixelsPerUnit property is very useful when you want to create a scroll bar associated with the selected axis or to increase the separation between tick marks. Its effect varies depending on the type of axis that is applied to. Below is a description of the PixelPerUnit based on the type of axis used:
Categorical Axis:
When you set a PixelsPerUnit to a categorical axis (e.g. X Axis) the value is an integer that will set the separation (physical distance measured in pixels) between major tick marks. The default PixelsPerUnit value for the X axis (when categorical) is 30 pixels. You may want to change the PixelsPerUnit value for a categorical axis when:
1) The labels associated with the chart are too long and do not fit in the allotted space. In this particular case the PixelsPerUnit should be increased. What will happen is that if all points do not fit in one screen, a scroll bar will be shown. This scenario requires the Scrollable Property to be set to True.
2) You want to fit more points in one screen. In this particular case the PixelsPerUnit should be decreased. You must be careful with Labels associated with each tick mark if the PixelsPerUnit is too small.
3) You want to view a specific amount of points per screen. In this particular case we recommend the use of the setScrollView(double, double) method as it will allow you to set these values without any calculations on your part.
4) If you don't want to show a scroll bar, you may set the PixelsPerUnit to zero (0). This will remove the scroll bar and Chart FX for Java will set the appropriate PixelsPerUnit to fit all values in one screen.
Numerical Axis:
When applied to a numerical axis (e.g. Y Axis), the PixelsPerUnit property is very useful to display a scroll bar and allow users to scroll through data without affecting the scale (Min, Max, Step) of the axis.
Because a numerical axis can be displayed in different units (currency, scientific, date, etc) is sometimes difficult to imagine what a PixelsPerUnit measures. This concept is even more complex when we take into consideration that a numerical axis ranges in different values (millions, thousands, fractions, etc).
When applied to a numerical axis, the PixelsPerUnit value is no longer an integer. The general rule of thumb is to take the size allotted to the chart (in pixels) divide it by the Maximum in the numeric axis and then divide that number by the number of pages you want the scroll bar to have.
For example, if you have a 400 pixels chart that ranges between Min=0 and Max=1 million and you want to create a scroll bar that contains 5 pages, the PixelsPerUnit should be set to:
PixelsPerUnit = (400/1000000)/5 = 0.00008, this means there are 0.00008 pixels per unit in the y axis.
On the other hand, if the same chart would have ranged between 0 and 1, the PixelsPerUnit setting must be calculated as follows:
PixelsPerUnit = (400/1)/5 = 80
Setting the PixelsPerUnit to zero(0) will remove the scroll bar and let Chart FX for Java calculate the appropriate PixelsPerUnit value.
In the following chart, the X axis PixelsPerUnit has been set to 60:
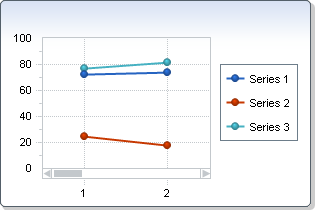
Chart.getAxisX(),
Chart.getAxisY(),
setStep(double),
setAutoScroll(boolean),
setScrollView(double, double),
Chartpublic void setPosition(AxisPosition value)
Specifies the placement of the axis labels and tick marks relative to the chart.
The Position property is a member of the axis object; therefore, the axis object must be referenced in order to set the property correctly.
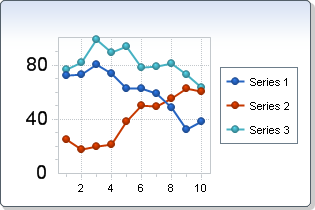
Both X and Y axes have the Axis Position set to Far position in order to switch their default locations:
Multiple axes may be created using the AxesX and the AxesY properties of the Chart
Class
.
Chart.getAxisX(),
Chart.getAxisY(),
getLabels(),
Chartpublic void setScaleUnit(double value)
Returns or sets the scale unit of a selected axis.
This constant is very useful when the values used on the Y axis are too big (i.e. 10,000,000) in this case you can use a 1,000,000 scale and the values on the Y axis will be divided by this scale.
The ScaleUnit property is a member of the axis object; therefore, the axis object must be referenced in order to set the property correctly.
Chart.getAxisX(),
Chart.getAxisY(),
setMax(double),
setMin(double),
Chart.recalculateScale(),
Chartpublic void setScrollPosition(int value)
Allows you to set the starting scroll position when a chart is scrollable.
The setAutoScroll(boolean) property of the chart must be set to True in order for the ScrollPosition to be properly used.
When you set the ScrollPosition, the first point included in the chart will be the configured point.
You can use the getScrollSize() property to read the total number of scrolls in the chart based on the current scroll range.
You can set the scroll range using the setScrollView(double, double) method.
getScrollSize(),
setScrollView(double, double),
Chart
public void setScrollView(double min,
                          double max)
Creates a scroll bar to view a portion of the selected axis.
Sometimes it is difficult to calculate the appropriate PixelsPerUnit value to create a view of an specific axis. This method allows you to set a min (starting point) and a max (ending point) that Chart FX will use to calculate the PixelsPerUnit and display the view.
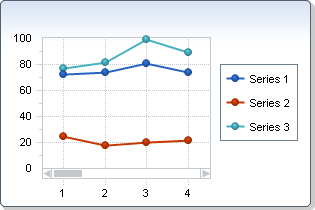
When applied to a categorical axis (e.g. X Axis), the Min and Max are integer numbers that range from 1 to the number of points you have in the axis. If you want to create a view (scroll bar) with 10 points per view and start at point 20, the settings for the Min should be 20 and the Max setting is 30
When applied to a numerical axis (e.g. Y Axis), you should set the Min and Max according to the scale values of the axis. For example, if your axis ranges between 0 and 1 you may set a view with Min = 0.3 and Max = 0.6
To destroy the view you can set the Min and Max to 0.
min - Where the view (scroll bar) begins.max - Where the view (scroll bar) ends.Chart.getAxisX(),
Chart.getAxisY(),
setPixelsPerUnit(double)public void setSeparation(int value)
Allows you to specify a gap in pixels between multiple axis.
This property is useful when multiple axes are configured and you need to create space for readability.
Chart.getAxisX(),
Chart.getAxisY(),
Chartpublic void setStaggered(boolean value)
Alternates the level of the axis labels for the selected axis.
Staggering axis labels can help improve chart readability when axis label strings are long.
Below, the X axis staggered property is set to true:

public void setStep(double value)
Specifies the interval of major tick marks and gridlines on the selected axis.
It also controls the gap or interval between labels in the selected axis.
Normally, you use this property to control the interval of labels, tick marks and gridlines in the selected axis. For example, if the selected axis ranges from 0 -100 and you want to show labels, tick marks or gridlines every 10 units, then the appropriate setting for the Step property is 10.
This property can also be used for a categorical axis. For example, if your X axis displays labels ranging from January to December and you set the Step property to 2, then the categorical axis will display legends every other month.
You can also control a minor interval with the setMinorStep(double) property.
If no Step value is specified, Chart FX for Java will automatically set a Step according to the data provided, you can use this property to read or write this default value.
Changing the data contained in a chart will not automatically change the Step value. If you want Chart FX to calculate an appropriate Step value automatically set the Step value to 0 (Automatic) or invoke the Chart.recalculateScale()method.
The value of the Step Property must be greater than the value of the setMinorStep(double) property.
In the example below, the Step for the Y axis has been set to 50. Notice the tick marks on the Y axis increase by 50:
When using the setFirstLabel(int) property in the X Axis of a chart with values ranging from 0 to 1, the axis' setMinorStep(double) is used to calculate which label is the first, second, third, etc. When X Axis values range >1, then the axis' Step is used for this calcuation.
Chart.getAxisX(),
Chart.getAxisY(),
AxisSectionBase.getGrids(),
setAutoScale(boolean),
setMinorStep(double),
setFirstLabel(int),
Chart.recalculateScale(),
Chartpublic void setStyle(EnumSet<AxisStyles> value)
Allows you to add additional styles to the selected axis.
This property is a mask property. This means all settings represent a bit in the word that you need to turn on or off according to what you want. For this purpose you will need to use the bitwise operators (And, Or, Not, Xor) provided by your development tool.
Because it is a mask property, you must make sure you use these operators to turn on/off bits and avoid losing previous settings to the property.
For example, if you want to turn ON the Interlaced setting the right way of setting this property is:
chart1.getAxisX().setStyle(chart1.getAxisX().getStyle() | AxisStyle.INTERLACED);
If you type the following code:
chart1.getAxisX().setStyle(AxisStyle.INTERLACED); (WRONG!)
You will erase all other settings in the property causing an erratic behavior of the library and an incorrect setting of the individual properties which also control these flags.
The Axis.Style property supports a flag called AutoFirstLabel (Default=ON) which automatically positions the first label to the closest number rounded to the axis step. For example, if a numeric axis starts at 7 with a Step of 10 and the AutoFirstLabel property is ON, the axis will show labels at 10,20,30 and so on. If the AutoFirstLabel property is turned off labels will be shown at 7,17,27 and so on.
Note: If the axis contains dates (Date Axis) the AutoFirstLabel property will position the first label at the end of the month. If the AutoFirstLabel is turned OFF, the labels will be shown using the first available date and advanced using the Step property setting.
Chart.getAxisX(),
Chart.getAxisY(),
Axis,
setMax(double),
setMin(double),
getLabels(),
Chart.recalculateScale(),
Chartpublic void setTitle(Title value)
Sets the title for a specific axis.
The Title property is a member of the axis object; therefore, the axis object must be referenced in order to properly utilize the Title property.
This property receives or returns a Title
Class
. By accessing the title object properties, you can change attributes like: Alignment, Color, Font, and Text.
This property is used to get or set the axis title. To set the chart top title, please refer to the chart's Chart.getTitles() property.
You can create a MultiLine title by including the chr(10) character.
You can create a MultiLine title by including the VbCrLf character.
Below is a chart with both X and Y Axis titles:
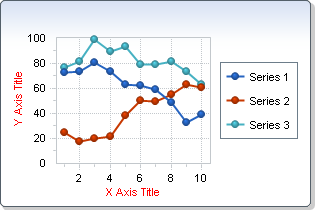
Chart.getAxisX(),
Chart.getAxisY(),
Title.setText(java.lang.String),
Chart,
Titlepublic void setVisible(boolean value)
Shows or hides the lines, labels, tick marks and grids for the selected axis.
The Visible property is a member of the axis object; therefore, the axis object must be referenced in order to properly utilize the Visible property.
By hiding the labels for the specified axis using the Visible property, other attributes such as the AxisSectionBase.getGrids() and tick marks are also hidden.
The X axis has been hidden in the chart below:
Chart.getAxisX(),
Chart.getAxisY(),
Chartpublic int valueToPixel(double value)
Converts a value to its position in pixels on a selected axis.
This method is useful when customizing the chart painting or positioning annotation objects in the chart area. You may want to convert a particular position in the chart area given in axis units to screen coordinates (pixels).
value - A double specifying the point value to be converted.Chart.getAxisX(),
Chart.getAxisY(),
pixelToValue(int),
Chart
public void zoom(double min,
                 double max)
Allows you to specify a min and max zoom value for a selected axis.
You may turn the zoom off using the zoomOff() method of the Axis Object.
If the Chart.setZoom(boolean) property of the Chart object is configured to False, all Axis specific zooms will be turned off.
min - Starting point of the zoom range.max - Ending point of the zoom range.Chart.getAxisX(),
Chart.getAxisY(),
Chart.getAxisY2(),
Chart.getAxesX(),
Chart.getAxesY(),
Chart.setZoom(boolean),
zoomOff(),
Chartpublic void zoomOff()
Allows you to ignore any zoom attributes set using the Zoom method and return to the default axis view.
Use the zoom(double, double) method to set a zoom for a specified range on a selected axis.
If the Chart.setZoom(boolean) property of the Chart object is configured to False, all Axis specific zooms will be turned off.
Chart.getAxisX(),
Chart.getAxisY(),
Chart.getAxisY2(),
Chart.getAxesX(),
Chart.getAxesY(),
Chart.setZoom(boolean),
zoom(double, double),
Chart
|
http://www.softwarefx.com | |||||||
| PREV CLASS NEXT CLASS | FRAMES NO FRAMES | |||||||
| SUMMARY: NESTED | FIELD | CONSTR | METHOD | DETAIL: FIELD | CONSTR | METHOD | |||||||