 com.softwarefx.chartfx.server.Chart
|
Chart FX 7 for Java Server | |||||||
| PREV CLASS NEXT CLASS | FRAMES NO FRAMES | |||||||
| SUMMARY: NESTED | FIELD | CONSTR | METHOD | DETAIL: FIELD | CONSTR | METHOD | |||||||
java.lang.Object
public class Chart
Provides access to the Chart object. This is the main class of the ChartFX library.
General chart properties are provided to set general attributes in the chart. For example, you may use properties to show or hide tools in the chart window or to apply a specific line style to all lines in a line chart.
The data is passed to the chart using the getData() property. Alternativelly, data binding is also available through the setDataSource(com.softwarefx.chartfx.server.dataproviders.IDataSource) and getDataSourceSettings() properties.
There may be a case in which a general property is also found in a specific object. For example, you may use a general property called setGallery(com.softwarefx.chartfx.server.Gallery) property to change the chart type displayed (for getAllSeries() in the chart), but if you use the Gallery property supported by the SeriesAttributes.setGallery(com.softwarefx.chartfx.server.Gallery)object you will change the chart type for a particular series (thus creating a MultiType chart) instead of all series in the chart. You may even go a step further by assigning properties directly to specific points rather than series using the getPoints()object.
Some properties of the Chart object act as a mechanism for assigning attributes directly to other objects that exist in the chart. Some of these properties include LegendBox, ToolBarItem, getMenuBar(), and getDataGrid(). If you want to assign individual properties to elements in the chart, you may refer to the different objects available.
The chart can be rendered in 3D. The getView3D() property provides access the 3D customization of the chart.
| Field Summary | |
|---|---|
static double |
HIDDEN
|
| Constructor Summary | |
|---|---|
Chart()
|
|
| Method Summary | |
|---|---|
void |
addConditionalAttributesCallbackListener(ConditionalAttributesListener value)
Adds a ConditionalAttributesCallbackListener to the listener list. |
void |
addGetAxisLabelListener(AxisLabelListener value)
Adds a GetAxisLabelListener to the listener list. |
void |
addGetPointLabelListener(PointLabelListener value)
Adds a GetPointLabelListener to the listener list. |
void |
addPaintMarkerListener(PaintMarkerListener value)
Adds a PaintMarkerListener to the listener list. |
void |
addPostPaintListener(CustomPaintListener value)
Adds a PostPaintListener to the listener list. |
void |
addPrePaintListener(CustomPaintListener value)
Adds a PrePaintListener to the listener list. |
void |
addPrePaintMarkerListener(PaintMarkerListener value)
Adds a PrePaintMarkerListener to the listener list. |
static double |
dateToNumber(Calendar date)
Converts a Java Date to Chart FX internal Format. |
static double |
dateToNumber(Date date)
Converts a Java Date to Chart FX internal Format. |
String |
expandMacros(String mask,
             int series,
             int point,
             boolean inPoint)
Returns the mask string for a selected point or line in a chart. |
void |
exportChart(FileFormat format,
            OutputStream stream)
Allows you to export the chart to a data file or stream. |
void |
exportChart(FileFormat format,
            String fileName)
Allows you to export the chart to a data file or stream. |
void |
exportChart(OutputStream stream)
Allows you to export the chart to a data file or stream. |
EnumSet<AllowChanges> |
getAllowChanges()
Gets the AllowChanges. |
GlobalAttributes |
getAllSeries()
Gets the global attributes which are shared across the getSeries() of the chart. |
AxesStyle |
getAxesStyle()
Gets the AxesStyle. |
AxisXCollection |
getAxesX()
Returns the collection of the X axes of the chart. |
AxisYCollection |
getAxesY()
Returns the collection of the Y axes of the chart. |
AxisX |
getAxisX()
Assigns properties specifically to the primary X axis. |
AxisY |
getAxisY()
Assigns properties specifically to the primary Y axis of the chart. |
AxisY |
getAxisY2()
Assigns properties specifically to the secondary Y axis of the chart. |
Color |
getBackColor()
Gets the BackColor. |
IBackgroundAdornment |
getBackground()
Gets the Background. |
IBorderAdornment |
getBorder()
Gets the Border. |
Rectangle |
getChartAreaRectangle()
Gets the rectangle object for the chart area. |
int |
getCodePage()
Gets the CodePage. |
CommandCollection |
getCommands()
Gets the list of commands associated with the chart. |
ConditionalAttributesCollection |
getConditionalAttributes()
Returns the collection of ConditionalAttributes objects. |
ConditionalAttributesListener[] |
getConditionalAttributesCallbackListeners()
Returns an array of all the ConditionalAttributesCallbackListeners added to this class with addConditionalAttributesCallbackListeners(). |
String |
getContentUrl()
Gets the ContentUrl. |
Locale |
getCulture()
Gets the Culture. |
DataValues |
getData()
Allows you to set the Y values. |
DataGrid |
getDataGrid()
Gets the Data Grid of the chart. |
String |
getDataMember()
Gets the DataMember. |
IDataSource |
getDataSource()
Gets the DataSource. |
String |
getDataSourceID()
Gets the DataSourceID. |
DataSourceSettings |
getDataSourceSettings()
Used to assign data related attributes to your chart applications. |
Dimension |
getExportImageSize()
Gets the ExportImageSize. |
ExtensionCollection |
getExtensions()
Collection used to add, clear and assign Chart FX extension objects. |
EnumSet<ChartStyles> |
getExtraStyle()
Gets the ExtraStyle. |
EnumSet<FileContents> |
getFileContents()
Gets the FileContents. |
Font |
getFont()
Gets the Font. |
Color |
getForeColor()
Gets the ForeColor. |
Gallery |
getGallery()
Gets the Gallery. |
IGallery |
getGalleryAttributes()
Gets the GalleryAttributes. |
AxisLabelListener[] |
getGetAxisLabelListeners()
Returns an array of all the GetAxisLabelListeners added to this class with addGetAxisLabelListeners(). |
PointLabelListener[] |
getGetPointLabelListeners()
Returns an array of all the GetPointLabelListeners added to this class with addGetPointLabelListeners(). |
int |
getHeight()
Gets the Height. |
ImageSettings |
getImageSettings()
Gets the image settings. |
LegendBox |
getLegendBox()
Allows you to acces the legend box of the chart. |
Pane |
getMainPane()
Gets the default pane of the chart. |
ToolBar |
getMenuBar()
Allows you to access the menu bar of the chart. |
String |
getMessageText(String key)
Allows you to obtain default Chart FX stings which are displayed in the chart. |
IWriter |
getOutputWriter()
Gets the OutputWriter. |
Color |
getPageColor()
Gets the PageColor. |
PaintMarkerListener[] |
getPaintMarkerListeners()
Returns an array of all the PaintMarkerListeners added to this class with addPaintMarkerListeners(). |
String |
getPalette()
Gets the Palette. |
PaneCollection |
getPanes()
Returns the collection of the defined Paneof the chart. |
PersonalizeAttributes |
getPersonalize()
Allows you to set the preferences for saving and loading personalized charts. |
IBackgroundAdornment |
getPlotAreaBackground()
Gets the PlotAreaBackground. |
Color |
getPlotAreaColor()
Gets the PlotAreaColor. |
Margins |
getPlotAreaMargin()
Gets and Sets the top, bottom, left and right gaps of the chart. |
PointAttributesCollection |
getPoints()
Assigns properties directly to a specific point in the chart. |
CustomPaintListener[] |
getPostPaintListeners()
Returns an array of all the PostPaintListeners added to this class with addPostPaintListeners(). |
CustomPaintListener[] |
getPrePaintListeners()
Returns an array of all the PrePaintListeners added to this class with addPrePaintListeners(). |
PaintMarkerListener[] |
getPrePaintMarkerListeners()
Returns an array of all the PrePaintMarkerListeners added to this class with addPrePaintMarkerListeners(). |
Printer |
getPrinter()
Allows you to set properties of the printer object. |
String |
getProxyUri()
Gets the ProxyUri. |
String |
getRenderFormat()
Gets the RenderFormat. |
SeriesAttributesCollection |
getSeries()
Assigns properties directly to the selected series in the chart. |
EnumSet<FileContents> |
getTemplateContents()
Gets the TemplateContents. |
TitleCollection |
getTitles()
Returns the collection of titles defined in the chart. |
ToolBar |
getToolBar()
Allow to acces the tool bar of the chart. |
String |
getToolTipFormat()
Gets the ToolTipFormat. |
Attributes3D |
getView3D()
Allows you to enable or disable 3D view of the chart. |
int |
getWidth()
Gets the Width. |
void |
importChart(FileFormat format,
            InputStream stream)
Allows you to import a chart from a file or stream. |
void |
importChart(FileFormat format,
            String fileName)
Allows you to import a chart from a file or stream. |
void |
importChart(InputStream stream)
Allows you to import a chart from a file or stream. |
boolean |
isAllowDrag()
Gets the AllowDrag. |
boolean |
isAntialiasing()
Gets the Antialiasing. |
boolean |
isContextMenus()
Gets the ContextMenus. |
boolean |
isCrosshairs()
Gets the Crosshairs. |
boolean |
isDirty()
Error: Member Chart.isDirty member not found |
boolean |
isEmbeddedData()
Gets the EmbeddedData. |
boolean |
isToolTips()
Gets the ToolTips. |
boolean |
isUseCallbacksForEvents()
Gets the UseCallbacksForEvents. |
boolean |
isUseClientLoader()
Gets the UseClientLoader. |
boolean |
isVisible()
Gets the Visible. |
boolean |
isZoom()
Gets the Zoom. |
Point |
markerToPixel(int series,
              int point)
Returns a point storing the position in pixel of a specified chart marker. |
void |
paint(Graphics2D g,
      Rectangle r,
      EnumSet<PaintStyles> paintFlags)
Allows you to paint the chart in a given device context. |
void |
recalculateScale()
Resets and recalculates all scale values. |
void |
removeConditionalAttributesCallbackListener(ConditionalAttributesListener value)
Removes a ConditionalAttributesCallbackListener from the listener list. |
void |
removeGetAxisLabelListener(AxisLabelListener value)
Removes a GetAxisLabelListener from the listener list. |
void |
removeGetPointLabelListener(PointLabelListener value)
Removes a GetPointLabelListener from the listener list. |
void |
removePaintMarkerListener(PaintMarkerListener value)
Removes a PaintMarkerListener from the listener list. |
void |
removePostPaintListener(CustomPaintListener value)
Removes a PostPaintListener from the listener list. |
void |
removePrePaintListener(CustomPaintListener value)
Removes a PrePaintListener from the listener list. |
void |
removePrePaintMarkerListener(PaintMarkerListener value)
Removes a PrePaintMarkerListener from the listener list. |
void |
renderControl()
Renders the chart directly to the browser response context. |
void |
renderToStream()
Used to bit-stream a chart directly to the browser or retrieve the chart image, image map and html tag in one call. |
void |
renderToStream(OutputStream content,
               Writer imgMap,
               Writer htmlTag)
Used to bit-stream a chart directly to the browser or retrieve the chart image, image map and html tag in one call. |
void |
reset()
Resets the chart to its orgininal state. |
void |
setAllowChanges(EnumSet<AllowChanges> value)
Enables or prevents the end user from altering data. |
void |
setAllowDrag(boolean value)
Enables or prevents the end user from dragging a marker with the mouse to change its value. |
void |
setAntialiasing(boolean value)
Gives a smooth visual effect to the chart. |
void |
setAxesStyle(AxesStyle value)
Used to change the style of the axes. |
void |
setBackColor(Color value)
Sets the background color of the chart. |
void |
setBackground(IBackgroundAdornment value)
Allows you to assign a gradient to the background of a chart. |
void |
setBorder(IBorderAdornment value)
Sets a default or image border to the chart. |
void |
setCodePage(int value)
Sets the CodePage for a chart. |
static void |
setConfigPath(String path)
Error: D:\Dev\CfxJava70\JavaDoc\docsource\\Objects\Chart\setConfigPath.xml |
void |
setContentUrl(String value)
Sets string which contains the URL for the content page when the user wants the chart data rendered to stream. |
void |
setContextMenus(boolean value)
Allows you to enable or disable context sensitive menus when the user right clicks a particular chart element. |
void |
setCrosshairs(boolean value)
Enables or Disables the cross-hairs marker in the chart. |
void |
setCulture(Locale value)
Allows you to localize charts for a specific language and region. |
void |
setDataMember(String value)
Sets the data mamber for the chart. |
void |
setDataSource(IDataSource value)
Sets the source containing the values used to populate the chart. |
void |
setDataSourceID(String value)
Sets the ID of the data source control the chart should use to retrieve its data source. |
void |
setDirty(boolean value)
Returns a boolean specifying if the chart has been modified by the user. |
void |
setEmbeddedData(boolean value)
Sets a value specifying if chart data will be embedded in the resulting html. |
void |
setExportImageSize(Dimension value)
Sets the image dimensions for exported chart images. |
void |
setExtraStyle(EnumSet<ChartStyles> value)
Allows you to set additional visual attributes in the chart. |
void |
setFileContents(EnumSet<FileContents> value)
Sets the attributes to save in chart files (Export method). |
void |
setFont(Font value)
Sets the font type which will be used by default in the chart. |
void |
setForeColor(Color value)
Sets the default font color of the chart. |
void |
setGallery(Gallery value)
Sets the gallery type for the whole chart. |
void |
setGalleryAttributes(IGallery value)
Used to create a gallery object to assign additional attributes to the selected setGallery(com.softwarefx.chartfx.server.Gallery) of the chart. |
void |
setHeight(int value)
Specifies the suggested height of the chart when generating images. |
static void |
setLicenseString(String licenseString)
Error: Member Chart.LicenseString member not found |
void |
setMessageText(String key,
               String message)
Allows you to customize default Chart FX strings which are displayed in the chart. |
void |
setOutputWriter(IWriter value)
Allows you to select a specific external output writer for generating chart images. |
void |
setPageColor(Color value)
Allows you to specify a form background color needed to fill areas around image border shadowing. |
void |
setPalette(String value)
Allows you to set a pre-defined palette. |
void |
setPlotAreaBackground(IBackgroundAdornment value)
Allows you to assign a gradient to the inside area of a chart. |
void |
setPlotAreaColor(Color value)
Gets and Sets the color of the PlotAreaBackground. |
void |
setProxyUri(String value)
Used to add the Proxy URI of a proxy server. |
void |
setRenderFormat(String value)
Sets the chart format to generate. |
void |
setTemplateContents(EnumSet<FileContents> value)
Sets the attributes to save in personalization features and template files (Export method). |
void |
setToolTipFormat(String value)
Allows you to control the information to be displayed in the tooltip when the user positions the mouse over a particular data point in the chart. |
void |
setToolTips(boolean value)
Allows you to enable or disable tooltips when the user positions the mouse over a particular element in the chart area only. |
void |
setUseCallbacksForEvents(boolean value)
Allows you to use CallBacks scripts when events are fired. |
void |
setUseClientLoader(boolean value)
Sets a value indicating whether to generate an object with a small "wrapper" control for faster downloads when generating .NET Client Controls. |
void |
setVisible(boolean value)
Sets a value specifying to show or hide the chart. |
void |
setWidth(int value)
Specifies the suggested width of the chart when generating images. |
void |
setZoom(boolean value)
Allows you to select a section of the chart using the mouse cursor and zoom in that area. |
void |
updateSizeNow()
Allows you to force a scale calculation before the chart is drawn. |
void |
zoomToPercentage(int percentage)
Zooms the chart to center based on configured percentage value. |
void |
zoomToWindow(int x1,
             int y1,
             int x2,
             int y2)
Zooms the chart to a rectangular area based on specified x and y coordinates for the rectangle |
| Methods inherited from class java.lang.Object |
|---|
equals, getClass, hashCode, notify, notifyAll, toString, wait, wait, wait |
| Field Detail |
|---|
public static final double HIDDEN
| Constructor Detail |
|---|
public Chart()
| Method Detail |
|---|
public void addConditionalAttributesCallbackListener(ConditionalAttributesListener value)
Adds a ConditionalAttributesCallbackListener to the listener list.
value - The ConditionalAttributesCallbackListener to be added.public void addGetAxisLabelListener(AxisLabelListener value)
Adds a GetAxisLabelListener to the listener list.
value - The GetAxisLabelListener to be added.public void addGetPointLabelListener(PointLabelListener value)
Adds a GetPointLabelListener to the listener list.
value - The GetPointLabelListener to be added.public void addPaintMarkerListener(PaintMarkerListener value)
Adds a PaintMarkerListener to the listener list.
value - The PaintMarkerListener to be added.public void addPostPaintListener(CustomPaintListener value)
Adds a PostPaintListener to the listener list.
value - The PostPaintListener to be added.public void addPrePaintListener(CustomPaintListener value)
Adds a PrePaintListener to the listener list.
value - The PrePaintListener to be added.public void addPrePaintMarkerListener(PaintMarkerListener value)
Adds a PrePaintMarkerListener to the listener list.
value - The PrePaintMarkerListener to be added.public static double dateToNumber(Calendar date)
Converts a Java Date to Chart FX internal Format.
When loading XValues which are dates to a Chart, they must be converted to an internal format for Chart FX to properly handle labeling and scaling.
date - Date to convertChartpublic static double dateToNumber(Date date)
Converts a Java Date to Chart FX internal Format.
When loading XValues which are dates to a Chart, they must be converted to an internal format for Chart FX to properly handle labeling and scaling.
date - Date to convertChart
public String expandMacros(String mask,
                           int series,
                           int point,
                           boolean inPoint)
Returns the mask string for a selected point or line in a chart.
This method is useful when you would like to return the configured mask string for a selected point label.
You may set the mask string for a selected chart element using the PointLabelAttributes.setFormat(java.lang.String) property of the PointLabelAttributes
Class
, or the setToolTipFormat(java.lang.String) property.
mask - Speicifies the mask string. (May be null value.)series - Specifies the Series.point - Specifies the Point.inPoint - Specifies to return the mask of the Point or the line between the Points.PointLabelAttributes.setFormat(java.lang.String),
setToolTipFormat(java.lang.String)public void exportChart(OutputStream stream)
Allows you to export the chart to a data file or stream.
When saving to a Binary or XML file, you may select which chart settings to save by using the FileMask property. The BinaryTemplate type is preset to save using the TemplateMask enumeration property.
stream - A stream where to store the exported chart.setFileContents(java.util.EnumSet) ,
setTemplateContents(java.util.EnumSet) ,
importChart(java.io.InputStream)
public void exportChart(FileFormat format,
                        OutputStream stream)
Allows you to export the chart to a data file or stream.
When saving to a Binary or XML file, you may select which chart settings to save by using the FileMask property. The BinaryTemplate type is preset to save using the TemplateMask enumeration property.
format - The available formats the export can handle.stream - A stream where to store the exported chart.setFileContents(java.util.EnumSet) ,
setTemplateContents(java.util.EnumSet) ,
importChart(java.io.InputStream)
public void exportChart(FileFormat format,
                        String fileName)
Allows you to export the chart to a data file or stream.
When saving to a Binary or XML file, you may select which chart settings to save by using the FileMask property. The BinaryTemplate type is preset to save using the TemplateMask enumeration property.
format - The available formats the export can handle.fileName - The location of the file where to export the chart.setFileContents(java.util.EnumSet) ,
setTemplateContents(java.util.EnumSet) ,
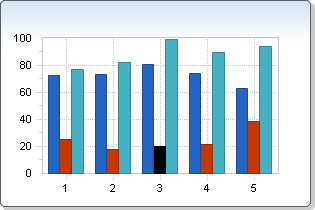
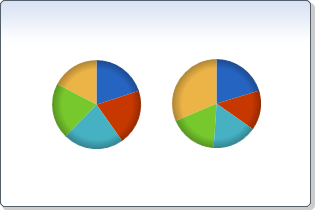
importChart(java.io.InputStream)public GlobalAttributes getAllSeries()
Gets the global attributes which are shared across the getSeries() of the chart.
For performance reason, the series and the points related to the series share the same visual attributes. Those visual attributes are stored in the GlobalAttributes
Class
. Therefore, to set a attribute common to all the points of the chart, AllSeries should be used. If the user wants to change a visual attribute for a particular series, getSeries() should be used. Similarly, if the user wants to change a visual attribute for a particular point, getPoints() should be used.
Below, the galleries of all the series have been changed to Pies:

getSeries(),
getPoints(),
SeriesAttributes,
PointAttributespublic EnumSet<AllowChanges> getAllowChanges()
Gets the AllowChanges. For more detail see setAllowChanges(java.util.EnumSet.
public AxesStyle getAxesStyle()
Gets the AxesStyle. For more detail see setAxesStyle(com.softwarefx.chartfx.server.AxesStyle).
public AxisXCollection getAxesX()
Returns the collection of the X axes of the chart.
The first element of the collection is the getAxisX() of the chart.
getAxesY(),
getAxisX(),
AxisX,
Axispublic AxisYCollection getAxesY()
Returns the collection of the Y axes of the chart.
The first element of the collection is the getAxisY() of the chart. Similarly, the second element of the collection is the getAxisY2() of the chart.
getAxesX(),
getAxisY(),
getAxisY2(),
Axis,
AxisYpublic AxisX getAxisX()
Assigns properties specifically to the primary X axis.
Below, the primary X axis of the chart is hidden.
getAxesY(),
getAxisY(),
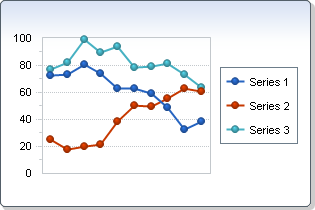
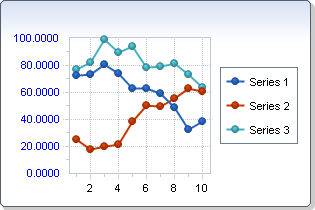
getAxisY2()public AxisY getAxisY()
Assigns properties specifically to the primary Y axis of the chart.
Below, the labels of the primary Y axis are set to blue and are formatted to use 4 decimals.
getAxisY2(),
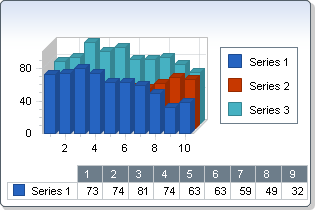
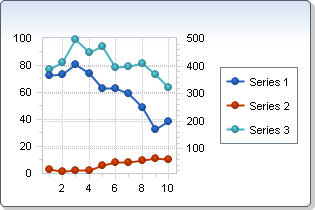
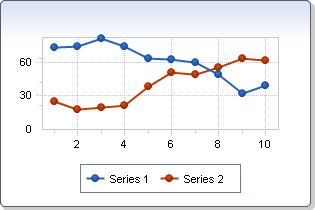
getAxesY()public AxisY getAxisY2()
Assigns properties specifically to the secondary Y axis of the chart.
By default, the secondary Y axis is not visible. This axis needs to be associated to a series in order to be rendered by the chart.
Below, the second series of the chart is associated to the secondary Y axis.
getAxesY(),
getAxisY()public Color getBackColor()
Gets the BackColor. For more detail see setBackColor(java.awt.Color).
public IBackgroundAdornment getBackground()
Gets the Background. For more detail see setBackground(com.softwarefx.chartfx.server.adornments.IBackgroundAdornment).
public IBorderAdornment getBorder()
Gets the Border. For more detail see setBorder(com.softwarefx.chartfx.server.adornments.IBorderAdornment).
public Rectangle getChartAreaRectangle()
Gets the rectangle object for the chart area.
This member returns a Rectangle object. Please see your development environment help refernece for additional information regarding supported members.
public int getCodePage()
Gets the CodePage. For more detail see setCodePage(int).
public CommandCollection getCommands()
Gets the list of commands associated with the chart.
This property is accessed when you want to customize the getToolBar()/getMenuBar()
or change any option associated with the default ToolBar/MenuBar.
For more information on how to customize the ToolBar/MenuBar,
please refer to the Programmer's Guide or Resource Center.
When customizing the Chart's ToolBar/MenuBar, you may reference the pre-defined commands. To do so, you will access the CommandID enumeration.
getMenuBar(),
getToolBar(),
Command,
ToolBarpublic ConditionalAttributesCollection getConditionalAttributes()
Returns the collection of ConditionalAttributes objects.
This property exposes the members of the Condition and ConditionalAttributes classes. Please see the Condition and ConditionalAttributesclasses for additional information regarding those supported members.
Condition,
ConditionalAttributespublic ConditionalAttributesListener[] getConditionalAttributesCallbackListeners()
Returns an array of all the ConditionalAttributesCallbackListeners added to this class with addConditionalAttributesCallbackListeners().
public String getContentUrl()
Gets the ContentUrl. For more detail see setContentUrl(java.lang.String).
public Locale getCulture()
Gets the Culture. For more detail see setCulture(java.util.Locale).
public DataValues getData()
Allows you to set the Y values. Alternativelly, the Y values can be access through the DataValues.getY() property of the DataValues
Class
.
Once the chart has been populated using Value property, the getDataGrid() object allows users to view point values at runtime.
Please note that instead of the Y value associated with the point, you can assign a hidden constant will cause the point to be hidden in the chart. Although a hidden point is physically in the data array, when you use this constant the marker will not appear in the chart, and if you have charts like a line or area chart, the line will break at that particular point.
DataValues.getX(),
DataValues.getY(),
DataValues.getYFrom(),
getData(),
recalculateScale(),
DataValuespublic DataGrid getDataGrid()
Gets the Data Grid of the chart. The Data Gird is a spreadsheet that shows the data points in tabular format. When shown, it allows the user to see both the chart and the grid at the same time.
Below, the DataGrid is visible:
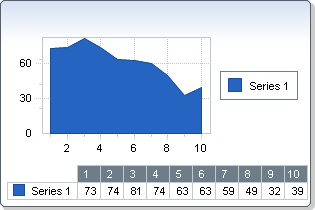
DockableBar.setVisible(boolean)public String getDataMember()
Gets the DataMember. For more detail see setDataMember(java.lang.String).
public IDataSource getDataSource()
Gets the DataSource. For more detail see setDataSource(com.softwarefx.chartfx.server.dataproviders.IDataSource).
public String getDataSourceID()
Gets the DataSourceID. For more detail see setDataSourceID(java.lang.String).
public DataSourceSettings getDataSourceSettings()
Used to assign data related attributes to your chart applications.
You can use the DataSourceSettings.setDataSource(com.softwarefx.chartfx.server.dataproviders.IDataSource) property to define where the chart datasource when passing data from database, text files or arrays.
DataSourceSettings.setDataSource(com.softwarefx.chartfx.server.dataproviders.IDataSource),
DataSourceSettings.setDataSource(com.softwarefx.chartfx.server.dataproviders.IDataSource)public Dimension getExportImageSize()
Gets the ExportImageSize. For more detail see setExportImageSize(java.awt.Dimension).
public ExtensionCollection getExtensions()
Collection used to add, clear and assign Chart FX extension objects.
Chart FX has been designed with extensibility in mind. Using this property, additional functionality can be added to the component such as the Annotation, Maps or Statistical Extensions. For more information about the available Chart FX Extensions, please visit our website at:
http://www.softwarefx.com/SFXJavaProducts/CFXforJava/
public EnumSet<ChartStyles> getExtraStyle()
Gets the ExtraStyle. For more detail see setExtraStyle(java.util.EnumSet.
public EnumSet<FileContents> getFileContents()
Gets the FileContents. For more detail see setFileContents(java.util.EnumSet.
public Font getFont()
Gets the Font. For more detail see setFont(java.awt.Font).
public Color getForeColor()
Gets the ForeColor. For more detail see setForeColor(java.awt.Color).
public Gallery getGallery()
Gets the Gallery. For more detail see setGallery(com.softwarefx.chartfx.server.Gallery).
public IGallery getGalleryAttributes()
Gets the GalleryAttributes. For more detail see setGalleryAttributes(com.softwarefx.chartfx.server.IGallery).
public AxisLabelListener[] getGetAxisLabelListeners()
Returns an array of all the GetAxisLabelListeners added to this class with addGetAxisLabelListeners().
public PointLabelListener[] getGetPointLabelListeners()
Returns an array of all the GetPointLabelListeners added to this class with addGetPointLabelListeners().
public int getHeight()
Gets the Height. For more detail see setHeight(int).
public ImageSettings getImageSettings()
Gets the image settings. This allows you to configure how the chart is render on the client.
By default, Chart FX will generate an interactive image file. This is accomplished through DHTML and client side JavaScript. The most impressive advanatge to this format is it requires to client side components to be downloaded (no client footprint).
The ImageSettings property is used to obtain an ImageSettings object. This object may be used to configure the attributes for images when the selected rendering format. Please see the ImageSettings Class for additional information regarding supported members.
The renderControl() method is used to render charts directly to the browser response context. You may also use the setRenderFormat(java.lang.String) property to configure the desired chart format.
setRenderFormat(java.lang.String),
renderControl(),
ImageSettingspublic LegendBox getLegendBox()
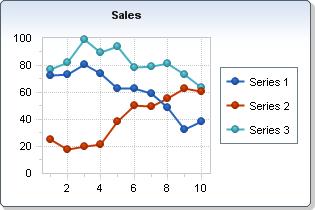
Allows you to acces the legend box of the chart.
The values legend box is used to display legends associated with data points and is used to improve the chart's readability in charts like Pie, Doughnut and Pyramid where there's no axis, but point labels are still necessary in the chart.
Below, the legend box is render at the bottom of the chart:
(LegendBox)public Pane getMainPane()
Gets the default pane of the chart.
Below, the back color of the main pane is set to blue:
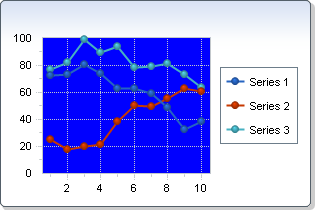
The default pane can also be accessed through the getAllSeries() property.
GlobalAttributes.setPane(com.softwarefx.chartfx.server.Pane),
getAllSeries(),
SeriesAttributes.setPane(com.softwarefx.chartfx.server.Pane),
setPlotAreaColor(java.awt.Color),
setPlotAreaBackground(com.softwarefx.chartfx.server.adornments.IBackgroundAdornment),
GlobalAttributes,
SeriesAttributespublic ToolBar getMenuBar()
Allows you to access the menu bar of the chart. Alternativelly, you can access the tool bar of the chart using getToolBar().
You can configure the commands available through the menu bar using the getCommands() property.
Although the chart is displayed in a bounding rectangle, Chart FX for Java is capable of displaying a menu bar as part of the chart.
Below, the menu bar of the chart is made visible:
getLegendBox(),
getDataGrid(),
setContextMenus(boolean),
getCommands(),
LegendBox,
DataGrid,
DockableBar,
Commandpublic String getMessageText(String key)
Allows you to obtain default Chart FX stings which are displayed in the chart.
The key parameter is case sensitive, therefore you must use the exact pre-defined key value string.
You can use the Culture property to fully localize your charts. Elements that can be modified include the names of the culture, the writing system, and the calendar used, as well as formatting dates and strings.
The ValueFormat.setCulture(java.util.Locale) property of the ValueFormat
Class
allow you to assign culture specific formatting to labels and numbers for a selected axis.
Pre-defined message identifiers with the defualt values for each key (key=value):
NoData=No Data Available
LicDownloading=Downloading License ...
DataDownloading=Downloading Chart ...
DataFailed=Failed to download Chart\n{0}
Mask.Percentage=%s\n%l\n%v out of %t\n(%p%%)
Mask.OHLC=%l\nOpen: %v2\nHigh: %v4 - Low: %v1\nClose: %v3
Mask.HLC=%l\nHigh: %v3 - Low: %v1\nClose %v2
Mask.Ini=%s\n%l\nFrom %i to\n%v
Mask.XY=%s\n%l\nX: %x, Y: %v
Mask.Between=%s\n%l - %l\n%v - %v
Mask.Default=%s\n%l\n%v
LegMask.Series=Series #{0}
LegMask.Values=Value #{0}
CFX61B0=A temporary file on {0} could not be created
XAxis=X Axis
YAxis=Y Axis
General=General
Series=Series
Chart=Chart Area
Draw=Drawing Area
AllSeries=All Series
Auto=Auto
None=None
Raised=Raised
Light=Light
Dark=Dark
Opposite=Opposite
Shadow=Shadow
Number=Number
Currency=Currency
Scientific=Scientific
Percentage=Percentage
Date=Short Date
LongDate=Long Date
Time=Time
DateTime=Date-Time
Label0=Horizontal
Label1=Vertical
Label2=45 Degrees
Inside=Inside
Outside=Outside
Cross=Across
ExportFilter=ChartFX File (*.cfx)|*.cfx|Text File (data only)|*.txt|XML File (properties only)|*.xml|Bitmap Image (*.bmp)|*.bmp|Metafile Picture (*.emf)|*.emf
ImportFilter=ChartFX Files (*.cfx)|*.cfx|Text Files (data only)|*.txt|XML Files(properties only)|*.xml
NoPermission=The application does not have enough permissions to execute this operation.
key - Pre-defined message identifier.public IWriter getOutputWriter()
Gets the OutputWriter. For more detail see setOutputWriter(com.softwarefx.chartfx.server.writer.IWriter).
public Color getPageColor()
Gets the PageColor. For more detail see setPageColor(java.awt.Color).
public PaintMarkerListener[] getPaintMarkerListeners()
Returns an array of all the PaintMarkerListeners added to this class with addPaintMarkerListeners().
public String getPalette()
Gets the Palette. For more detail see setPalette(java.lang.String).
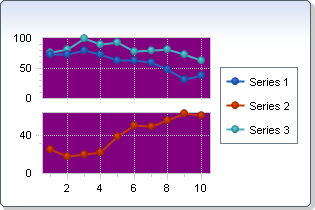
public PaneCollection getPanes()
Returns the collection of the defined Paneof the chart.
The Main Pane of the chart is the first indexed pane of the collection.
The getMainPane() of the chart is the first indexed pane of the collection.
Below, the first series of the chart is associated to the main pane. However, the second and third series are associated to a second pane:
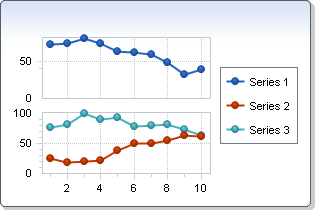
getMainPane(),
Panepublic PersonalizeAttributes getPersonalize()
Allows you to set the preferences for saving and loading personalized charts.
Many users require and demand information on an individual basis. Using personalized charts allows users to change visual attributes and have those settings saved locally. When the user accesses the chart in the future, the saved settings can be automatically loaded so the user can view a chart configured to their personal preference.
exportChart(java.io.OutputStream),
importChart(java.io.InputStream)public IBackgroundAdornment getPlotAreaBackground()
Gets the PlotAreaBackground. For more detail see setPlotAreaBackground(com.softwarefx.chartfx.server.adornments.IBackgroundAdornment).
public Color getPlotAreaColor()
Gets the PlotAreaColor. For more detail see setPlotAreaColor(java.awt.Color).
public Margins getPlotAreaMargin()
Gets and Sets the top, bottom, left and right gaps of the chart.
A gap is defined as the margin between the chart and the bounding rectangle in pixels. Each chart has a top, bottom, left and right gaps.
The lowest value for the each gap is 1, which sets it to one pixel. Setting a gap to 0 will reset it to default values.
Below, the bottom gap of the chart is set to 100 pixels. The other gaps are set to 0:
public PointAttributesCollection getPoints()
Assigns properties directly to a specific point in the chart.
Allows you to assign supported properties directly to the specified data point. For supported properties, please see the SeriesAttributesPointAttributes
Class
.
Below, the third point of the second series is changed to black:
If you want to change the markers and the labels for all the points of the same series, please refer to the getSeries() property.
PointAttributes.setAlternateColor(java.awt.Color),
PointAttributes.getBorder(),
PointAttributes.setColor(java.awt.Color),
PointAttributes.setMarkerShape(com.softwarefx.chartfx.server.MarkerShape),
PointAttributes.setPicture(java.awt.Image),
PointAttributes.getPointLabels(),
PointAttributes.setSeparateSlice(short),
PointAttributes,
PointLabelAttributespublic CustomPaintListener[] getPostPaintListeners()
Returns an array of all the PostPaintListeners added to this class with addPostPaintListeners().
public CustomPaintListener[] getPrePaintListeners()
Returns an array of all the PrePaintListeners added to this class with addPrePaintListeners().
public PaintMarkerListener[] getPrePaintMarkerListeners()
Returns an array of all the PrePaintMarkerListeners added to this class with addPrePaintMarkerListeners().
public Printer getPrinter()
Allows you to set properties of the printer object.
The Printer value of the ChartStyles enumeration (which can be access by the setExtraStyle(java.util.EnumSet property) ables/disables the UI which allow the end-user to print a chart.
The Printer property provides the mechanism for assigning important properties to print the chart. You can modify the margins, paper orientation, color or pattern printing, among others. Please refer to the Printer Class for supported properties.
The Printer Class supports a Print, PrintDialog, PrintPreview, and PageSetup methods which are only supported in desktop application development. Please see the Printer Class for all supported members.
Printer.setCompress(boolean),
Printer.setForceColors(boolean),
Printer.setMargins(java.awt.Insets),
Printer.setOrientation(com.softwarefx.chartfx.server.PageOrientation),
Printer.setUsePrinterResolution(boolean)public String getProxyUri()
Gets the ProxyUri. For more detail see setProxyUri(java.lang.String).
public String getRenderFormat()
Gets the RenderFormat. For more detail see setRenderFormat(java.lang.String).
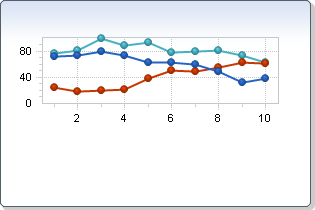
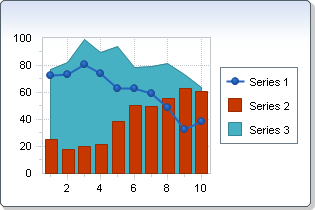
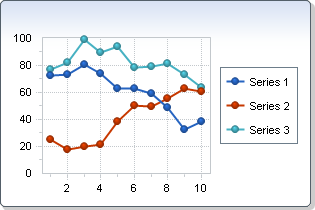
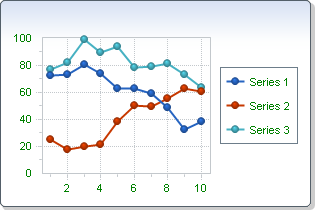
public SeriesAttributesCollection getSeries()
Assigns properties directly to the selected series in the chart.
Allows you to assign supported properties directly to the specified data series. For supported properties, please see the SeriesAttributes
Class
.
getAllSeries() allows to set properties common to all the Series or/and getPoints() of the chart.
The Series property allows you to create charts with mixed SeriesAttributes.setGallery(com.softwarefx.chartfx.server.Gallery) types and assign specific colors to each series.
Below is an example of a multi-gallery chart:
SeriesAttributes.setColor(java.awt.Color),
GlobalAttributes.setGallery(com.softwarefx.chartfx.server.Gallery),
SeriesAttributes.setGallery(com.softwarefx.chartfx.server.Gallery),
getAllSeries(),
getPoints(),
SeriesAttributes,
PointAttributes,
GlobalAttributespublic EnumSet<FileContents> getTemplateContents()
Gets the TemplateContents. For more detail see setTemplateContents(java.util.EnumSet.
public TitleCollection getTitles()
Returns the collection of titles defined in the chart.
Using the numerical index, you can access multiple items of this collection.
The Title.setTextColor(java.awt.Color) property may be used to get or set the color of the title text; the setFont(java.awt.Font) Property can be used to configure a new font object for the title.
Below, a title in bold has been added in the chart:
Axis.setTitle(com.softwarefx.chartfx.server.Title),
Title.setTextColor(java.awt.Color),
Title.setFont(java.awt.Font),
Axis,
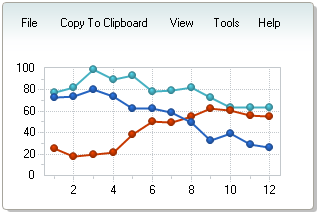
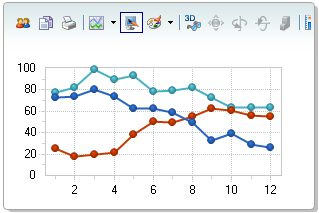
Titlepublic ToolBar getToolBar()
Allow to acces the tool bar of the chart. Alternativelly, you can access the tool bar of the chart using getMenuBar().
You can configure the commands available through the menu bar using the getCommands() property.
If you want to customize the toolbar, you will need to use properties supported by the ToolBar
Class
.
Below is a chart with the ToolBar enabled:
getMenuBar(),
getDataGrid(),
getLegendBox(),
getCommands(),
ToolBar,
DataGrid,
LegendBox,
DockableBar,
Commandpublic String getToolTipFormat()
Gets the ToolTipFormat. For more detail see setToolTipFormat(java.lang.String).
public Attributes3D getView3D()
Allows you to enable or disable 3D view of the chart. Also permits to customize the 3D view.
When this property is set to True, you can apply a rotation angle or perspective with the AngleX, AngleY and Perspective parameters of the View3D object.
When this property is set to True, you can apply a rotation angle or perspective with the Attributes3D.setAngleX(int), Attributes3D.setAngleY(int) and Attributes3D.setPerspective(int) properties of the Attributes3D
Class
.
Below is a chart where the 3D view is enabled:
public int getWidth()
Gets the Width. For more detail see setWidth(int).
public void importChart(InputStream stream)
Allows you to import a chart from a file or stream.
If an error is encountered, an exception will be thrown. Your Java API may allow you to catch this exception and add your own custom error messages. For more information regarding your own custom error messages, please refer to the Java API .
stream - A stream where to import the exported chart.setFileContents(java.util.EnumSet) ,
exportChart(java.io.OutputStream)
public void importChart(FileFormat format,
                        InputStream stream)
Allows you to import a chart from a file or stream.
If an error is encountered, an exception will be thrown. Your Java API may allow you to catch this exception and add your own custom error messages. For more information regarding your own custom error messages, please refer to the Java API .
format - The available formats the export can handle.stream - A stream where to import the exported chart.setFileContents(java.util.EnumSet) ,
exportChart(java.io.OutputStream)
public void importChart(FileFormat format,
                        String fileName)
Allows you to import a chart from a file or stream.
If an error is encountered, an exception will be thrown. Your Java API may allow you to catch this exception and add your own custom error messages. For more information regarding your own custom error messages, please refer to the Java API .
format - The available formats the export can handle.fileName - The location of the file where to import the chart.setFileContents(java.util.EnumSet) ,
exportChart(java.io.OutputStream)public boolean isAllowDrag()
Gets the AllowDrag. For more detail see setAllowDrag(boolean).
public boolean isAntialiasing()
Gets the Antialiasing. For more detail see setAntialiasing(boolean).
public boolean isContextMenus()
Gets the ContextMenus. For more detail see setContextMenus(boolean).
public boolean isCrosshairs()
Gets the Crosshairs. For more detail see setCrosshairs(boolean).
public boolean isDirty()
Error: Member Chart.isDirty member not found
ERROR: Doc member not found
public boolean isEmbeddedData()
Gets the EmbeddedData. For more detail see setEmbeddedData(boolean).
public boolean isToolTips()
Gets the ToolTips. For more detail see setToolTips(boolean).
public boolean isUseCallbacksForEvents()
Gets the UseCallbacksForEvents. For more detail see setUseCallbacksForEvents(boolean).
public boolean isUseClientLoader()
Gets the UseClientLoader. For more detail see setUseClientLoader(boolean).
public boolean isVisible()
Gets the Visible. For more detail see setVisible(boolean).
public boolean isZoom()
Gets the Zoom. For more detail see setZoom(boolean).
public Point markerToPixel(int series,
                           int point)
Returns a point storing the position in pixel of a specified chart marker.
Note that the x,y are in chart coordinates, where 0,0 is the top-left corner of the chart area.
When this method is applied to a bar chart, the point object is from the top center of the select bar.
This method may be used in conjunction with annotation objects. You may position annotation objects with chart markers very easily by extracting the X and Y values from the returned point object.
series - An integer specifying the series.point - An integer specifying the point.
public void paint(Graphics2D g,
                  Rectangle r,
                  EnumSet<PaintStyles> paintFlags)
Allows you to paint the chart in a given device context.
This function is very useful when you want to print charts and others objects in the same page or more than one chart in a page.
If you want to print the chart in full page mode, please refer to the Printer
Class
.
g - Indicates the Graphics object used to paint.r - Rectangle to be painted.paintFlags - The style used to paint the area.Printerpublic void recalculateScale()
Resets and recalculates all scale values.
This method should be invoked to force Chart FX to calculate the Min, Max and Step for the axes.
Please keep in mind that this method reads the entire data array, so abusing this method could affect the performance of your application, as Chart FX will read the entire data array every time this method is called.
This method will not affect the Axis.setStep(double) and Axis.setMinorStep(double) if they have been previously set. To make sure they respond to this method make sure the Step and MinorStep properties are set to zero (0).
A typical case of when to use this method is when you disable the Axis.setAutoScale(boolean) property to calculate your Axis.setMin(double) and Axis.setMax(double) and you set new data to the chart that causes the scale values to be recalculated to show the appropriate data.
When using a GlobalAttributes.setStacked(com.softwarefx.chartfx.server.Stacked) style chart, recalculating the scale will sometimes make the chart more readable.
Axis.setMin(double),
Axis.setMax(double),
Axis.setStep(double),
Axis.setMinorStep(double),
Axis.setAutoScale(boolean),
GlobalAttributes.setStacked(com.softwarefx.chartfx.server.Stacked),
Axispublic void removeConditionalAttributesCallbackListener(ConditionalAttributesListener value)
Removes a ConditionalAttributesCallbackListener from the listener list.
value - The ConditionalAttributesCallbackListener to be removed.public void removeGetAxisLabelListener(AxisLabelListener value)
Removes a GetAxisLabelListener from the listener list.
value - The GetAxisLabelListener to be removed.public void removeGetPointLabelListener(PointLabelListener value)
Removes a GetPointLabelListener from the listener list.
value - The GetPointLabelListener to be removed.public void removePaintMarkerListener(PaintMarkerListener value)
Removes a PaintMarkerListener from the listener list.
value - The PaintMarkerListener to be removed.public void removePostPaintListener(CustomPaintListener value)
Removes a PostPaintListener from the listener list.
value - The PostPaintListener to be removed.public void removePrePaintListener(CustomPaintListener value)
Removes a PrePaintListener from the listener list.
value - The PrePaintListener to be removed.public void removePrePaintMarkerListener(PaintMarkerListener value)
Removes a PrePaintMarkerListener from the listener list.
value - The PrePaintMarkerListener to be removed.public void renderControl()
Renders the chart directly to the browser response context.
Generates a chart and embeds the required object tag or image and image map tags to the resulting html output for chart display.
One of the RenderControl greatest advantages is that charts can be easily integrated into your existing scripts and it allows support for automatic browser detection. However, saving a file to disk can have its toll on server performance.
When this method is called, a chart file is generated and saved in a temporary folder. A tag is automatically passed to the browser's response context for the chart to be displayed.
The setRenderFormat(java.lang.String) property may be used to specify the format of the chart to create.
The renderToStream() method may be used to bit-stream a chart directly to the browser or retrieve the chart image, image map and html tag in one call.
setRenderFormat(java.lang.String),
renderToStream()public void renderToStream()
Used to bit-stream a chart directly to the browser or retrieve the chart image, image map and html tag in one call.
The RenderToStream method is used to bit-stream a chart directly to the browser. This avoids the generation of temporary files.
One limitation of this method of chart rendering is the lack of image maps, and by not providing image maps, drilldown and tooltip features are not available as well.
Using the 3 parameter overload of this method, developers can obtain the image maps, image tag and the image itself, providning them full control of the handling of the Chart output.
The setRenderFormat(java.lang.String) property is used to control what type of chart format to generate when usnig the RenderToStream method.
setRenderFormat(java.lang.String),
setRenderFormat(java.lang.String)
public void renderToStream(OutputStream content,
                           Writer imgMap,
                           Writer htmlTag)
Used to bit-stream a chart directly to the browser or retrieve the chart image, image map and html tag in one call.
The RenderToStream method is used to bit-stream a chart directly to the browser. This avoids the generation of temporary files.
One limitation of this method of chart rendering is the lack of image maps, and by not providing image maps, drilldown and tooltip features are not available as well.
Using the 3 parameter overload of this method, developers can obtain the image maps, image tag and the image itself, providning them full control of the handling of the Chart output.
The setRenderFormat(java.lang.String) property is used to control what type of chart format to generate when usnig the RenderToStream method.
content - Stream that contains the image data.imgMap - TextWriter that contains the image map information.htmlTag - TextWriter that contains the Html tag information.setRenderFormat(java.lang.String),
setRenderFormat(java.lang.String)public void reset()
Resets the chart to its orgininal state.
Below is the chart before Reset is called:

When Reset is called, all the custom visual attributes as well as the getData() are cleared.
DataValuespublic void setAllowChanges(EnumSet<AllowChanges> value)
Enables or prevents the end user from altering data.
Use this property if you don't want the end user to change the existing data by using the DataGrid. Although the DataGrid may be visible, it will not allow the user to double click a cell in the grid to change its value.
By default, an end user is able to change data using the DataGrid. However, this only changes values in the chart not a bound database.
DataGrid.setReadOnly(boolean),
setAllowDrag(boolean),
DataGridpublic void setAllowDrag(boolean value)
Enables or prevents the end user from dragging a marker with the mouse to change its value.
Alternativelly, AllowDrag from the setAllowChanges(java.util.EnumSet property can be used.
When performing a marker drag, the end user will be able to change the data point value and a Tooltip will appear.
setAllowChanges(java.util.EnumSet) public void setAntialiasing(boolean value)
Gives a smooth visual effect to the chart.
The ExtraStyle parameter also supports a DoubleBuffer value that can prevent flickering in real-time charts.
The setExtraStyle(java.util.EnumSet property also supports a DoubleBuffer enumeration that can prevent flickering in real-time charts.
The following images illustrate the antiliasing feature of the chart. The first image was made when the antiliasing is set to true.

The second image has antiliasing set to false.
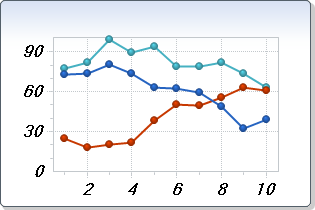
setExtraStyle(java.util.EnumSet) public void setAxesStyle(AxesStyle value)
Used to change the style of the axes.
Toggling the chart from 2D and 3D Attributes3D.setEnabled(boolean) will produce different effects.
Below, the style of the Axis is set to math:
getAxesX(),
getAxesY(),
getView3D(),
Axis.setStep(double),
Axis.setMinorStep(double),
Attributes3D.setEnabled(boolean),
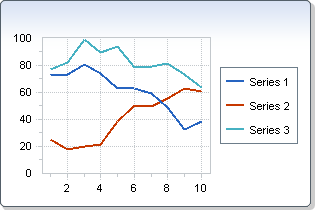
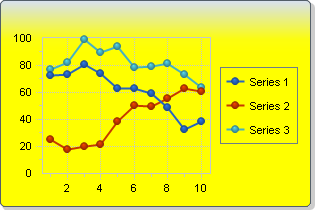
Attributes3Dpublic void setBackColor(Color value)
Sets the background color of the chart.
You can customize the color of the inside charting area by using the setPlotAreaColor(java.awt.Color) property.
A gradient may be assigned to the background using the setBackground(com.softwarefx.chartfx.server.adornments.IBackgroundAdornment) property.
For more information regarding the Color type, please refer to the Java API Documentation.
Named color are supported (e.g. java.awt.Color.red) as well as Hex notation (e.g. new java.awt.Color(0xEEFFEE)).
Here the BackColor of the Chart has been set to Yellow:
setPlotAreaColor(java.awt.Color),
setBackground(com.softwarefx.chartfx.server.adornments.IBackgroundAdornment),
setPlotAreaBackground(com.softwarefx.chartfx.server.adornments.IBackgroundAdornment),
SolidBackground,
ImageBackground,
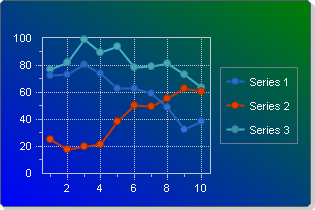
GradientBackgroundpublic void setBackground(IBackgroundAdornment value)
Allows you to assign a gradient to the background of a chart. PointAttributes.setFillMode(com.softwarefx.chartfx.server.FillMode) needs to be set to Gradient.
Each chart has only one background. Gradients may be applied to the background of both 2D and 3D charts.
You can use the setPlotAreaBackground(com.softwarefx.chartfx.server.adornments.IBackgroundAdornment) to assign a gradient to the inside chart area. However it is only supported in getView3D() charts.
Below, the background of the chart is set to be a gradient.
PointAttributes.setFillMode(com.softwarefx.chartfx.server.FillMode),
setPlotAreaBackground(com.softwarefx.chartfx.server.adornments.IBackgroundAdornment),
setPlotAreaColor(java.awt.Color),
GradientBackground,
ImageBackground,
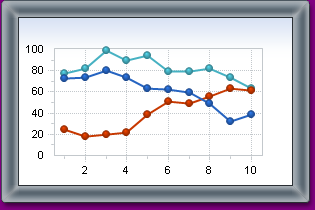
SolidBackgroundpublic void setBorder(IBorderAdornment value)
Sets a default or image border to the chart.
The Border property is used when setting default and image borders to the chart. In order to assign a standard or image border, you must create a new SimpleBorder or ImageBorder object. To use ImageBorder in your chart, the proper assembly must be added as a reference in the project.
The ImageBorder
Class
uses shading to give a multidimensional effect. The setPageColor(java.awt.Color) property can be used to modify the background color of the shaded area around the border.
The Border property is used when setting default and image borders to the chart. The ImageBorder
Class
uses shading to give a multidimensional effect.
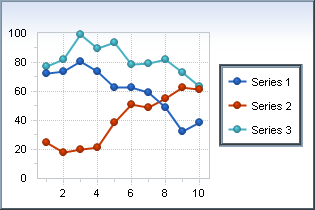
Below, the chart has an image border with the Embed style:
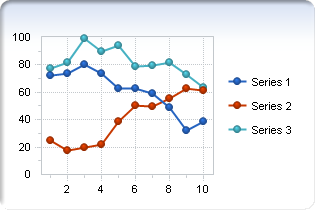
Below, the chart has a basic border with the Raised style:
setPageColor(java.awt.Color),
SimpleBorder,
ImageBorderpublic void setCodePage(int value)
Sets the CodePage for a chart.
The CodePage property specifies the character set that will be used when displaying dynamic content.
setCulture(java.util.Locale)public static void setConfigPath(String path)
Error: D:\Dev\CfxJava70\JavaDoc\docsource\\Objects\Chart\setConfigPath.xml
ERROR: Root element is missing.
public void setContentUrl(String value)
Sets string which contains the URL for the content page when the user wants the chart data rendered to stream.
Allows the webform to receive data from the content page which renders to stream the data for the chart.
The ContentUrl string is placed as the chart image's source. (i.e. <img src=CONTENTURL>)
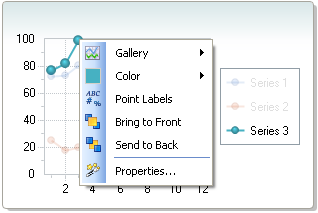
public void setContextMenus(boolean value)
Allows you to enable or disable context sensitive menus when the user right clicks a particular chart element.
This property allows the end user to easily alter various chart elements rather than finding the appropriate dialog in the chart tabbed dialog. Therefore, we strongly recommend the use of this setting.
This is the context menu activated when right-clicking on a point marker while the ContextMenus property is set to True:
public void setCrosshairs(boolean value)
Enables or Disables the cross-hairs marker in the chart.
If enabled, the end user will view a Cross-Hairs marker and a tooltip showing the point index and the value, when he presses the left button of the mouse. The Cross-Hairs marker will disappear when the user releases the button.
setToolTipFormat(java.lang.String)public void setCulture(Locale value)
Allows you to localize charts for a specific language and region.
Culture attributes set with this property will effect the entire chart, if no attributes are set using this property then Chart FX inherits the current Thread culture. For more information regarding the CultureInfo type and the Thread Class , please refer to the Java API Documentation.
The ValueFormat
Class
supports a ValueFormat.setCulture(java.util.Locale) property that allows you to set the culture for axes and values, not the entire chart.
If no attributes are set using this property or the Chart class setCulture(java.util.Locale) property, then Chart FX inherits the system culture.
When setting this property, you may need the Language Code and/or Country Code constants for the desired culture. For more information, please refer to the Locale documentation.
Example:
chart1.setCulture(new java.util.Locale("es", "ES"));
ValueFormat.setCulture(java.util.Locale),
setMessageText(java.lang.String, java.lang.String),
ValueFormatpublic void setDataMember(String value)
Sets the data mamber for the chart.
public void setDataSource(IDataSource value)
Sets the source containing the values used to populate the chart.
This property is a shortcut to the DataSourceSettings.setDataSource(com.softwarefx.chartfx.server.dataproviders.IDataSource) property of the DataSourceSettings
Class
.
Once the DataSource has been configured using this property, the chart is automatically bound to the data.
Important Note: When developing web apps and using any design time control to pass data to Chart FX, you must bind the data to the chart by calling the DataBind method after setting the DataSource (Web Apps Only):
chart1.DataSource = DataSet1.Table1;
chart1.DataBind();
DataSourceSettings.setStyle(java.util.EnumSet) ,
DataSourceSettings.getFields(),
DataSourceSettings.setDataSource(com.softwarefx.chartfx.server.dataproviders.IDataSource),
getDataSourceSettings(),
TextProvider,
DataSourceSettingspublic void setDataSourceID(String value)
Sets the ID of the data source control the chart should use to retrieve its data source.
Use the DataSourceID property to access the ID property of the data source control that the data listing control should use to retrieve its data source. The data source control referenced by the DataSourceID property can be any control that implements the IDataSource interface. The data source control must exist either in the same naming container as the data listing control that references it or in a parent control of the data listing control. When you specify a value for this property, the data listing control automatically binds to the specified data source control. You do not need to write code that explicitly calls the DataBind method.
Alternately, you can use the DataSource property to specify the source of values to bind to a data listing control. The data source must be an object that implements the IEnumerable interface (such as DataView, ArrayList, or Hashtable) or the IListSource interface to bind to a control derived from the BaseDataList Class . When you set the DataSource property, you must manually write the code to perform data binding.
If values are specified for both the DataSource property and the DataSourceID property, ASP.NET is not able to resolve the data source and a HttpException is thrown.
setDataSource(com.softwarefx.chartfx.server.dataproviders.IDataSource)public void setDirty(boolean value)
Returns a boolean specifying if the chart has been modified by the user.
If a user makes any modification to the chart, the return value of this property will be True, else False.
setAllowChanges(java.util.EnumSet) public void setEmbeddedData(boolean value)
Sets a value specifying if chart data will be embedded in the resulting html.
You MUST set the setUseClientLoader(boolean) property to False to use EmbeddedData.
This boolean property instructs Chart FX to embed the data used for the chart into the one resulting HTML page. There are several advantages to this scenario:
1) No Temporary files left on server. By default, chart files (Chart data) are generated on the server in the form of a file and downloaded separately.
2) This makes the data as secure as the page (i.e. SSL).
3) No round trip to download the chart data file.
One disadvange is when generating charts will a large number of data points is that the encoded data string can be very long. When a page is loaded, unexpected resizing may be visible, however, the resulting page should look correct.
The setUseClientLoader(boolean) property allows you to control the UseClientLoader assembly usage. The UseClientLoader assembly was implemented to increase the performance of the .NET Client Component in WebForm applications. Setting the UseClientLoader to False will force the download of the core client assembly by the client ever session. When UseClientLoader is True, a smaller assembly is downloaded per session. However, some functionality such as EmbeddedData and using Client Side events requires that UseClientLoader is set to false.
setUseClientLoader(boolean),
setRenderFormat(java.lang.String)public void setExportImageSize(Dimension value)
Sets the image dimensions for exported chart images.
This property accepts a Size type object assignment. Please see your development environment documentation for more information regarding this object.
This attribute may also controlled via the design-time controls in your Development IDE.
exportChart(java.io.OutputStream)public void setExtraStyle(EnumSet<ChartStyles> value)
Allows you to set additional visual attributes in the chart.
This property is set using the bitwise operators (And, Or, Not, Xor) provided by your Java API .
This property uses bitwise operators to turn on and off settings. To combine two flags. use the 'Or' bitwise operator.
public void setFileContents(EnumSet<FileContents> value)
Sets the attributes to save in chart files (Export method).
The FileContents property is used to customize the chart attributes saved in 'Binary' and 'XML' FileFormat output.
The setTemplateContents(java.util.EnumSet property may be used to customize what attributes are saved into chart template files (FileFormat.BinaryTemplate).
Use the exportChart(java.io.OutputStream) method to export charts as binary output containing the contents specified with this property.
This property is a mask property, this means all settings represent a bit in the word that you need to turn on or off according to what you want. For this purpose you'll need to use the bitwise operators supported by your development environment. Also ensure you use these operators to turn on/off bits and avoid losing previous settings.
By default the setting of this property is 'All' so all chart settings are actually saved in the chart file (including data).
setTemplateContents(java.util.EnumSet) ,
exportChart(java.io.OutputStream)public void setFont(Font value)
Sets the font type which will be used by default in the chart.
For more information see the Font Class in Java API .
Below, the default font of the chart is italic and has a font size of 12:
PointLabelAttributes.setFont(java.awt.Font)public void setForeColor(Color value)
Sets the default font color of the chart.
See the Color Class in Java API .
Named color are supported (e.g. Red), to use Hex notation you have to use quotes (e.g. "#FF00FF").
Below, the defaut font color is set to green:
setFont(java.awt.Font),
setBackColor(java.awt.Color)public void setGallery(Gallery value)
Sets the gallery type for the whole chart.
When you set the gallery with this property, it applies to all the series in the chart. If you want to create a Multitype (combination) chart you need to assign galleries individally for each series. Please refer to the SeriesAttributes.setGallery(com.softwarefx.chartfx.server.Gallery) properties of the SeriesAttributes
Class
.
setGalleryAttributes(com.softwarefx.chartfx.server.IGallery) allows you to assign additional attributes to selected gallery types.
GlobalAttributes.setGallery(com.softwarefx.chartfx.server.Gallery),
getAllSeries(),
SeriesAttributes,
SeriesAttributespublic void setGalleryAttributes(IGallery value)
Used to create a gallery object to assign additional attributes to the selected setGallery(com.softwarefx.chartfx.server.Gallery) of the chart. The gallery attribute can also be accessed through the getAllSeries() property.
This property returns an object which allows assignment of special properties to be set for the selected gallery. Note that not all gallery types support additional properties.
Below, the attributes of the Pie gallery are modified to render a 3D effect:
setGallery(com.softwarefx.chartfx.server.Gallery),
getAllSeries(),
Pie,
Radar,
GlobalAttributespublic void setHeight(int value)
Specifies the suggested height of the chart when generating images. This property allows you to configure the height of the image using units other than pixels.
You may also set the dimensions for the image generated using the ImageSettings.setHeight(int) and ImageSettings.setWidth(int) properties of ImageSettings.
For more information regarding the dimension classes, please refer to the documentation in the Java API .
This method overrides the default implementation of WebControl. Please refer to the documentation of WebControl in the Java API .
ImageSettings.setHeight(int),
ImageSettings.setWidth(int)public static void setLicenseString(String licenseString)
Error: Member Chart.LicenseString member not found
ERROR: Doc member not found
public void setMessageText(String key,
                           String message)
Allows you to customize default Chart FX strings which are displayed in the chart.
The key parameter is case sensitive, therefore you must use the exact pre-defined key value string.
You can use the Culture property to fully localize your charts. Elements that can be modified include the names of the culture, the writing system, and the calendar used, as well as formatting dates and strings.
The ValueFormat.setCulture(java.util.Locale) property of the ValueFormat
Class
allow you to assign culture specific formatting to labels and numbers for a selected axis.
Pre-defined message identifiers with the defualt values for each key (key=value):
NoData=No Data Available
LicDownloading=Downloading License ...
DataDownloading=Downloading Chart ...
DataFailed=Failed to download Chart\n{0}
Mask.Percentage=%s\n%l\n%v out of %t\n(%p%%)
Mask.OHLC=%l\nOpen: %v2\nHigh: %v4 - Low: %v1\nClose: %v3
Mask.HLC=%l\nHigh: %v3 - Low: %v1\nClose %v2
Mask.Ini=%s\n%l\nFrom %i to\n%v
Mask.XY=%s\n%l\nX: %x, Y: %v
Mask.Between=%s\n%l - %l\n%v - %v
Mask.Default=%s\n%l\n%v
LegMask.Series=Series #{0}
LegMask.Values=Value #{0}
CFX61B0=A temporary file on {0} could not be created
XAxis=X Axis
YAxis=Y Axis
General=General
Series=Series
Chart=Chart Area
Draw=Drawing Area
AllSeries=All Series
Auto=Auto
None=None
Raised=Raised
Light=Light
Dark=Dark
Opposite=Opposite
Shadow=Shadow
Number=Number
Currency=Currency
Scientific=Scientific
Percentage=Percentage
Date=Short Date
LongDate=Long Date
Time=Time
DateTime=Date-Time
Label0=Horizontal
Label1=Vertical
Label2=45 Degrees
Inside=Inside
Outside=Outside
Cross=Across
ExportFilter=ChartFX File (*.cfx)|*.cfx|Text File (data only)|*.txt|XML File (properties only)|*.xml|Bitmap Image (*.bmp)|*.bmp|Metafile Picture (*.emf)|*.emf
ImportFilter=ChartFX Files (*.cfx)|*.cfx|Text Files (data only)|*.txt|XML Files(properties only)|*.xml
NoPermission=The application does not have enough permissions to execute this operation.
key - Pre-defined message identifier.message - The new string value for the message.ValueFormat.setCulture(java.util.Locale),
ValueFormatpublic void setOutputWriter(IWriter value)
Allows you to select a specific external output writer for generating chart images.
In order to property configure this property, you will need to add the chart writer component to your chart. Once you have done so, you may assign this property the name of the instance of the output writer. Chart FX will then use that output writer to generate the chart. The idea is to be able to add additional output writers to the product as the demand for a particular output format increases.
If you would like to generate a SVG without using this property, you may do so by adding the SVG writer assembly (ChartFX.Writer.SVG.dll) as a reference to the project and setting the setRenderFormat(java.lang.String)property to 'SVG'.
setRenderFormat(java.lang.String)public void setPageColor(Color value)
Allows you to specify a form background color needed to fill areas around image border shadowing.
This is automatically done in Chart FX when creating desktop applications. This property is useful when using image borders with the Internet Edition.
For more information regarding the Color type, please refer to the Java API Documentation.
The ImageBorder
Class
uses shading to give a multidimensional effect. The PageColor property can be used to modify the background color of the shaded area around the border. Below, the page color of the chart has been set to purple:
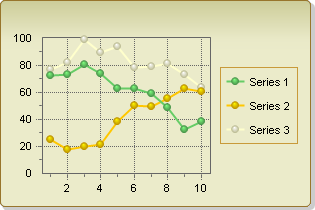
setBorder(com.softwarefx.chartfx.server.adornments.IBorderAdornment)public void setPalette(String value)
Allows you to set a pre-defined palette.
When changing the palette, all the properties related to changing colors in the chart will also be affected as
Chart FX for Java
will change the windows palette for the chart window. So if you previously set a color using any of the
Chart FX for Java
supported properties (setForeColor(java.awt.Color), setBackColor(java.awt.Color), etc) this color may not be part of the applied palette and therefore will be replaced by a color in the selected palette.
New palettes may be created and integrated into Chart FX for Java . For more information regarding palette creation, please contact Software FX support.
Below is a list of Chart FX for Java palettes:
Natural.Sky
ChartFX6.EarthTones
ChartFX6.ModernBusiness
DarkPastels.Pastels
Mesa.Mesa
Natural.Adventure
HighContrast.HighContrast
Vivid
ChartFX6.Alternate
ChartFX6.Windows
ChartFX6.ChartFX6
Note: To properly load these palettes, you will simply use their string names (e.g. "DarkPastels.Pastels").
Below, the palette of the chart is set to EarthTones, sucessively:
PointAttributes.setColor(java.awt.Color),
PointAttributes.setAlternateColor(java.awt.Color),
setForeColor(java.awt.Color),
setBackColor(java.awt.Color),
PointAttributes,
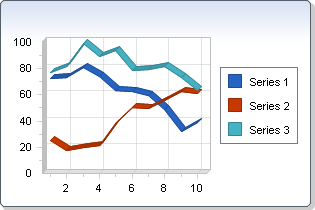
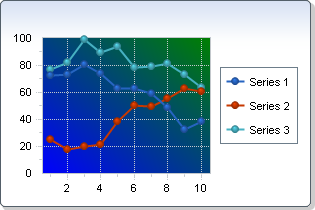
SeriesAttributespublic void setPlotAreaBackground(IBackgroundAdornment value)
Allows you to assign a gradient to the inside area of a chart.
Once you have created a gradient using the GradientBackground.setAngle(float), GradientBackground.getColors(), GradientBackground.getFactor() and GradientBackground.getPosition() properties, you will need to assign the gradient
Class
to the InsideBackObject.
You can use the setBackground(com.softwarefx.chartfx.server.adornments.IBackgroundAdornment) to assign a gradient to the chart background area.
Gradients applied to the PlotAreaBackground of a chart will only be applied to 2D charts. Gradients applied to the PlotAreaBackground of 3D charts will be ignored, however gradients applied to the setBackground(com.softwarefx.chartfx.server.adornments.IBackgroundAdornment) of both 2D and 3D charts is supported.
To use gradients, the assembly ChartFX.Adornments.dll must be added as a reference in the project.
Below is an example of a gradient rendered in the plot area of the chart:
GradientBackground.setAngle(float),
setBackground(com.softwarefx.chartfx.server.adornments.IBackgroundAdornment),
GradientBackground.getColors(),
GradientBackground.getFactor(),
GradientBackground.getPosition(),
setPlotAreaColor(java.awt.Color),
setBackColor(java.awt.Color),
Pane.setBackground(com.softwarefx.chartfx.server.adornments.IBackgroundAdornment),
GradientBackground,
SolidBackground,
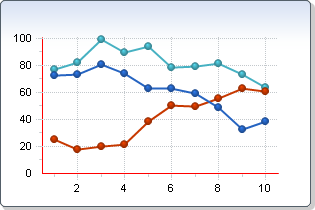
ImageBackgroundpublic void setPlotAreaColor(Color value)
Gets and Sets the color of the PlotAreaBackground. Alternatively, the color can be access using the Color property of the setPlotAreaBackground(com.softwarefx.chartfx.server.adornments.IBackgroundAdornment) object.
For more information regarding the Color type, please refer to the Java API Documentation.
Named color are supported (e.g. Red), to use Hex notation you have to use quotes (e.g. "#FF00FF").
When the chart renders several panes, setting the color of the plot area is equivalent to setting the Pane.setBackColor(java.awt.Color) of the panes individually.
Below, the color of the plot area is set to purple:
PlotAreaColor supports transparency. When the PlotArea is transparent, the background of the PlotArea is rendered by the setBackground(com.softwarefx.chartfx.server.adornments.IBackgroundAdornment) and setBackColor(java.awt.Color) properties. In this screenshot, the PlotAreaColor is set to transparent and the setBackColor(java.awt.Color) is set to blue:
![]()
Pane.setBackColor(java.awt.Color),
setBackColor(java.awt.Color),
setPlotAreaBackground(com.softwarefx.chartfx.server.adornments.IBackgroundAdornment),
ImageBackground,
SolidBackgroundpublic void setProxyUri(String value)
Used to add the Proxy URI of a proxy server.
This property should only be used when generating a .NET Client Control. (Chart.RenderFormat =".NET")
You may configure this property to an empty string instructing Chart FX to try and obtain the correct proxy for the Java API installed. However, for this feature to work, Chart FX requires Full Trust in the .NET security settings for the client computer accessing the control.
Unfortunately, PAC files are not supported for Chart FX.
setRenderFormat(java.lang.String),
Chartpublic void setRenderFormat(String value)
Sets the chart format to generate.
The possible options are: ".NET", "Image", "Jpeg", "Png", "SVG", "Flash" or "Auto". When configured to "Auto", ChartFX will use the HTTP_USER_AGENT variable and to determine the appropriate tag compatible with the browser being used by the user. If no value is specified, the default setting is Image.
renderControl()public void setTemplateContents(EnumSet<FileContents> value)
Sets the attributes to save in personalization features and template files (Export method).
The TemplateContents property is used to customize the chart attributes saved in 'BinaryTemplate' FileFormat output.
The TemplateContents property is also used to control the attributes saved into templates saved when utilizing Personalization options.
The setFileContents(java.util.EnumSet property may be used to customize what attributes are saved into chart Binary files (FileFormat.Binary).
Use the exportChart(java.io.OutputStream) method to export charts as BinaryTemplate output containing the contents specified with this property.
This property is a mask property, this means all settings represent a bit in the word that you need to turn on or off according to what you want. For this purpose you'll need to use the bitwise operators supported by your development environment. Also ensure you use these operators to turn on/off bits and avoid losing previous settings.
By default the setting of this property is 'Template' so only selected chart elements are saved (excluding data).
setFileContents(java.util.EnumSet) ,
exportChart(java.io.OutputStream)public void setToolTipFormat(String value)
Allows you to control the information to be displayed in the tooltip when the user positions the mouse over a particular data point in the chart.
setToolTips(boolean) toggle on/off the tooltip in the chart.
The syntax for this property is the same as the one used in the PointLabelAttributes.setFormat(java.lang.String) property. Variables can be accessed using the % following the variable you want to include:
l Shows X-Axis Legend.
k Shows X-Axis Key Legend.
s Shows Series Legend.
S Shows the Series Index.
x Shows XValue (XY charts, when they were set with X values).
i Shows IniValues (Gantt).
v Shows Data Value.
v <n> For types that require more than one series, these are replaced by the value of each one. (n represents an index).
t Series Total (Sum of all points in this series).
p Percentage of total this point represents (Pie).
T Point Total (Sum of all series for this point).
P Percentage of total this series represents (Used in stacked charts).
X displays the marker X value for any chart type including those that do not support X values such as bar.
N Shows the index for the point.
L Shows the Text property of the PointAttributes object.
setToolTips(boolean),
PointLabelAttributes.setFormat(java.lang.String),
expandMacros(java.lang.String, int, int, boolean),
GlobalAttributes,
PointLabelAttributespublic void setToolTips(boolean value)
Allows you to enable or disable tooltips when the user positions the mouse over a particular element in the chart area only.
This property does not affect whether if the Toolbar ToolTips will appear or not when the user positions the mouse over a particular button or element in the Toolbar. For more information on how to disable Toolbar tooltips, please refer to the ToolTips property in the ToolBar
Class
.
This property must be set to True for the GetTip event to fire.
setToolTipFormat(java.lang.String),
getToolBar(),
getMenuBar(),
ToolBarpublic void setUseCallbacksForEvents(boolean value)
Allows you to use CallBacks scripts when events are fired.
Use the UseCallbacksForEvents property to use CallBacks scripts for the Chart events.
public void setUseClientLoader(boolean value)
Sets a value indicating whether to generate an object with a small "wrapper" control for faster downloads when generating .NET Client Controls.
Web applications generating charts as .NET Client Controls as opposed to images take additional time to generate and download all the required components. This wait time can be associated with the connection speed of the end user as well as the process which the Microsoft .NET Framework utilizes in order to display .NET controls on the client computer.
The first time a browser encounters a .NET control in a page it has to load the .NET framework at the client machine; in addition the "main" control (in this case the Chart FX .NET Internet Client Control) is downloaded to compare against the version in the download cache (this is done on a per-session basis).
In order to prevent the entire Chart FX .NET Internet Client Control from being downloaded each time, a smaller wrapper control is downloaded with the version information and is compared to the version of the Chart FX .NET Internet Client Control in the downloaded cache. If the version is compatible, the control in cache is used instead of requiring another download.
On some slower connections, we have measured an improvement from 30 seconds to about 7 seconds (on the first hit of a browser session).
setRenderFormat(java.lang.String),
setEmbeddedData(boolean)public void setVisible(boolean value)
Sets a value specifying to show or hide the chart.
By default the chart is visible.
public void setWidth(int value)
Specifies the suggested width of the chart when generating images. This property allows you to configure the width of the image using units other than pixels.
You may also set the dimensions for the image generated using the ImageSettings.setHeight(int) and ImageSettings.setWidth(int) properties of ImageSettings.
For more information regarding the dimension classes, please refer to the Java API documentation.
This method overrides the default implementation of WebControl. Please refer to the documentation of WebControl in the Java API .
ImageSettings.setHeight(int),
ImageSettings.setWidth(int)public void setZoom(boolean value)
Allows you to select a section of the chart using the mouse cursor and zoom in that area.
When set to True, this property allows you to select a section of the chart using the mouse cursor for Chart FX to zoom in for a closer look.
When set to False, this property turns off all zoom attributes globally, including the Axis object Axis.zoom(double, double) and Axis.zoomOff() methods.
When the Zoom property is enabled, you can select a portion of the chart to Zoom by left clicking and dragging your mouse of the desired area:
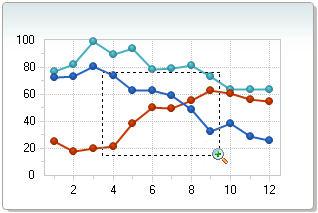
Once you have selected a range, the zoom area of the chart will be displayed:
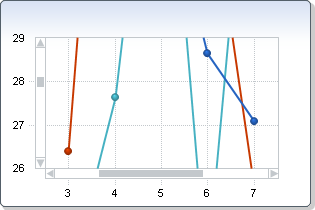
getAxisX(),
getAxisY(),
getAxisY2(),
getAxesX(),
getAxesY(),
Axis.zoom(double, double),
Axis.zoomOff(),
Axispublic void updateSizeNow()
Allows you to force a scale calculation before the chart is drawn.
Scale calculations in Chart FX are delayed until the chart is about to be drawn. This increases the performance as setting multiple properties from only one windows event, cause only one recalculation.
The UpdateSizeNow method allows you to make this on demand. This allows you to access information about the chart scaling before it is drawn. It also allows you to make changes to a chart and export it to a picture without the chart ever being visible.
exportChart(java.io.OutputStream)public void zoomToPercentage(int percentage)
Zooms the chart to center based on configured percentage value.
This method is used to zoom to the center of the chart. Both X and Y axes are zoomed at the same time.
The percentage value should be configured as an integer value between 0 and 100.
After calling this method, the user can continue to zoom the chart using the mouse in selected chart types. Webform chart images (static and interactive images) do not support continued zoom after the ZoomToPercentage call.
percentage - The percentage to zoom.Axis.setScrollView(double, double)
public void zoomToWindow(int x1,
                         int y1,
                         int x2,
                         int y2)
Zooms the chart to a rectangular area based on specified x and y coordinates for the rectangle
The Zooming rectangle is defined Using Left and Top pixel coordinates.
The X and Y coordinates are relative to the Top Left corner of the plot area. I other words, the top left point of the plot area is point (0,0)
x1 - X coordinate of the zooming rectangle's Left sidey1 - Y coordinate of the zooming rectangle's Top sidex2 - X coordinate of the zooming rectangle's Right sidey2 - Y coordinate of the zooming rectangle's Bottom sidezoomToPercentage(int)
|
http://www.softwarefx.com | |||||||
| PREV CLASS NEXT CLASS | FRAMES NO FRAMES | |||||||
| SUMMARY: NESTED | FIELD | CONSTR | METHOD | DETAIL: FIELD | CONSTR | METHOD | |||||||