 com.softwarefx.chartfx.server.PointAttributes
|
Chart FX 7 for Java Server | |||||||
| PREV CLASS NEXT CLASS | FRAMES NO FRAMES | |||||||
| SUMMARY: NESTED | FIELD | CONSTR | METHOD | DETAIL: FIELD | CONSTR | METHOD | |||||||
java.lang.Object
public class PointAttributes
Provides access to the PointAttributes object.
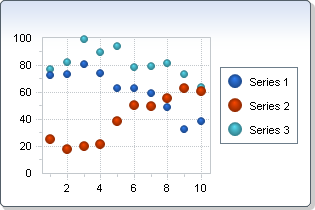
The goal of any chart is to provide a clear visual representation of data that can be easily read and interpreted by the user. To this end, Chart FX for Java enables you to set PointLabels to clearly mark and identify the values on the chart. This is particularly useful when there are many data points and many series, which could appear busy and difficult to decipher.
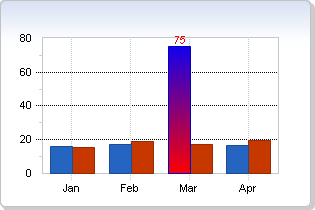
Chart FX for Java offer enhanced functionality and versatility. You are able to control the size, color, font etc. of every individual point label in your chart. This is extremely useful for highlighting critical points of data in a chart.
| Constructor Summary | |
|---|---|
PointAttributes()
|
|
| Method Summary | |
|---|---|
Color |
getAlternateColor()
Gets the AlternateColor. |
BarShape |
getBarShape()
Gets the BarShape. |
BorderAttributes |
getBorder()
Provides access to the border attributes object. |
Color |
getColor()
Gets the Color. |
FillMode |
getFillMode()
Gets the FillMode. |
LineAttributes |
getLine()
Gets the LineAttributes object for the particular point. |
Link |
getLink()
Gets the Link object for a selected PointAttributes item. |
MarkerShape |
getMarkerShape()
Gets the MarkerShape. |
short |
getMarkerSize()
Gets the MarkerSize. |
HatchStyle |
getPattern()
Gets the Pattern. |
Image |
getPicture()
Gets the Picture. |
PointLabelAttributes |
getPointLabels()
Provides access to PointLabelAttributes allowing for the manipulation of attributes pertaining to the point label. |
short |
getSeparateSlice()
Gets the SeparateSlice. |
Object |
getTag()
Gets the Tag. |
String |
getText()
Gets the Text. |
short |
getVolume()
Gets the Volume. |
void |
setAlternateColor(Color value)
Sets the alternate color for a selected item when using gradient FillMode. |
void |
setBarShape(BarShape value)
Sets the Shape for the Bars. |
void |
setColor(Color value)
Allows you to set a color for the selected item. |
void |
setFillMode(FillMode value)
Sets a value indicating how Chart FX should fill the area representing the point. |
void |
setMarkerShape(MarkerShape value)
Sets the the type used to paint markers for the selected item. |
void |
setMarkerSize(short value)
Sets a value controlling the size of the markers for the selected item. |
void |
setPattern(HatchStyle value)
Sets a value specifying the pattern for the selected item. |
void |
setPicture(Image value)
Sets a value specifying the picture associated to the selected item. |
void |
setSeparateSlice(short value)
Sets a value allowing you to separate a slice of a Pie or Doughnut chart for a selected item. |
void |
setTag(Object value)
Sets and object for the specific item. |
void |
setText(String value)
Sets a value for labeling the point or series attribute. |
void |
setVolume(short value)
Sets a value indicating a volume for a data point markers in supported galleries. |
| Methods inherited from class java.lang.Object |
|---|
equals, getClass, hashCode, notify, notifyAll, toString, wait, wait, wait |
| Constructor Detail |
|---|
public PointAttributes()
| Method Detail |
|---|
public Color getAlternateColor()
Gets the AlternateColor. For more detail see setAlternateColor(java.awt.Color).
public BarShape getBarShape()
Gets the BarShape. For more detail see setBarShape(com.softwarefx.chartfx.server.BarShape).
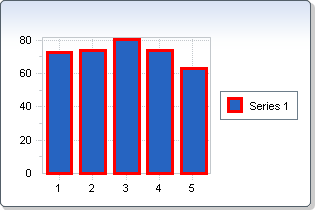
public BorderAttributes getBorder()
Provides access to the border attributes object.
The members of the BorderAttributes Class allow customization of the border for Points and Series.
The members of the BorderAttributes
Class
allow customization of the border for PointAttributes and SeriesAttributes.
Color, Effect, Style, Width, etc, are some of the configurable attributes for Borders.
The following code, which set the Border color for all series to red,
chart1.AllSeries.Border.Color = Color.Red;
will produce the following chart:
The following code, which set the Border color for all series to red,
get-chart -AllSeries.Border.Color Red
will produce the following chart:
getLine(),
SeriesAttributes,
PointAttributespublic Color getColor()
Gets the Color. For more detail see setColor(java.awt.Color).
public FillMode getFillMode()
Gets the FillMode. For more detail see setFillMode(com.softwarefx.chartfx.server.FillMode).
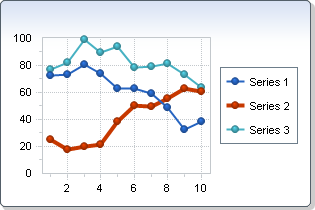
public LineAttributes getLine()
Gets the LineAttributes object for the particular point.
The LineAttributes members allows customization of the lines at the ChartGlobalAttributes, SeriesAttributes and PointAttributes level.getLine()
LineAttributes will produce a different effect to each Gallery type. For a example, setting the Line.Width in a Bar chart will set width the line that goes around the bar, while in a Line chart, it will set the width of the line that connects the points.
Below, the second series line width is set to 4:
LineAttributes,
GlobalAttributes,
SeriesAttributespublic Link getLink()
Gets the Link object for a selected PointAttributes item.
Developers may obtain the Link object for a PointAttributes item using this property. Using the supported Link
Class
members, developers may configure a Link.setUrl(java.lang.String) and Target for the object.
Link.setUrl(java.lang.String),
Link.setTarget(java.lang.String),
AxisSectionBase.getLink(),
Linkpublic MarkerShape getMarkerShape()
Gets the MarkerShape. For more detail see setMarkerShape(com.softwarefx.chartfx.server.MarkerShape).
public short getMarkerSize()
Gets the MarkerSize. For more detail see setMarkerSize(short).
public HatchStyle getPattern()
Gets the Pattern. For more detail see setPattern(com.softwarefx.HatchStyle).
public Image getPicture()
Gets the Picture. For more detail see setPicture(java.awt.Image).
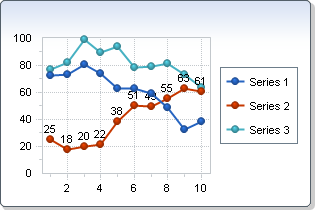
public PointLabelAttributes getPointLabels()
Provides access to PointLabelAttributes allowing for the manipulation of attributes pertaining to the point label.
The PointAttributes members allows customization of the Point labels at the ChartGlobalAttributes, SeriesAttributes and PointAttributes level.getLine()
Below, the second series point labels is set to visible:
SeriesAttributespublic short getSeparateSlice()
Gets the SeparateSlice. For more detail see setSeparateSlice(short).
public Object getTag()
Gets the Tag. For more detail see setTag(java.lang.Object).
public String getText()
Gets the Text. For more detail see setText(java.lang.String).
public short getVolume()
Gets the Volume. For more detail see setVolume(short).
public void setAlternateColor(Color value)
Sets the alternate color for a selected item when using gradient FillMode.
This property is used in conjunction with setFillMode(com.softwarefx.chartfx.server.FillMode) property. You need to set the FillMode to gradient in order to use AlternateColor property.
chart1.FillMode= FillMode.Gradient;
This property is used in conjunction with setFillMode(com.softwarefx.chartfx.server.FillMode) property. You need to set the FillMode to gradient in order to use AlternateColor property.
get-chart -FillMode Gradient
To create a gradient for an item, you first need to set an initial color using the setColor(java.awt.Color) property. Then you can assign a AlternateColor to complete the gradient assignment.
For more information regarding the Color type, please refer to the Java API Documentation.
Named color are supported (e.g. Red), to use Hex notation you have to use quotes (e.g. "#FF00FF").
Below, the second series color is a gradient using two different colors:
This property is used in conjunction with setFillMode(com.softwarefx.chartfx.server.FillMode) property. You need to set the FillMode to gradient in order to use AlternateColor property.
setColor(java.awt.Color),
Chart.setPalette(java.lang.String),
setFillMode(com.softwarefx.chartfx.server.FillMode),
SeriesAttributes,
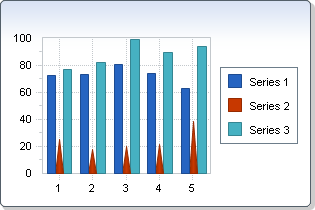
GlobalAttributespublic void setBarShape(BarShape value)
Sets the Shape for the Bars.
This property applies when the chart Gallery is set to Bar.
Below, the second series barshape is set to cone:
public void setColor(Color value)
Allows you to set a color for the selected item.
If no colors are specified, the default color is automatically selected by Chart FX for Java when you create the chart, and chosen according to the current palette and its position in the series array.
Named color are supported (e.g. Red), to use Hex notation you have to use quotes (e.g. "#FF00FF").
For more information regarding the Color type, please refer to your Java API documentation.
Chart.setPalette(java.lang.String),
BorderAttributes.setColor(java.awt.Color),
Chart.setPalette(java.lang.String),
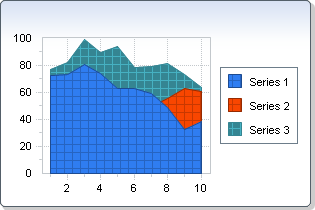
SeriesAttributespublic void setFillMode(FillMode value)
Sets a value indicating how Chart FX should fill the area representing the point.
The default value is Solid.
The difference between colored patterns and black & white patterns, also known as hatched paterns, is that hatched patterns are defined by windows and they can be resized when printing the charts. However, there are limited hatched patterns available.
The
Chart FX for Java
patternbar uses colored patterns that are suitable for the screen but when they are printed, they are defined as 8x8 pixels and therefore they will not be visible when printing with high resolution printer (i.e. 600 dpi). The Printer.setForceColors(boolean) property in the printer object uses hatched patterns to print the charts.
A general rule of thumb is to use colored patterns for the screen and black & white patterns when printing the chart.
When creating gradients on point or series markers, the FillMode must be set to FillMode.Gradient. The setColor(java.awt.Color) and setAlternateColor(java.awt.Color) properties can be set to create the desired gradient colors.
Below, the second series fillmode is set to pattern:
setPattern(com.softwarefx.HatchStyle),
setColor(java.awt.Color),
setAlternateColor(java.awt.Color),
Chart,
SeriesAttributes,
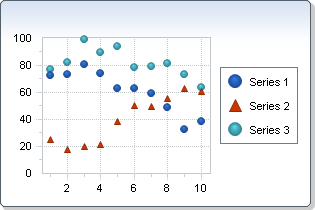
GlobalAttributespublic void setMarkerShape(MarkerShape value)
Sets the the type used to paint markers for the selected item.
Point markers will not be shown in 3D line charts.
This property applies only to: LINES, CURVE, SCATTER, PARETO, STEP and RADAR charts.
Below, the second series marker shape is set to triangle:
setMarkerSize(short),
Chart.setGallery(com.softwarefx.chartfx.server.Gallery),
setPicture(java.awt.Image),
Chart,
SeriesAttributespublic void setMarkerSize(short value)
Sets a value controlling the size of the markers for the selected item.
This property sets the radius of the marker in physical units (pixels). You must make sure the setMarkerShape(com.softwarefx.chartfx.server.MarkerShape) Property is set to a valid point type for this property to take effect.
Point markers will not be shown in 3D line charts.
Below, the second series marker size is set to 4:
setMarkerShape(com.softwarefx.chartfx.server.MarkerShape),
SeriesAttributes.setMarkerStep(short),
Chart,
SeriesAttributespublic void setPattern(HatchStyle value)
Sets a value specifying the pattern for the selected item.
To use this property, you must make sure the chart setFillMode(com.softwarefx.chartfx.server.FillMode) is set to either B&W or colored patterns.
If the chart's fill mode is set to colored patterns you can set both the background and foreground color of the pattern with the setColor(java.awt.Color) and setAlternateColor(java.awt.Color) properties, respectively.
Below, the second series pattern is set to cross:
setFillMode(com.softwarefx.chartfx.server.FillMode),
setColor(java.awt.Color),
setAlternateColor(java.awt.Color),
SeriesAttributes,
Chartpublic void setPicture(Image value)
Sets a value specifying the picture associated to the selected item.
The Picture property may be used in two different ways depending on the chart's gallery and FillMode:
1. If the chart gallery is one that uses point markers, meaning you can set the shape of the marker using the MarkerShape property, then the configured image will be used as a point marker as long as the setMarkerShape(com.softwarefx.chartfx.server.MarkerShape) for that point is set to MarkerShape.Picture.
2. If the chart gallery is one that uses bars, area markers or pie slices (Bar, Area or Pie type charts), then the image will be tiled in the selected series or point. However, in order for the tiled effect to be applied you must set the setFillMode(com.softwarefx.chartfx.server.FillMode) to FillMode.Pattern.
The Legends and DataEditor will also show the picture but with an appropriated size. Notice that if you do not set the setFillMode(com.softwarefx.chartfx.server.FillMode) to FillMode.Pattern, the configured picture will only be used with charts that have point markers.
When this property is set to a 3D chart, the sides of the markers (3D perspective) are painted with the configured series color.
For more information regarding the Image type, please refer to the Java API Documentation.
SeriesAttributes.setGallery(com.softwarefx.chartfx.server.Gallery),
SeriesAttributespublic void setSeparateSlice(short value)
Sets a value allowing you to separate a slice of a Pie or Doughnut chart for a selected item.
Setting this property to 100 will make the vertex of the slice to be on the edge of the pie.
Chart FX for Java does not provide administrative properties, such as the biggest slice in a PIE chart, so if you want to separate a particular slice based on a certain condition, you must first determine the slice to be separated based on the data contained in the chart.
Below, the second point separate slice is set to 50:
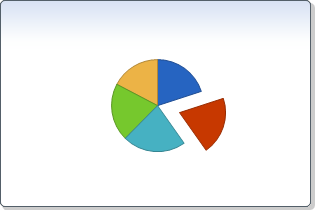
Chart.setGallery(com.softwarefx.chartfx.server.Gallery),
SeriesAttributes.setGallery(com.softwarefx.chartfx.server.Gallery),
Pie.setSliceSeparation(int),
Chart,
Piepublic void setTag(Object value)
Sets and object for the specific item.
The Tag allows the developer to assign and external object to a Point, Series, or the Chart itself, to be retrieved later.
This feature is very useful for drill-down. For example, a data collection which contains the all the data for a particular series can be stored in the Tag, and accessed later, when the user clicks on that series.
Chart,
SeriesAttributes,
GlobalAttributespublic void setText(String value)
Sets a value for labeling the point or series attribute.
For Points, Text will be used to asign a string to the point, which can be used as a getPointLabels(), in a Chart.setToolTips(boolean), etc.
For SeriesAttributes and ConditionalAttributes, Text will be used to asign a string for the Chart.getLegendBox().
Chart.setToolTips(boolean),
getPointLabels(),
Chart.getLegendBox(),
SeriesAttributes,
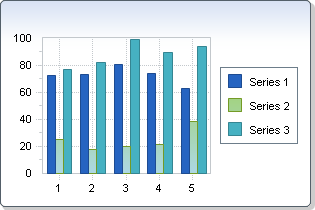
ConditionalAttributespublic void setVolume(short value)
Sets a value indicating a volume for a data point markers in supported galleries. By adjusting the volume, you can modify the amount of space you want between the items.
The larger the value, the lesser the distance between the selected point and its neighbors.
This property has a dual functionality depending on the clustered status of the chart, as follows:
If the chart is clustered, this property is used to specify the amount of space between the selected point and its neighbors in the z-axis (a.k.a. Gap Depth). When used in this context, this property is used for any chart type that supports clustered options (Including Multi-Type charts)
When the chart is not clustered, this property controls the amount of space between the selected point and its neighbors in the x-axis (a.k.a. Gap Width). When used in this context, this property applies to any chart type that allows side to side positioning of the series (BAR, BUBBLE, CANDLESTICK, HI-LO-CLOSE, OPEN-HI-LOW-CLOSE and CUBES).
If you want to control the Volume property for all the series in the chart (i.e. apply the same volume setting to all of them) you can use the chart
Class
Chart.getAllSeries() property.
Below, the first point Volume is set to 100 and the second point Volume is set to 40:
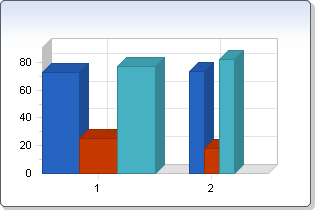
Chart.setGallery(com.softwarefx.chartfx.server.Gallery),
SeriesAttributes.setGallery(com.softwarefx.chartfx.server.Gallery),
Chart,
SeriesAttributes
|
http://www.softwarefx.com | |||||||
| PREV CLASS NEXT CLASS | FRAMES NO FRAMES | |||||||
| SUMMARY: NESTED | FIELD | CONSTR | METHOD | DETAIL: FIELD | CONSTR | METHOD | |||||||