 com.softwarefx.chartfx.server.galleries.Pie
|
Chart FX 7 for Java Server | |||||||
| PREV CLASS NEXT CLASS | FRAMES NO FRAMES | |||||||
| SUMMARY: NESTED | FIELD | CONSTR | METHOD | DETAIL: FIELD | CONSTR | METHOD | |||||||
java.lang.Object
public class Pie
Provides access to the Pie and Doughnut gallery objects.
The properties of the Pie
Class
allow you to customize the visual attributes of a Pie chart. In order to make the supported members available, you must first set the gallery of the chart to Pie, and cast the Chart.setGalleryAttributes(com.softwarefx.chartfx.server.IGallery) property of the Chart to the Pie
Class
:
Pir pie = (Pie) chart1.getGalleryAttributes();
The cast will fail if the gallery is not set to Pie or Doughnut.
Once you have done this, using the newly created object you can assign these special attributes for the Pie or Doughnut gallery type in your chart.
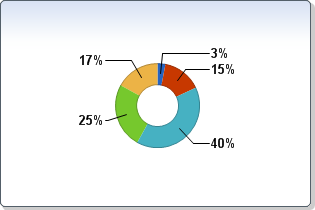
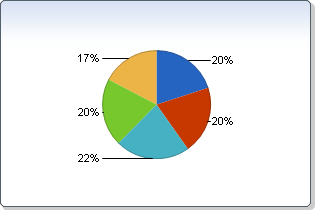
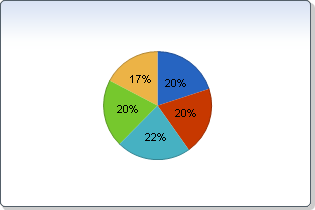
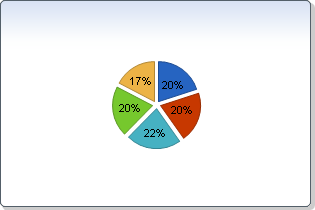
By default, if Chart FX for Java concludes that drawing a label inside a Pie chart will make the readability of the chart harder, this label is drawn outside the chart. You can set LabelsInside to false to force Chart FX for Java to draw all the labels outside the Chart. The following chart illustrates the default behavior of the Pie chart:

The gallery of the chart can also be set to a Doughnut. The attributes object of the Doughnut gallery is of type Pie:
| Constructor Summary | |
|---|---|
Pie()
|
|
| Method Summary | |
|---|---|
int |
getDoughnutThickness()
Gets the DoughnutThickness. |
ExplodingMode |
getExplodingMode()
Gets the ExplodingMode. |
int |
getLabelLineBreak()
Gets the LabelLineBreak. |
int |
getMaximumLabelMargin()
Gets the MaximumLabelMargin. |
int |
getSliceSeparation()
Gets the SliceSeparation. |
int |
getStartAngle()
Gets the StartAngle. |
boolean |
isLabelsInside()
Gets the LabelsInside. |
boolean |
isShadows()
Gets the Shadows. |
boolean |
isShowLines()
Gets the ShowLines. |
boolean |
isSquare()
Gets the Square. |
boolean |
isStacked()
Gets the Stacked. |
void |
setDoughnutThickness(int value)
Controls the thickness of the doughnut as a percentage of the outside radius. |
void |
setExplodingMode(ExplodingMode value)
Allows you to set how the slices of a pie chart are displayed. |
void |
setLabelLineBreak(int value)
Controls the line that connects the labels with its pie/doughnut slice. |
void |
setLabelsInside(boolean value)
Instructs Chart FX for Java to try to paint the point labels directly on the corresponding slice of a Pie chart. |
void |
setMaximumLabelMargin(int value)
Sets the maximum margin (in pixels) allowed between the labels and the borders of the pie chart. |
void |
setShadows(boolean value)
Adds a shadow effect to a 2D pie chart. |
void |
setShowLines(boolean value)
Shows or hides lines which connect the point labels to a Pie chart. |
void |
setSliceSeparation(int value)
Sets the pie slice separation (in pixels) when using the ExplodingMode property. |
void |
setSquare(boolean value)
Forces Pie charts to be contained in a perfect square (no matter the window proportion). |
void |
setStacked(boolean value)
Sets a Boolean value specifying whether or not to stack a pie/doughnut chart. |
void |
setStartAngle(int value)
Sets a value specifying the starting angle of the first slice in a pie chart. |
| Methods inherited from class java.lang.Object |
|---|
equals, getClass, hashCode, notify, notifyAll, toString, wait, wait, wait |
| Constructor Detail |
|---|
public Pie()
| Method Detail |
|---|
public int getDoughnutThickness()
Gets the DoughnutThickness. For more detail see setDoughnutThickness(int).
public ExplodingMode getExplodingMode()
Gets the ExplodingMode. For more detail see setExplodingMode(com.softwarefx.chartfx.server.galleries.ExplodingMode).
public int getLabelLineBreak()
Gets the LabelLineBreak. For more detail see setLabelLineBreak(int).
public int getMaximumLabelMargin()
Gets the MaximumLabelMargin. For more detail see setMaximumLabelMargin(int).
public int getSliceSeparation()
Gets the SliceSeparation. For more detail see setSliceSeparation(int).
public int getStartAngle()
Gets the StartAngle. For more detail see setStartAngle(int).
public boolean isLabelsInside()
Gets the LabelsInside. For more detail see setLabelsInside(boolean).
public boolean isShadows()
Gets the Shadows. For more detail see setShadows(boolean).
public boolean isShowLines()
Gets the ShowLines. For more detail see setShowLines(boolean).
public boolean isSquare()
Gets the Square. For more detail see setSquare(boolean).
public boolean isStacked()
Gets the Stacked. For more detail see setStacked(boolean).
public void setDoughnutThickness(int value)
Controls the thickness of the doughnut as a percentage of the outside radius.
The default value is 50 which means the radius of the hole is half of the radius of the outer wall. As this value decreases, the doughnut becomes thinner.
When the setStacked(boolean) property is set to true, a multi-series pie/doughnut chart will draw each series on top of each other (2D Only) instead of side-by-side:
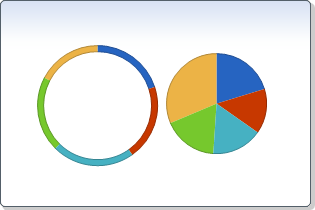
The PointAttributes.setVolume(short) property may be used to control the size of each series. Series 0 is painted behind the others, so it should be set as the largest (e.g. Volume = 100).
Chart.setGallery(com.softwarefx.chartfx.server.Gallery),
Chart.setGalleryAttributes(com.softwarefx.chartfx.server.IGallery),
setStacked(boolean),
PointAttributes.setVolume(short),
Chartpublic void setExplodingMode(ExplodingMode value)
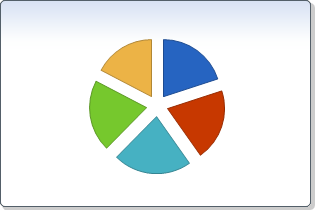
Allows you to set how the slices of a pie chart are displayed.
You can set the distance a slice will be separated from the pie chart using the setSliceSeparation(int) property.
Below, the pie is set to the Full exploding mode:
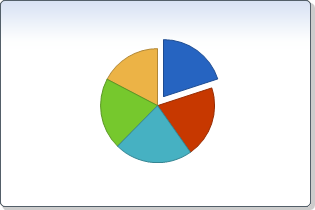
Alternatively, the Pie chart is here set to the First exploding mode:
setSliceSeparation(int),
setSquare(boolean),
Chart.setGallery(com.softwarefx.chartfx.server.Gallery),
Chartpublic void setLabelLineBreak(int value)
Controls the line that connects the labels with its pie/doughnut slice. Notice that the setLabelsInside(boolean) property should be set to false.
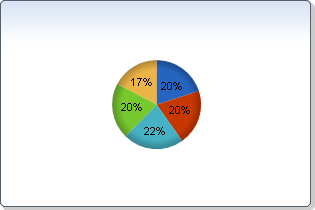
Below is a pie chart with a LabelLineBreak equal to 10 (default value):

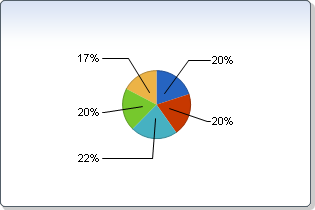
Below is a pie chart with a LabelLineBreak equal to 0. Notice that the line does not break:
Below is a pie chart with a LabelLineBreak equal to 20:
setLabelsInside(boolean),
setShowLines(boolean),
Chart.setGallery(com.softwarefx.chartfx.server.Gallery),
Chart.setGalleryAttributes(com.softwarefx.chartfx.server.IGallery),
PointAttributes.getPointLabels(),
PointLabelAttributes.setVisible(boolean),
Chart,
PointLabelAttributespublic void setLabelsInside(boolean value)
Instructs Chart FX for Java to try to paint the point labels directly on the corresponding slice of a Pie chart.
When point labels are painted outside of the Pie chart, lines will be added to improve chart readability. You can control how the lines break by using the setLabelLineBreak(int) property.
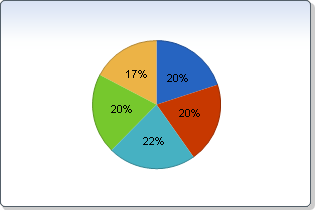
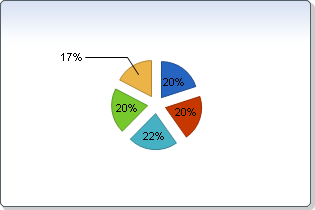
Below is a pie chart where the labels are inside. Notice that the size of the label font has been made smaller. If Chart FX for Java concludes that drawing a label inside a Pie chart will make Chart readability harder, this label will be drawn outside the chart.

Below is a pie chart where the labels are outside:
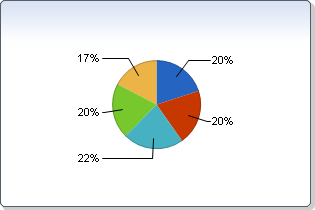
Chart.setGallery(com.softwarefx.chartfx.server.Gallery),
Chart.setGalleryAttributes(com.softwarefx.chartfx.server.IGallery),
setLabelLineBreak(int),
setShowLines(boolean),
PointAttributes.getPointLabels(),
PointLabelAttributes.setVisible(boolean),
Chart,
PointLabelAttributespublic void setMaximumLabelMargin(int value)
Sets the maximum margin (in pixels) allowed between the labels and the borders of the pie chart.
Alternatively, you can control the margins between the plot area and the border of the chart by using the Chart.getPlotAreaMargin()property of the Chart
Class
.
Below is the maximum label margin equal to 5:
Below is the maximum label margin equal to 20:
Below is the maximum label margin equal to 50:
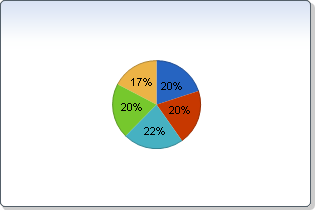
Chart.setGallery(com.softwarefx.chartfx.server.Gallery),
Chart.setGalleryAttributes(com.softwarefx.chartfx.server.IGallery),
setLabelsInside(boolean),
Chart.getPlotAreaMargin(),
Chart,
Marginspublic void setShadows(boolean value)
Adds a shadow effect to a 2D pie chart.
When the Shadows property is applied to a 2D Pie chart, the outside edges of the pie appear rounded:
The pie chart must be in 2D mode for this property to have an effect.
The default value for this propety is true.
Chart.setGallery(com.softwarefx.chartfx.server.Gallery),
Chart.setGalleryAttributes(com.softwarefx.chartfx.server.IGallery),
Chart.getView3D(),
Chart,
Attributes3Dpublic void setShowLines(boolean value)
Shows or hides lines which connect the point labels to a Pie chart.
When used in conjunction with a Pie chart, this property shows or hides the lines drawn from point labels to their corresponding pie slice. If the labels are inside the pie (i.e., setLabelsInside(boolean) = true) , this property will have no effect on the chart.
Below is a Pie chart where the lines are hidden:
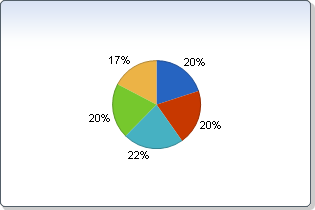
Chart.setGallery(com.softwarefx.chartfx.server.Gallery),
Chart.setGalleryAttributes(com.softwarefx.chartfx.server.IGallery),
setLabelsInside(boolean),
Chartpublic void setSliceSeparation(int value)
Sets the pie slice separation (in pixels) when using the ExplodingMode property.
Below is a Pie chart with SliceSeparation equal to 10:
Below is a Pie chart with SliceSeparation equal to 25:
setExplodingMode(com.softwarefx.chartfx.server.galleries.ExplodingMode),
Chart.setGallery(com.softwarefx.chartfx.server.Gallery),
Chart.setGalleryAttributes(com.softwarefx.chartfx.server.IGallery),
PointAttributes.setSeparateSlice(short),
Chart,
PointAttributespublic void setSquare(boolean value)
Forces Pie charts to be contained in a perfect square (no matter the window proportion).
Below is a Pie chart which does not apply the square style:
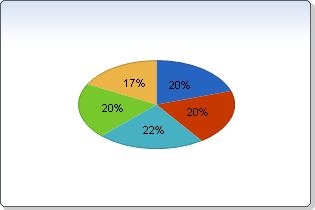
Chart.setGallery(com.softwarefx.chartfx.server.Gallery),
Chart.setGalleryAttributes(com.softwarefx.chartfx.server.IGallery),
Chartpublic void setStacked(boolean value)
Sets a Boolean value specifying whether or not to stack a pie/doughnut chart.
When set to true, a multi-series pie/doughnut chart will draw each series on top of each other (2D Only) instead of side-by-side.
For more information on how to use Stacked, please refer to the documentation of the setDoughnutThickness(int) property.
setDoughnutThickness(int),
SeriesAttributes.setStacked(boolean),
Chart.setGallery(com.softwarefx.chartfx.server.Gallery),
Chart.setGalleryAttributes(com.softwarefx.chartfx.server.IGallery),
SeriesAttributes,
Chartpublic void setStartAngle(int value)
Sets a value specifying the starting angle of the first slice in a pie chart.
This property may be configured with a value from 0 to 360.
setExplodingMode(com.softwarefx.chartfx.server.galleries.ExplodingMode),
setLabelsInside(boolean),
setShadows(boolean),
setShowLines(boolean),
setSliceSeparation(int),
setStacked(boolean)
|
http://www.softwarefx.com | |||||||
| PREV CLASS NEXT CLASS | FRAMES NO FRAMES | |||||||
| SUMMARY: NESTED | FIELD | CONSTR | METHOD | DETAIL: FIELD | CONSTR | METHOD | |||||||