 com.softwarefx.chartfx.server.PointAttributes
com.softwarefx.chartfx.server.SeriesAttributes
com.softwarefx.chartfx.server.PointAttributes
com.softwarefx.chartfx.server.SeriesAttributes
|
Chart FX 7 for Java Server | |||||||
| PREV CLASS NEXT CLASS | FRAMES NO FRAMES | |||||||
| SUMMARY: NESTED | FIELD | CONSTR | METHOD | DETAIL: FIELD | CONSTR | METHOD | |||||||
java.lang.Object
public class SeriesAttributes
Provides access to the SeriesAttributes object.
The chart series are represented by groups of data points. For example if you want to plot yearly sales for two different products. Product A and Product B are called the series of the chart. For example, if you create a bar chart, two groups of bars will appear, a group of bars will represent each product and each bar will represent actual sales for a particular month, as depicted in the following figure:
The series object allows you to set everything related to the series of the chart, including data, legends and visual attributes like colors, chart types and border styles among others.
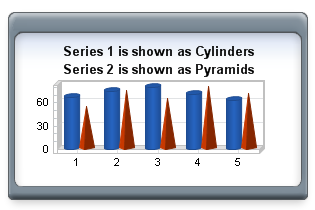
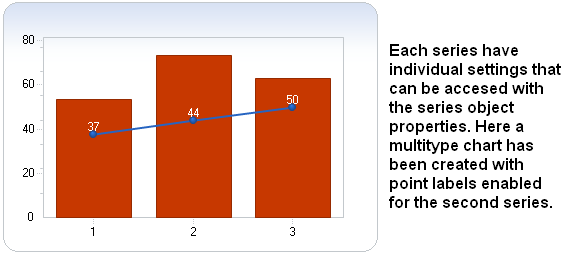
What's important about the series object is that you can use properties available in this object to set specific settings to individual series in the chart without affecting the other ones. For example, if you want to create a combination (multitype) chart, where Product A is plotted as line with data labels and Product B is displayed as bars with no borders, you can access each series properties using the series object and obtain the following chart:
| Constructor Summary | |
|---|---|
SeriesAttributes()
|
|
| Method Summary | |
|---|---|
void |
bringToFront()
Sends a SeriesAttributes to the first position in the SeriesAttributes Collection. |
void |
drawMarker(Graphics2D g,
           Point pt,
           int item,
           int radius,
           boolean drawLine)
Used to draw a marker on a selected device context. |
AxisX |
getAxisX()
Gets the AxisX. |
AxisY |
getAxisY()
Gets the AxisY. |
Color |
getColor()
Gets the Color. |
Gallery |
getGallery()
Gets the Gallery. |
Font |
getMarkerFont()
Gets the MarkerFont. |
short |
getMarkerStep()
Gets the MarkerStep. |
int |
getOriginalPosition()
Gets the OriginalPosition. |
Pane |
getPane()
Gets the Pane. |
boolean |
isStacked()
Gets the Stacked. |
boolean |
isVisible()
Gets the Visible. |
void |
sendToBack()
Sends a SeriesAttributes to the last position in the SeriesAttributes Collection. |
void |
setAxisX(AxisX value)
Sets a value indicating the AxisX the series is connected to. |
void |
setAxisY(AxisY value)
Sets a value indicating the AxisY the series is connected to. |
void |
setColor(Color value)
Sets a Color for the selected series. |
void |
setGallery(Gallery value)
Sets a gallery type for a particular series. |
void |
setMarkerFont(Font value)
Sets a wingding font for use as marker shapes. |
void |
setMarkerStep(short value)
Controls how frequently point markers are shown in the selected series. |
void |
setOriginalPosition(int value)
Returns the original position of the item in the SeriesAttributes Collection. |
void |
setPane(Pane value)
Sets the Pane which the series belongs to. |
void |
setStacked(boolean value)
Sets a value allowing you to stack the selected series with the previous series to achieve multi-stacked charts. |
void |
setVisible(boolean value)
Sets a value allowing you to show or hide the series. |
| Methods inherited from class com.softwarefx.chartfx.server.PointAttributes |
|---|
getAlternateColor, getBarShape, getBorder, getFillMode, getLine, getLink, getMarkerShape, getMarkerSize, getPattern, getPicture, getPointLabels, getSeparateSlice, getTag, getText, getVolume, setAlternateColor, setBarShape, setFillMode, setMarkerShape, setMarkerSize, setPattern, setPicture, setSeparateSlice, setTag, setText, setVolume |
| Methods inherited from class java.lang.Object |
|---|
equals, getClass, hashCode, notify, notifyAll, toString, wait, wait, wait |
| Constructor Detail |
|---|
public SeriesAttributes()
| Method Detail |
|---|
public void bringToFront()
Sends a SeriesAttributes to the first position in the SeriesAttributes Collection.
Displays the series to the front of the chart.
By utilizing the BringToFront and sendToBack() members, developers may control the order of SeriesAttributes in the chart. This property may be used to determine the original starting position for a selected SeriesAttributes object in the SeriesAttributesCollection.
The user interface controls enable end users to order series. This property is useful to determine the original position of a SeriesAttributes object when this has occured.
The setOriginalPosition(int) property returns the original position of the item in the SeriesAttributes Collection.
setOriginalPosition(int),
sendToBack()
public void drawMarker(Graphics2D g,
                       Point pt,
                       int item,
                       int radius,
                       boolean drawLine)
Used to draw a marker on a selected device context.
This method allows you to draw a markers to a selected device context without ever assigning the values to a chart.
g - A Graphics object associated with a specific device context.pt - A Point object with the desired X and Y coordinates where the marker will be drawn.item - Index of the marker item you wish to draw. (If a specific point index has been assigned special attributes you want to use, i.e. MarkerShape) Set to -1 to use default series assignments.radius - Controls the size of the markershape.drawLine - Specifies if the markers will have a line on either side of the marker. (Simulate markers in a line chart)public AxisX getAxisX()
Gets the AxisX. For more detail see setAxisX(com.softwarefx.chartfx.server.AxisX).
public AxisY getAxisY()
Gets the AxisY. For more detail see setAxisY(com.softwarefx.chartfx.server.AxisY).
public Color getColor()
Gets the Color. For more detail see setColor(java.awt.Color).
getColor in class PointAttributespublic Gallery getGallery()
Gets the Gallery. For more detail see setGallery(com.softwarefx.chartfx.server.Gallery).
public Font getMarkerFont()
Gets the MarkerFont. For more detail see setMarkerFont(java.awt.Font).
public short getMarkerStep()
Gets the MarkerStep. For more detail see setMarkerStep(short).
public int getOriginalPosition()
Gets the OriginalPosition. For more detail see setOriginalPosition(int).
public Pane getPane()
Gets the Pane. For more detail see setPane(com.softwarefx.chartfx.server.Pane).
public boolean isStacked()
Gets the Stacked. For more detail see setStacked(boolean).
public boolean isVisible()
Gets the Visible. For more detail see setVisible(boolean).
public void sendToBack()
Sends a SeriesAttributes to the last position in the SeriesAttributes Collection.
Displays the series to the back of the chart.
By utilizing the bringToFront() and SendToBack members, developers may control the order of SeriesAttributes in the chart. This property may be used to determine the original starting position for a selected SeriesAttributes object in the SeriesAttributesCollection.
The user interface controls enable end users to order series. This property is useful to determine the original position of a SeriesAttributes object when this has occured.
The setOriginalPosition(int) property returns the original position of the item in the SeriesAttributes Collection.
setOriginalPosition(int),
bringToFront()public void setAxisX(AxisX value)
Sets a value indicating the AxisX the series is connected to.
You may only assign a series to an AxisX object if the series contains XY data. The X property of the DataValues Class allows you to assign XValues in a chart.
The Chart.getAxesX() property is used to access the AxisXCollection for a chart. The AxisX property is used to assign a data series to one of the existing AxisX items in the AxisXCollection.
The setAxisY(com.softwarefx.chartfx.server.AxisY) property gets or sets a value indicating the AxisY the series is connected to.
Here is an example of a chart with a secondary X Axis. Each series is connected to a different XAxis:
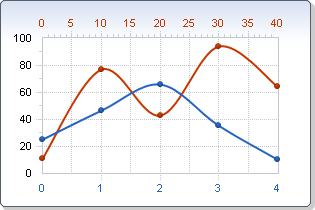
Also notice interesting options such as axis AxisSectionBase.setTextColor(java.awt.Color) to help axis affiliation.
setAxisY(com.softwarefx.chartfx.server.AxisY),
AxisSectionBase.setTextColor(java.awt.Color),
AxisY,
Axispublic void setAxisY(AxisY value)
Sets a value indicating the AxisY the series is connected to.
The Chart.getAxesY() property is used to access the AxisYCollection for a chart. The AxisY property is used to assign a data series to one of the existing AxisY items in the AxisYCollection.
The setAxisX(com.softwarefx.chartfx.server.AxisX) property gets or sets a value indicating the AxisX the series is connected to.
Here is an example of a chart with a secondary Y Axis. Each series is connected to a different YAxis:
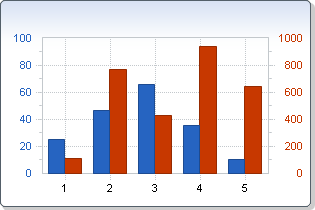
Also notice interesting options such as axis AxisSectionBase.setTextColor(java.awt.Color) to help axis affiliation.
setAxisX(com.softwarefx.chartfx.server.AxisX),
Chart.getAxesY(),
AxisSectionBase.setTextColor(java.awt.Color),
Axis,
AxisX,
Chartpublic void setColor(Color value)
Sets a Color for the selected series.
If no colors are specified, The default color is automatically selected by Chart FX for Java when you create the chart, and chosen according to the current palette and its position in the series array.
Named color are supported (e.g. Red), to use Hex notation you have to use quotes (e.g. "#FF00FF").
For more information regarding the Color type, please refer to the Java API Documentation.
setColor in class PointAttributesChart.setBackColor(java.awt.Color),
Chart.setPalette(java.lang.String),
Chartpublic void setGallery(Gallery value)
Sets a gallery type for a particular series. All chart types are available in both 2D and 3D modes.
Applying this property to a specific series will create a MultiType chart, where different Chart Types can be combined in the same chart.
You must be careful of the chart types you select to combine as not all of them will produce desirable results. For example, combining a chart that does not have numerical axis (e.g. Pie Chart) with a chart that has a numerical axis (e.g. Line Chart) will produce a chart that can't be read by the end user.
A rule of thumb is that you can combine axis charts with similar types and non-axis charts with similar types, as follows:
Axis Charts:
Lines, Bar, Curve, Scatter, Area, Step, HiLowClose, Cube, Bubble, CandleStick, CurveArea, OpenHiLowClose, Pareto.
Non-axis charts:
Pie, Radar, DoughNut, Pyramid
Note: Gantt, Surface and Contour can't be combined with other chart types
Another important issue to keep in mind when creating MultiType charts is the number of series each chart type requires to properly plot the data. For example, an Open-Hi-Lo-Close chart requires 4 consecutive series to properly plot the data, so if you want to combine this chart type with a line chart, the series containing the data for the line chart must be either the first or the last series in the data set.
Chart.setGallery(com.softwarefx.chartfx.server.Gallery),
Chart,
Bubble,
Curve,
Pie,
Radar,
Surfacepublic void setMarkerFont(Font value)
Sets a wingding font for use as marker shapes.
This property is used in conjunction with the PointAttributes.setMarkerShape(com.softwarefx.chartfx.server.MarkerShape) property. You can extend the point types available by setting the PointAttributes.setMarkerShape(com.softwarefx.chartfx.server.MarkerShape) to an integer representing the negative ASCII code from any font. By default, Chart FX uses the Wingdings font table to handle additional point types. This property allows you to select a different Wingdings font.
PointAttributes.setMarkerShape(com.softwarefx.chartfx.server.MarkerShape),
PointAttributespublic void setMarkerStep(short value)
Controls how frequently point markers are shown in the selected series.
This property is very useful when the chart contains a large number of points and the point markers disturb the chart's readability. For example, if you are showing 100 points in a line chart, the physical separation (pixels) of them is very small and probably the point markers will make the chart unreadable to the end user. In this case, you can set this property to force Chart FX for Java to show point markers every 20 points.
Point markers will not be shown in 3D line charts.
setMarkerFont(java.awt.Font),
Chartpublic void setOriginalPosition(int value)
Returns the original position of the item in the SeriesAttributes Collection.
By utilizing the bringToFront() and sendToBack() members, developers may control the order of SeriesAttributes in the chart. This property may be used to determine the original starting position for a selected SeriesAttributes object in the SeriesAttributesCollection.
The user interface controls enable end users to order series. This property is useful to determine the original position of a SeriesAttributes object when this has occured.
bringToFront(),
sendToBack()public void setPane(Pane value)
Sets the Pane which the series belongs to.
Panepublic void setStacked(boolean value)
Sets a value allowing you to stack the selected series with the previous series to achieve multi-stacked charts.
Stacked options apply only to Bar and Area charts. So before applying this property, you must make sure the previous series and the selected series are of the same type (Bar or Area).
GlobalAttributes.setStacked(com.softwarefx.chartfx.server.Stacked),
Chartpublic void setVisible(boolean value)
Sets a value allowing you to show or hide the series.
Hiding a Series will:
- not recalculate any of the scale values for the axis.
- not remove the data associated with it.
- hide the legend associated with it from the Series Legend.
- hide all the data points in the DataGrid.
Hiding a Series will:
- not recalculate any of the scale values for the axis.
- not remove the data associated with it.
- hide the legend associated with it from the Series Legend.
- hide all the data points in the Chart.getDataGrid()
If you hide a Series and want
Chart FX for Java
to recalculate the axis scale values, you must invoke the Chart.recalculateScale() method when you show and/or hide the selected Series.
You can also display hidden series in the DataEditor using the DataGrid.setShowHiddenSeries(boolean) of the DataGrid
Class
Chart.recalculateScale(),
PointAttributes
|
http://www.softwarefx.com | |||||||
| PREV CLASS NEXT CLASS | FRAMES NO FRAMES | |||||||
| SUMMARY: NESTED | FIELD | CONSTR | METHOD | DETAIL: FIELD | CONSTR | METHOD | |||||||