 com.softwarefx.chartfx.server.DockableBar
com.softwarefx.chartfx.server.DataGrid
com.softwarefx.chartfx.server.DockableBar
com.softwarefx.chartfx.server.DataGrid
|
Chart FX 7 for Java Server | |||||||
| PREV CLASS NEXT CLASS | FRAMES NO FRAMES | |||||||
| SUMMARY: NESTED | FIELD | CONSTR | METHOD | DETAIL: FIELD | CONSTR | METHOD | |||||||
java.lang.Object
public class DataGrid
Provides access to the DataGrid object, that is a component which displays the data in a tabular format.
Chart FX for Java provides a spreadsheet called DataGrid, that allows users to see the data contained in the chart in tabular format.
The DataGrid can be controlled separately from the Chart, allowing docking styles and independent Visual Attributes.

| Constructor Summary | |
|---|---|
DataGrid()
|
|
| Method Summary | |
|---|---|
Color |
getBackColorData()
Gets the BackColorData. |
Color |
getBackColorDataAlternate()
Gets the BackColorDataAlternate. |
Color |
getBackColorHeader()
Gets the BackColorHeader. |
CellAttributesCollection |
getCells()
Gets the collection of CellAttributes that belong to the DataGrid. |
ContentLayout |
getContentLayout()
Gets the ContentLayout. |
Font |
getFont()
Gets the Font. |
Color |
getHorizontalGridColor()
Gets the HorizontalGridColor. |
Interlaced |
getInterlaced()
Gets the Interlaced. |
short |
getMaxSizePercentage()
Gets the MaxSizePercentage. |
int |
getScrollPosition()
Gets the ScrollPosition. |
int |
getScrollSize()
Returns the number of scrolls in the DataEditor based on the scroll view configuration. |
Color |
getTextColorData()
Gets the TextColorData. |
Color |
getTextColorDataAlternate()
Gets the TextColorDataAlternate. |
Color |
getTextColorHeader()
Gets the TextColorHeader. |
Color |
getVerticalGridColor()
Gets the VerticalGridColor. |
boolean |
isHideXValues()
Gets the HideXValues. |
boolean |
isReadOnly()
Gets the ReadOnly. |
boolean |
isShowHeader()
Gets the ShowHeader. |
boolean |
isShowHiddenSeries()
Gets the ShowHiddenSeries. |
boolean |
isShowMarkers()
Gets the ShowMarkers. |
boolean |
isUseRawData()
Gets the UseRawData. |
boolean |
isXValuesAsHeaders()
Gets the XValuesAsHeaders. |
void |
setBackColorData(Color value)
Sets the background color of the cells on the data grid. |
void |
setBackColorDataAlternate(Color value)
Assigns the alternate color for displaying the DataGrid rows or columns. |
void |
setBackColorHeader(Color value)
Sets the background color of the header for the Data Editor. |
void |
setContentLayout(ContentLayout value)
Allows you to align the data editor in the bottom of the chart area. |
void |
setFont(Font value)
Allows you to set the font used throughout the data grid. |
void |
setHideXValues(boolean value)
Used to hide the XValues in the data editor of an XY plot chart. |
void |
setHorizontalGridColor(Color value)
Allows you to set the Horizontal color for the gridlines displayed in the data grid. |
void |
setInterlaced(Interlaced value)
Alternates the background color of on the data grid to improve readability. |
void |
setMaxSizePercentage(short value)
Allows you to specify the maximum percentage of the chart area the data grid may occupy. |
void |
setReadOnly(boolean value)
Permits values to be changed through the data grid. |
void |
setScrollPosition(int value)
Scrolls the data horizontally to the specific column in the Grid. |
void |
setShowHeader(boolean value)
Sets a value indicating the header of the columns should be visible or not. |
void |
setShowHiddenSeries(boolean value)
Sets a value indicating hidden series should be visible in data editor. |
void |
setShowMarkers(boolean value)
Sets a value indicating whether series markers should be visible in the series headers. |
void |
setTextColorData(Color value)
Sets the text color of the cells on the data grid. |
void |
setTextColorDataAlternate(Color value)
Sets the alternate text color for text in the data grid cells. |
void |
setTextColorHeader(Color value)
Sets the text color of the headers on the data editor. |
void |
setUseRawData(boolean value)
Sets a value indicating whether to use raw data or use calculated values in the DataEditor. |
void |
setVerticalGridColor(Color value)
Allows you to select the Vertical line color for the gridline displayed at the data editor box. |
void |
setXValuesAsHeaders(boolean value)
Sets a value instructing that XValues be used as the headers in the data editor. |
| Methods inherited from class com.softwarefx.chartfx.server.DockableBar |
|---|
getBackColor, getBorder, getDock, getHeight, getWidth, getZOrder, isAutoSize, isVisible, resetBackColor, setAutoSize, setBackColor, setBorder, setDock, setHeight, setVisible, setWidth, setZOrder |
| Methods inherited from class java.lang.Object |
|---|
equals, getClass, hashCode, notify, notifyAll, toString, wait, wait, wait |
| Constructor Detail |
|---|
public DataGrid()
| Method Detail |
|---|
public Color getBackColorData()
Gets the BackColorData. For more detail see setBackColorData(java.awt.Color).
public Color getBackColorDataAlternate()
Gets the BackColorDataAlternate. For more detail see setBackColorDataAlternate(java.awt.Color).
public Color getBackColorHeader()
Gets the BackColorHeader. For more detail see setBackColorHeader(java.awt.Color).
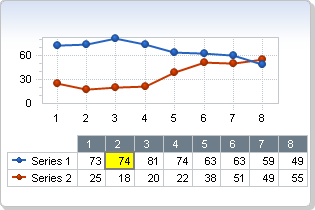
public CellAttributesCollection getCells()
Gets the collection of CellAttributes that belong to the DataGrid.
The CellAttributes
Class
allows to modify the attributes of a particular Cell or entire Row in the DataGrid.
Cell Attributtes are background, border and text colors,font styles and Border widths.
The following image shows a particular Cell in the DataGrid with a yellow background, Italic font, and a thicker border:
DockableBar.setBackColor(java.awt.Color),
CellAttributes.setBorderColor(java.awt.Color),
CellAttributes.setBorderWidth(int),
CellAttributes.setFontStyle(java.util.EnumSet) ,
CellAttributes.setTextColor(java.awt.Color),
CellAttributes,
DataGridpublic ContentLayout getContentLayout()
Gets the ContentLayout. For more detail see setContentLayout(com.softwarefx.chartfx.server.ContentLayout).
public Font getFont()
Gets the Font. For more detail see setFont(java.awt.Font).
public Color getHorizontalGridColor()
Gets the HorizontalGridColor. For more detail see setHorizontalGridColor(java.awt.Color).
public Interlaced getInterlaced()
Gets the Interlaced. For more detail see setInterlaced(com.softwarefx.chartfx.server.Interlaced).
public short getMaxSizePercentage()
Gets the MaxSizePercentage. For more detail see setMaxSizePercentage(short).
public int getScrollPosition()
Gets the ScrollPosition. For more detail see setScrollPosition(int).
public int getScrollSize()
Returns the number of scrolls in the DataEditor based on the scroll view configuration.
(Read only)
You may set the scroll position using the setScrollPosition(int) property.
The Axis object also supports the Axis.getScrollSize() property.
setScrollPosition(int),
Axis.getScrollSize(),
Axispublic Color getTextColorData()
Gets the TextColorData. For more detail see setTextColorData(java.awt.Color).
public Color getTextColorDataAlternate()
Gets the TextColorDataAlternate. For more detail see setTextColorDataAlternate(java.awt.Color).
public Color getTextColorHeader()
Gets the TextColorHeader. For more detail see setTextColorHeader(java.awt.Color).
public Color getVerticalGridColor()
Gets the VerticalGridColor. For more detail see setVerticalGridColor(java.awt.Color).
public boolean isHideXValues()
Gets the HideXValues. For more detail see setHideXValues(boolean).
public boolean isReadOnly()
Gets the ReadOnly. For more detail see setReadOnly(boolean).
public boolean isShowHeader()
Gets the ShowHeader. For more detail see setShowHeader(boolean).
public boolean isShowHiddenSeries()
Gets the ShowHiddenSeries. For more detail see setShowHiddenSeries(boolean).
public boolean isShowMarkers()
Gets the ShowMarkers. For more detail see setShowMarkers(boolean).
public boolean isUseRawData()
Gets the UseRawData. For more detail see setUseRawData(boolean).
public boolean isXValuesAsHeaders()
Gets the XValuesAsHeaders. For more detail see setXValuesAsHeaders(boolean).
public void setBackColorData(Color value)
Sets the background color of the cells on the data grid.
You need to have the data grid visible in order to see the changes made with BackColorData method. Use DockableBar.setVisible(boolean) method to enable the data grid.
For more information regarding the Color type, please refer to the Java API Documentation.
Named color are supported (e.g. Red), to use Hex notation you have to use quotes (e.g. "#FF00FF").
Below, the data grid backcolordata is set to MintCream:
setBackColorDataAlternate(java.awt.Color),
DockableBar.setBackColor(java.awt.Color),
setBackColorHeader(java.awt.Color),
setTextColorData(java.awt.Color),
setTextColorHeader(java.awt.Color),
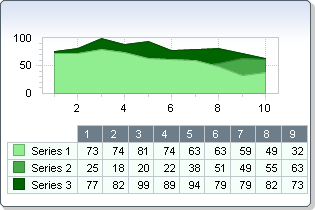
setInterlaced(com.softwarefx.chartfx.server.Interlaced)public void setBackColorDataAlternate(Color value)
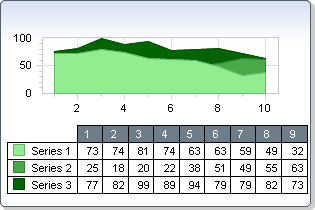
Assigns the alternate color for displaying the DataGrid rows or columns.
When viewing and interpreting DataGrids with muliple points or series, sometimes it is difficult to distinguish one row from another or one column from the other. With this property you can specify the alternating color for the DataGrid.
You should specify the direction of the alternating colors by using the setInterlaced(com.softwarefx.chartfx.server.Interlaced) property.
Named color are supported (e.g. Red), to use Hex notation you have to use quotes (e.g. "#FF00FF").
For more information regarding the Color type, please refer to the Java API Documentation.
setBackColorHeader(java.awt.Color),
DockableBar.setBackColor(java.awt.Color),
setBackColorData(java.awt.Color),
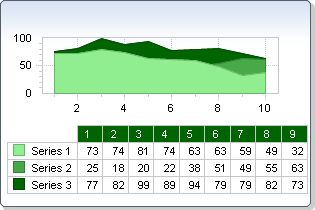
Axispublic void setBackColorHeader(Color value)
Sets the background color of the header for the Data Editor.
You need to have the data editor visible in order to see the changes made with BackColorHeader property. Use DockableBar.setVisible(boolean)method to enable the dataGrid.
You can set the dataGird background and data editor cells background with DockableBar.setBackColor(java.awt.Color) and setBackColorData(java.awt.Color) property, respectively.
For more information regarding the Color type, please refer to the Java API Documentation.
Named color are supported (e.g. Red), to use Hex notation you have to use quotes (e.g. "#FF00FF").
Below, the data grid backcolorheader is set to DarkGreen:
DockableBar.setBackColor(java.awt.Color),
setBackColorData(java.awt.Color),
setTextColorData(java.awt.Color),
setTextColorHeader(java.awt.Color),
Chart,
LegendBoxpublic void setContentLayout(ContentLayout value)
Allows you to align the data editor in the bottom of the chart area.
The DockableBar.setVisible(boolean) method needs to be true to see the effects of this property.
DockableBar.setVisible(boolean)Note, when the DataGrid is docked on the left or right:
Near = Top
Far = Bottom
DockableBar.setHeight(int),
DockableBar.setVisible(boolean),
DockableBar.setWidth(int),
DockableBar.setDock(com.softwarefx.chartfx.server.DockArea),
DockableBarpublic void setFont(Font value)
Allows you to set the font used throughout the data grid.
You can set the font for the entire chart using the Chart object Chart.setFont(java.awt.Font) property.
For more information regarding the Font type, please refer to the Java API Documentation.
Named color are supported (e.g. Red), to use Hex notation you have to use quotes (e.g. "#FF00FF").
Below, the data grid font is set to Arial 8:
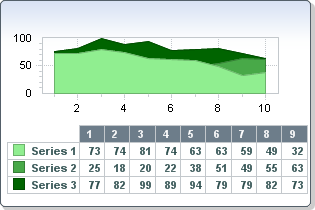
Chart.setFont(java.awt.Font),
setTextColorData(java.awt.Color),
Chartpublic void setHideXValues(boolean value)
Used to hide the XValues in the data editor of an XY plot chart.
Normally when you generate an XY plot, both the X and Y values for each series are displayed in the dataGrid. This property allows you to hide the XValues displayed by the tool.
DataValues.getY(),
DataValues.getX(),
Chart.getData(),
Chart,
DataValuespublic void setHorizontalGridColor(Color value)
Allows you to set the Horizontal color for the gridlines displayed in the data grid.
The data grid must be DockableBar.setVisible(boolean) in order to see the these changes.
You can set the Vertical line color of the data grid gridline with setVerticalGridColor(java.awt.Color) property.
For more information regarding the Color type, please refer to the Java API Documentation.
Named color are supported (e.g. Red), to use Hex notation you have to use quotes (e.g. "#FF00FF").
Below, the data grid horizontal and vertical grid color is set to Black:
setVerticalGridColor(java.awt.Color),
DockableBar.setBackColor(java.awt.Color),
setBackColorHeader(java.awt.Color),
setTextColorData(java.awt.Color),
setTextColorHeader(java.awt.Color),
DockableBar.setVisible(boolean)public void setInterlaced(Interlaced value)
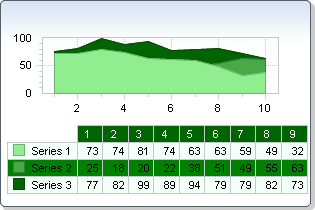
Alternates the background color of on the data grid to improve readability.
If you want to alternate the color for every series, then use Interlaced.Horizontal. For alternating the color of the points, use Interlaced.Vertical.
With only a few series and points it is easier to read without Interlaced.
Use the setBackColorData(java.awt.Color) and setBackColorDataAlternate(java.awt.Color) properties to set the colors for the Interlaced property.
Named color are supported (e.g. Red), to use Hex notation you have to use quotes (e.g. "#FF00FF").
Below, the data grid interlaced property is set to Interlaced.Horizontal:
setBackColorData(java.awt.Color),
setBackColorDataAlternate(java.awt.Color)public void setMaxSizePercentage(short value)
Allows you to specify the maximum percentage of the chart area the data grid may occupy.
This property is especially useful when developing with web applications and generating images. Because you cannot scroll the data editor when generating an image, This property allows you to specify the max size so you can make sure to view all values in the data editor.
This property may be configured with values ranging from 0 - 100. Specifying 0 will instruct Chart FX for Java to calculate the size. Specifying 100 will instruct Chart FX for Java that the whole chart may be covered by the data editor if needed.
public void setReadOnly(boolean value)
Permits values to be changed through the data grid.
To change a value, simply double click the cell you wish to change.
Chart.setAllowChanges(java.util.EnumSet) public void setScrollPosition(int value)
Scrolls the data horizontally to the specific column in the Grid.
This applies only when the data grid is docked to the Bottom or Top.
Axis.setScrollPosition(int)public void setShowHeader(boolean value)
Sets a value indicating the header of the columns should be visible or not.
The setShowMarkers(boolean) property shows or hides the series indicator displayed on the side of the dataGirid.
You may modify the color of the header using the setBackColorHeader(java.awt.Color) property.
setBackColorHeader(java.awt.Color),
setShowMarkers(boolean)public void setShowHiddenSeries(boolean value)
Sets a value indicating hidden series should be visible in data editor.
A series can be marked hidden by setting the Visible property of the SeriesAttributes Class , however you may want to still show this series in the data grid using this property.
DockableBar.setVisible(boolean),
Chart.getDataGrid()public void setShowMarkers(boolean value)
Sets a value indicating whether series markers should be visible in the series headers.
When the marker is hidden, only text is shown to label the series.
The setShowHeader(boolean)property may be used to show or hide the dataGrid header.
setShowHeader(boolean)public void setTextColorData(Color value)
Sets the text color of the cells on the data grid.
This property does not change the color of the header text, you can set the header text color of the dataGrid with setTextColorHeader(java.awt.Color) property.
Named color are supported (e.g. Red), to use Hex notation you have to use quotes (e.g. "#FF00FF").
For more information regarding the Color type, please refer to the Java API Documentation.
setBackColorData(java.awt.Color),
setBackColorDataAlternate(java.awt.Color),
setBackColorHeader(java.awt.Color),
CellAttributespublic void setTextColorDataAlternate(Color value)
Sets the alternate text color for text in the data grid cells.
This property is useful when the setInterlaced(com.softwarefx.chartfx.server.Interlaced) property is used.
The initial color of the text in the dataGrid cells can be set using the setTextColorData(java.awt.Color) property.
Named color are supported (e.g. Red), to use Hex notation you have to use quotes (e.g. "#FF00FF").
For more information regarding the Color type, please refer to the Java API Documentation.
setTextColorData(java.awt.Color),
setBackColorDataAlternate(java.awt.Color)public void setTextColorHeader(Color value)
Sets the text color of the headers on the data editor.
You need to have the dataGrid visible in order to see the changes. Use DockableBar.setVisible(boolean)property to enable the data editor.
You can set the other cells text color of the dataGird with setTextColorData(java.awt.Color) property.
You can change the color of a specific cell by using CellAttributesCellAttributes.setBackColor(java.awt.Color) property
For more information regarding the Color type, please refer to the Java API Documentation.
Named color are supported (e.g. Red), to use Hex notation you have to use quotes (e.g. "#FF00FF").
Below, the data grid header text color is set to White:
CellAttributes.setBackColor(java.awt.Color),
setBackColorHeader(java.awt.Color),
setTextColorData(java.awt.Color),
Chart,
CellAttributespublic void setUseRawData(boolean value)
Sets a value indicating whether to use raw data or use calculated values in the DataEditor.
Some gallery types, such as the BoxPlot and Histogram, manipulate data values displayed in the data grid. If you would like to actually see the data passed to the chart, you can set this property to true. This property will not affect all gallery types.
Chart.setGallery(com.softwarefx.chartfx.server.Gallery)public void setVerticalGridColor(Color value)
Allows you to select the Vertical line color for the gridline displayed at the data editor box.
You need to have the dataGrid visible in order to see the changes. Use DockableBar.setVisible(boolean)property to enable the data editor.
You can set the Horizontal line color of the data grid gridline with setHorizontalGridColor(java.awt.Color) property.
For more information regarding the Color type, please refer to the Java API Documentation.
Named color are supported (e.g. Red), to use Hex notation you have to use quotes (e.g. "#FF00FF").
Below, the data grid horizontal and vertical grid color is set to Black:
setHorizontalGridColor(java.awt.Color),
DockableBar.setBackColor(java.awt.Color),
setBackColorHeader(java.awt.Color),
setTextColorData(java.awt.Color),
setTextColorHeader(java.awt.Color),
DockableBar.setVisible(boolean)public void setXValuesAsHeaders(boolean value)
Sets a value instructing that XValues be used as the headers in the data editor.
When set to true, the XValues passed to a chart will be used for the point headers in the dataGrid.
In order for this property to affect the chart, the chart must include XValues (XY plot).
|
http://www.softwarefx.com | |||||||
| PREV CLASS NEXT CLASS | FRAMES NO FRAMES | |||||||
| SUMMARY: NESTED | FIELD | CONSTR | METHOD | DETAIL: FIELD | CONSTR | METHOD | |||||||