 com.softwarefx.chartfx.server.PointAttributes
com.softwarefx.chartfx.server.SeriesAttributes
com.softwarefx.chartfx.server.GlobalAttributes
com.softwarefx.chartfx.server.PointAttributes
com.softwarefx.chartfx.server.SeriesAttributes
com.softwarefx.chartfx.server.GlobalAttributes
|
Chart FX 7 for Java Server | |||||||
| PREV CLASS NEXT CLASS | FRAMES NO FRAMES | |||||||
| SUMMARY: NESTED | FIELD | CONSTR | METHOD | DETAIL: FIELD | CONSTR | METHOD | |||||||
java.lang.Object
public class GlobalAttributes
Provides access to the GlobalAttributes object.
The GobalAttributes
Class
allows customization of visual attributes that apply to all the SeriesAttributes and PointAttributes in a Chart.
Using the GobalAttributes members, you can set Gallery type, Colors, Marker shapes, Borders, etc.
GlobalAttibuttes are accessed through the Chart.getAllSeries() property of the Chart
Class
.
| Constructor Summary | |
|---|---|
GlobalAttributes()
|
|
| Method Summary | |
|---|---|
Color |
getAlternateColor()
Gets the AlternateColor. |
AxisX |
getAxisX()
Gets the AxisX. |
AxisY |
getAxisY()
Gets the AxisY. |
Color |
getColor()
Gets the Color. |
Gallery |
getGallery()
Gets the Gallery. |
Link |
getLink()
Gets the Link object for the chart. |
Pane |
getPane()
Gets the Pane. |
HatchStyle |
getPattern()
Gets the Pattern. |
PointLabelOrganizer |
getPointLabelOrganizer()
Gets a PointLabelOrganizer object for point label customization. |
Stacked |
getStacked()
Gets the Stacked. |
boolean |
isHorizontal()
Gets the Horizontal. |
boolean |
isMultipleColors()
Gets the MultipleColors. |
boolean |
isVisible()
Gets the Visible. |
void |
setAlternateColor(Color value)
Sets the Alternate Color for a all the Series. |
void |
setAxisX(AxisX value)
Assigns properties specifically to the primary X axis. |
void |
setAxisY(AxisY value)
Assigns properties specifically to the Y axis. |
void |
setColor(Color value)
Sets the color for all series. |
void |
setGallery(Gallery value)
Gets and sets the chart type for all Series. |
void |
setHorizontal(boolean value)
Sets a value specifying to transpose X and Y axes in a chart. |
void |
setMultipleColors(boolean value)
Gets and sets the Multiple colors to allow for independently colored data points. |
void |
setPane(Pane value)
Sets the Pane which will be used by the series by default. |
void |
setPattern(HatchStyle value)
Sets the Pattern for all the series in a chart. |
void |
setStacked(Stacked value)
Sets the Stacked style in the chart. |
void |
setVisible(boolean value)
Shows or hides all the Series. |
| Methods inherited from class com.softwarefx.chartfx.server.SeriesAttributes |
|---|
bringToFront, drawMarker, getMarkerFont, getMarkerStep, getOriginalPosition, isStacked, sendToBack, setMarkerFont, setMarkerStep, setOriginalPosition, setStacked |
| Methods inherited from class com.softwarefx.chartfx.server.PointAttributes |
|---|
getBarShape, getBorder, getFillMode, getLine, getMarkerShape, getMarkerSize, getPicture, getPointLabels, getSeparateSlice, getTag, getText, getVolume, setBarShape, setFillMode, setMarkerShape, setMarkerSize, setPicture, setSeparateSlice, setTag, setText, setVolume |
| Methods inherited from class java.lang.Object |
|---|
equals, getClass, hashCode, notify, notifyAll, toString, wait, wait, wait |
| Constructor Detail |
|---|
public GlobalAttributes()
| Method Detail |
|---|
public Color getAlternateColor()
Gets the AlternateColor. For more detail see setAlternateColor(java.awt.Color).
getAlternateColor in class PointAttributespublic AxisX getAxisX()
Gets the AxisX. For more detail see setAxisX(com.softwarefx.chartfx.server.AxisX).
getAxisX in class SeriesAttributespublic AxisY getAxisY()
Gets the AxisY. For more detail see setAxisY(com.softwarefx.chartfx.server.AxisY).
getAxisY in class SeriesAttributespublic Color getColor()
Gets the Color. For more detail see setColor(java.awt.Color).
getColor in class SeriesAttributespublic Gallery getGallery()
Gets the Gallery. For more detail see setGallery(com.softwarefx.chartfx.server.Gallery).
getGallery in class SeriesAttributespublic Link getLink()
Gets the Link object for the chart.
Developers may obtain the Linkobject for a chart using this method. Using the supported Link
Class
members, developers may configure a Link.setUrl(java.lang.String) and TargetLink.setTarget(java.lang.String) for the object.
The Chart.getAllSeries() method is used to access the GlobalAttributes object of a chart.
getLink in class PointAttributesChart.getAllSeries(),
Linkpublic Pane getPane()
Gets the Pane. For more detail see setPane(com.softwarefx.chartfx.server.Pane).
getPane in class SeriesAttributespublic HatchStyle getPattern()
Gets the Pattern. For more detail see setPattern(com.softwarefx.HatchStyle).
getPattern in class PointAttributespublic PointLabelOrganizer getPointLabelOrganizer()
Gets a PointLabelOrganizer object for point label customization.
Developers may obtain the PointLabelOrganizer object for a chart using this property. Using the supported PointLabelOrganizer
Class
members, developers may configure custom attributes for the object.
Please see the PointLabelOrganizer
Class
for more information on supported members.
The Chart.getAllSeries() property is used to access the GlobalAttributes object of a chart.
Chart.getAllSeries(),
PointLabelOrganizerpublic Stacked getStacked()
Gets the Stacked. For more detail see setStacked(com.softwarefx.chartfx.server.Stacked).
public boolean isHorizontal()
Gets the Horizontal. For more detail see setHorizontal(boolean).
public boolean isMultipleColors()
Gets the MultipleColors. For more detail see setMultipleColors(boolean).
public boolean isVisible()
Gets the Visible. For more detail see setVisible(boolean).
isVisible in class SeriesAttributespublic void setAlternateColor(Color value)
Sets the Alternate Color for a all the Series.
The AlternateColor is used in combination with the setColor(java.awt.Color) property to achieve a gradient fill effect in the Series markers. The gradient will go from the Color to the AlternateColor.
This property also requires the PointAttributes.setFillMode(com.softwarefx.chartfx.server.FillMode) property to be set to Gradient.
Named color are supported (e.g. Red), to use Hex notation you have to use quotes (e.g. "#FF00FF").
For more information regarding the Color type, please refer to the Java API Documentation.
This property applies to all series. You can then override this value by setting the same property for a specific series.
setAlternateColor in class PointAttributessetColor(java.awt.Color),
PointAttributes.setFillMode(com.softwarefx.chartfx.server.FillMode),
Chart.getAllSeries(),
PointAttributes.setAlternateColor(java.awt.Color),
SeriesAttributes,
PointAttributespublic void setAxisX(AxisX value)
Assigns properties specifically to the primary X axis.
The AxisX property allows developers to assign attributes directly to the X axis object, use the setAxisY(com.softwarefx.chartfx.server.AxisY) property for the primary Y axis.
The Axis property is used to reference axes other than the primary X and Y.
When using a predefined axis constants (e.g. 'YAxis.Secondary'), you will need to cast the data type for the constant:
chart1.getAxis((int) YAxis.SECONDARY).setVisible(true);
Grids.getMajor()Grids.getMinor()Using the Grids.getMajor() and Grids.getMinor() properties, you can customize grid line attributes using the Line
Class
members.
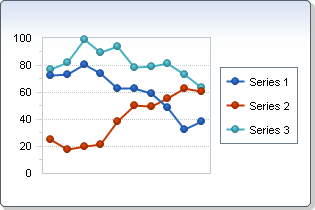
The X axis has been hidden by turning the Axis.setVisible(boolean) property to False:
setAxisX in class SeriesAttributesValueFormat.setDecimals(int),
ValueFormat.setFormat(com.softwarefx.chartfx.server.AxisFormat),
Axis,
Linepublic void setAxisY(AxisY value)
Assigns properties specifically to the Y axis.
The AxisY property allows developers to assign attributes directly to the Y axis object, use the setAxisX(com.softwarefx.chartfx.server.AxisX) property for the primary X axis.
The Axis property is used to reference axes other than the primary X and Y.
When using a predefined axis constants (e.g. 'YAxis.Secondary'), you will need to cast the data type for the constant:
chart1.getAxis((int) YAxis.SECONDARY).setVisible(true);
Using the Grids.getMajor() and Grids.getMinor() properties, you can customize grid line attributes using the Line
Class
members.
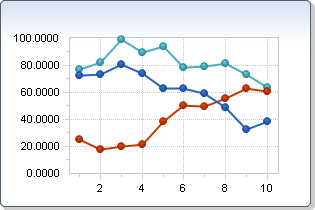
Below the Y axis has been formatted to use 4 decimals:
setAxisY in class SeriesAttributesValueFormat.setDecimals(int),
ValueFormat.setFormat(com.softwarefx.chartfx.server.AxisFormat),
Axis,
Linepublic void setColor(Color value)
Sets the color for all series.
If no colors are specified, the default color is automatically selected by Chart FX for Java when you create the chart, and chosen according to the current palette and its position in the series array.
The color property is used to set a specific color to all series. You can control colors of other chart elements using properties such as Chart.setForeColor(java.awt.Color), Chart.setBackColor(java.awt.Color) and Chart.setPlotAreaColor(java.awt.Color).
Named color are supported (e.g. Red), to use Hex notation you have to use quotes (e.g. "#FF00FF").
For more information regarding the Color type, please refer to the Java API Documentation.
This property applies to all series. You can then override this value by setting the same property for a specific series.
setColor in class SeriesAttributesChart.setBackColor(java.awt.Color),
Chart.setPlotAreaColor(java.awt.Color),
Chart.getAllSeries(),
SeriesAttributes.setColor(java.awt.Color),
Chart,
PointAttributes,
BorderAttributespublic void setGallery(Gallery value)
Gets and sets the chart type for all Series.
When you set the gallery with this property it applies to all the series in the chart. If you want to create a Multitype (or combination chart) please refer to the Series object Gallery property.
When you set the gallery with this property it applies to all the series in the chart. If you want to create a Multitype (or combination chart) please refer to the Series object SeriesAttributes.setGallery(com.softwarefx.chartfx.server.Gallery) property.
When selecting a Gallery for charts, keep in mind the number of data series which will be included in the chart. Pie, Pyramid and Doughnut chart types can only display one series per chart. If you have multiple data series, you may want to select a Gallery type that supports one that one series.
Creating a gallery object using the Chart.setGalleryAttributes(com.softwarefx.chartfx.server.IGallery) property allows you to assign additional attributes to selected gallery types.
This property applies to all series. You can then override this value by setting the same property for a specific series.
setGallery in class SeriesAttributesSeriesAttributes.setGallery(com.softwarefx.chartfx.server.Gallery),
Chart.setGalleryAttributes(com.softwarefx.chartfx.server.IGallery),
Chart.getAllSeries(),
SeriesAttributes,
Pie,
Radar,
Bubble,
Surface,
Curvepublic void setHorizontal(boolean value)
Sets a value specifying to transpose X and Y axes in a chart.
When Horizontal is True, X and Y axis objects are transposed in the chart.
By transposing the X and Y axes, the orientation of series in the chart is inverted. Therefore, vertical bars in a bar gallery chart are now horizontal, like in a Gantt gallery chart.
The Chart.getAllSeries() property is used to access the GlobalAttributes object of a chart.
Chart.getAllSeries(),
Axispublic void setMultipleColors(boolean value)
Gets and sets the Multiple colors to allow for independently colored data points.
When set to True all data points on a series will have a unique color. When set to False all the data points in the series will assume the same color.
When MultipleColors is set to True and the Chart.getLegendBox()has been set to Visible, the Legend will show the Axis X Axis.getLabels().
This property applies to all series. You can then override this value by setting the same property for a specific series.
You can assign specific colors to specific points by utilizing the PointAttributes.setColor(java.awt.Color) property of the PointAttributes
Class
.
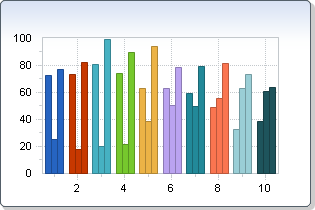
In the following image, MultipleColors has been set to True:
PointAttributes.setColor(java.awt.Color),
Chart.getLegendBox(),
Chart.getAllSeries(),
Chart,
PointAttributespublic void setPane(Pane value)
Sets the Pane which will be used by the series by default.
The Chart.getMainPane() property of the Chart
Class
is a shortcut to this property.
The MainPane property of the Chart Class is a shortcut to this property.
setPane in class SeriesAttributesChart.getMainPane()public void setPattern(HatchStyle value)
Sets the Pattern for all the series in a chart.
To use this property, you must make sure the FillMode is set to either Monochrome or Pattern.
To use this property, you must make sure the PointAttributes.setFillMode(com.softwarefx.chartfx.server.FillMode) is set to either Monochrome or Pattern.
If the FillMode is set to Pattern you can set both the background and foreground color of the pattern with the setColor(java.awt.Color) and setAlternateColor(java.awt.Color) properties, respectively.
For more information regarding the HatchStyle type, please refer to the Java API Documentation.
These are the supported styles:
Horizontal
Min
Vertical
ForwardDiagonal
BackwardDiagonal
Cross
LargeGrid
Max
DiagonalCross
Percent05
Percent10
Percent20
Percent25
Percent30
Percent40
Percent50
Percent60
Percent70
Percent75
Percent80
Percent90
LightDownwardDiagonal
LightUpwardDiagonal
DarkDownwardDiagonal
DarkUpwardDiagonal
WideDownwardDiagonal
WideUpwardDiagonal
LightVertical
LightHorizontal
NarrowVertical
NarrowHorizontal
DarkVertical
DarkHorizontal
DashedDownwardDiagonal
DashedUpwardDiagonal
DashedHorizontal
DashedVertical
SmallConfetti
LargeConfetti
ZigZag
Wave
DiagonalBrick
HorizontalBrick
Weave
Plaid
Divot
DottedGrid
DottedDiamond
Shingle
Trellis
Sphere
SmallGrid
SmallCheckerBoard
LargeCheckerBoard
OutlinedDiamond
SolidDiamond
This property applies to all series. You can then override this value by setting the same property for a specific series.
setPattern in class PointAttributesPointAttributes.setFillMode(com.softwarefx.chartfx.server.FillMode),
setColor(java.awt.Color),
setAlternateColor(java.awt.Color),
Chart.getAllSeries(),
SeriesAttributes,
Chartpublic void setStacked(Stacked value)
Sets the Stacked style in the chart.
This property applies to BAR or AREA charts only.
This property applies the stacked style to all series in the chart.
Chart FX for Java
also support multistacked charts where you can stack series by pairs. For more information, please refer to the SeriesAttributes.setStacked(boolean) property in the series object.
This property applies the stacked style to all series in the chart. Chart FX for Java also support multistacked charts where you can stack series by pairs. For more information, please refer to the Stacked parameter in the Series object.
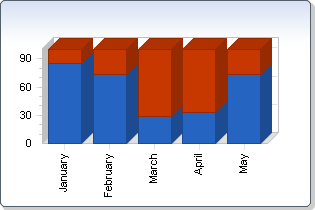
Below is a chart using the Stacked100 enumeration to stack the chart:
SeriesAttributes.setStacked(boolean),
Chart.getAllSeries(),
SeriesAttributes,
Chartpublic void setVisible(boolean value)
Shows or hides all the Series.
Hiding the all Series does not destroy or lose previous settings assigned by other properties.
setVisible in class SeriesAttributesChart.recalculateScale(),
PointAttributes
|
http://www.softwarefx.com | |||||||
| PREV CLASS NEXT CLASS | FRAMES NO FRAMES | |||||||
| SUMMARY: NESTED | FIELD | CONSTR | METHOD | DETAIL: FIELD | CONSTR | METHOD | |||||||