 com.softwarefx.chartfx.server.galleries.Surface
|
Chart FX 7 for Java Server | |||||||
| PREV CLASS NEXT CLASS | FRAMES NO FRAMES | |||||||
| SUMMARY: NESTED | FIELD | CONSTR | METHOD | DETAIL: FIELD | CONSTR | METHOD | |||||||
java.lang.Object
public class Surface
Provides access to the Surface and Contour gallery object.
The properties of the Surface
Class
allow you to customize the visual attributes of a Surface or Contour chart. In order to make the supported members available, you must first set the gallery of the chart to Surface or Contour, and cast the Chart.setGalleryAttributes(com.softwarefx.chartfx.server.IGallery) property of the Chart to the Surface
Class
:
Surface surface = (Surface) chart1.getGalleryAttributes();
The cast will fail if the gallery is not set to Surface or Contour.
Once you have done this, using the newly created object you can assign these special attributes for the Surface or Contour gallery type in your chart.
The Surface plot is usually displayed in a 3D representation. The number of points determines the width of the chart while the number of series determines the depth of the chart. You can enable the 3D view using the Attributes3D.setEnabled(boolean) property of the Attributes3D
Class
:
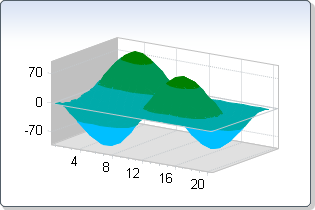
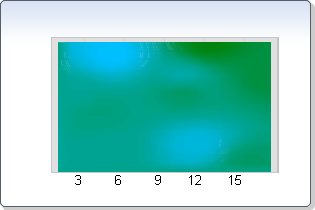
The Contour gallery offers a between alternative to a Surface graph when the chart should be rendered in 2D. The Surface Class also allows changing the specific properties of the Contour gallery. Notice that the tool bar item related to the 3D view are disabled when the gallery type is switched to Contour:
| Constructor Summary | |
|---|---|
Surface()
|
|
| Method Summary | |
|---|---|
Color[] |
getColors()
Gets the Colors. |
double |
getStep()
Gets the Step. |
boolean |
isShowContourLines()
Gets the ShowContourLines. |
boolean |
isShowGridLines()
Gets the ShowGridLines. |
void |
setColors(Color[] value)
Sets a collection of colors to be used for the colors of the surface plot. |
void |
setShowContourLines(boolean value)
Shows or hides the contour lines for Contour charts. |
void |
setShowGridLines(boolean value)
Shows or hides the Grid lines of surface charts in the chart area. |
void |
setStep(double value)
Setsthe Step for a Surface chart. |
| Methods inherited from class java.lang.Object |
|---|
equals, getClass, hashCode, notify, notifyAll, toString, wait, wait, wait |
| Constructor Detail |
|---|
public Surface()
| Method Detail |
|---|
public Color[] getColors()
Gets the Colors. For more detail see setColors(java.awt.Color[]).
public double getStep()
Gets the Step. For more detail see setStep(double).
public boolean isShowContourLines()
Gets the ShowContourLines. For more detail see setShowContourLines(boolean).
public boolean isShowGridLines()
Gets the ShowGridLines. For more detail see setShowGridLines(boolean).
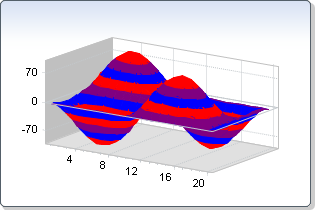
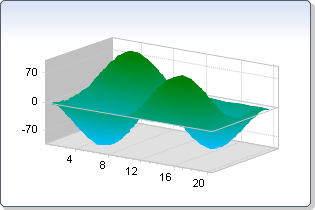
public void setColors(Color[] value)
Sets a collection of colors to be used for the colors of the surface plot.
Colors can be assigned to a collection of colors to be used for the colors of the surface levels FROM BOTTOM TO TOP.
The color collection is used as a circular collection, meaning that if it is too small, the color will cycle back to the first color. A Empty entry, means to use the palette color for the series corresponding to this position.
When not set (or set to null), the default behavior remains the same, a color gradient is used.
Below, the color collection made up of red, blue and purple is assigned to the Surface chart:
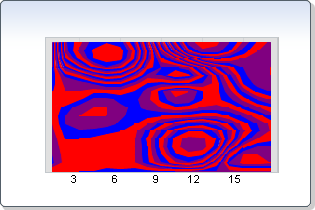
Similarly, this is the result when the gallery type os switched to Contour:
GlobalAttributes.setGallery(com.softwarefx.chartfx.server.Gallery),
SeriesAttributes.setGallery(com.softwarefx.chartfx.server.Gallery),
Chart,
SeriesAttributes,
GlobalAttributespublic void setShowContourLines(boolean value)
Shows or hides the contour lines for Contour charts.
This property works only in Contour-type charts. Setting this property in Surface charts causes no change.
Below is a Contour chart with Contour Charts enabled:
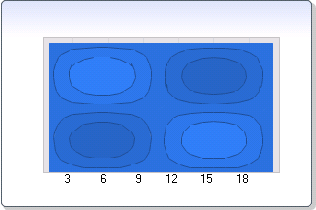
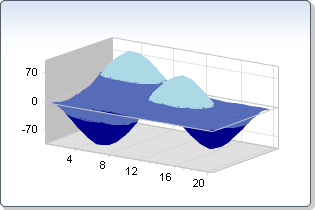
public void setShowGridLines(boolean value)
Shows or hides the Grid lines of surface charts in the chart area.
When the surface plot is set to one color, it can be difficult to see the variation in the chart. Setting the ShowGridLines property allows you to see the changes in the surface chart easily.
You can change the color of the grid lines using the BorderAttributes.setColor(java.awt.Color) and the BorderAttributes.setEffect(com.softwarefx.chartfx.server.BorderEffect)Chart.setBorder(com.softwarefx.chartfx.server.adornments.IBorderAdornment) properties of the BorderAttributes
Class
. The Effect method must be set to none for the BorderAttributes.setColor(java.awt.Color) property to take effect.
Below is a Surface chart which renders the Grid lines:
Similarly, this is the result when the gallery type is switched to Contour:
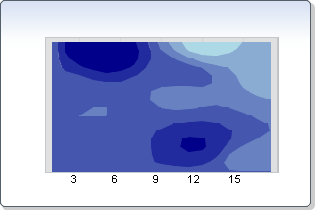
Chart.setGallery(com.softwarefx.chartfx.server.Gallery),
Chart.setGalleryAttributes(com.softwarefx.chartfx.server.IGallery),
BorderAttributes.setColor(java.awt.Color),
BorderAttributes.setEffect(com.softwarefx.chartfx.server.BorderEffect),
BorderAttributes.setVisible(boolean),
PointAttributes.getBorder(),
Chart,
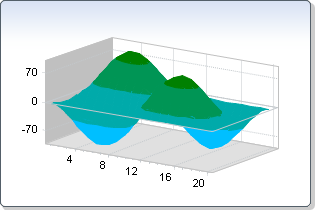
BorderAttributespublic void setStep(double value)
Setsthe Step for a Surface chart. The lower the Step, the smother the surface.
You can set a Step for the Surface wich is different to the Chart's Axis.setStep(double) to affect the colors without affecting the chart's labels.
Below is a surface chart with the Step property equal to 5:
Below is a surface chart with the Step property equal to 20:

Below is a surface chart with the Step property equal to 60:
setColors(java.awt.Color[]),
GlobalAttributes.setGallery(com.softwarefx.chartfx.server.Gallery),
Chart.setGalleryAttributes(com.softwarefx.chartfx.server.IGallery),
Axis.setStep(double),
Chart,
SeriesAttributes,
GlobalAttributes
|
http://www.softwarefx.com | |||||||
| PREV CLASS NEXT CLASS | FRAMES NO FRAMES | |||||||
| SUMMARY: NESTED | FIELD | CONSTR | METHOD | DETAIL: FIELD | CONSTR | METHOD | |||||||