 com.softwarefx.chartfx.desktop.Line
com.softwarefx.chartfx.desktop.CustomGridLine
com.softwarefx.chartfx.desktop.Line
com.softwarefx.chartfx.desktop.CustomGridLine
|
Chart FX 7 for Java Desktop | |||||||
| PREV CLASS NEXT CLASS | FRAMES NO FRAMES | |||||||
| SUMMARY: NESTED | FIELD | CONSTR | METHOD | DETAIL: FIELD | CONSTR | METHOD | |||||||
java.lang.Object
public class CustomGridLine
Provides access to the CustomGridLine object.
CustomGridLines are one of the most useful objects when it comes to highlighting information in the chart area. You may want to create a Line to highlight limits or specific points of interest in the chart. For example, in a scientific application, you may want to use the CustomGridLine Class to highlight an alarm limit, or in a financial application, you may want to use the CustomGridLine to highlight a target price or date.
CustomGridLines are lines that you can draw anywhere in the chart area and they associate themselves with a particular value in the Axis that they're assigned to, as illustrated in the following figure:
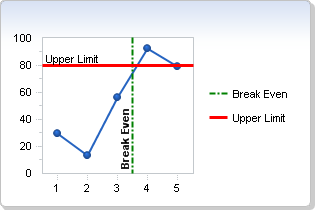
You can create as many CustomGridLine objects as you need, and you can also configure labels, line width, styles, colors, etc.
If you want to highlight a range of values instead of a specific value, please refer to the AxisSection
Class
.
| Constructor Summary | |
|---|---|
CustomGridLine()
|
|
CustomGridLine(double value,
               String text)
|
|
| Method Summary | |
|---|---|
com.softwarefx.StringAlignment |
getAlignment()
Gets the Alignment. |
EnumSet<CustomGridLineStyles> |
getExtraStyle()
Gets the ExtraStyle. |
Font |
getFont()
Gets the Font. |
com.softwarefx.StringAlignment |
getLineAlignment()
Gets the LineAlignment. |
String |
getText()
Gets the Text. |
Color |
getTextColor()
Gets the TextColor. |
double |
getValue()
Gets the Value. |
boolean |
isOutsideText()
Gets the OutsideText. |
boolean |
isShowLine()
Gets the ShowLine. |
boolean |
isShowText()
Gets the ShowText. |
void |
setAlignment(com.softwarefx.StringAlignment value)
Sets the Alignment for the Label in a CustomGridLine. |
void |
setExtraStyle(EnumSet<CustomGridLineStyles> value)
Allows you to set additional visual attributes in a custom grid line. |
void |
setFont(Font value)
Sets the Font utilized for the Label within the CustomGridLine. |
void |
setLineAlignment(com.softwarefx.StringAlignment value)
Sets the alignment for the Text line relative to the CustomeGridLine. |
void |
setOutsideText(boolean value)
Setsthe OutsideText which controls the positioning of the CustomGridLine label outside the chart area. |
void |
setShowLine(boolean value)
Setsthe ShowLine, which shows or hides the CustomGridLine line. |
void |
setShowText(boolean value)
Setsthe Showtext, which shows or hides the CustomGridLine text. |
void |
setText(String value)
Sets the Text for a label in a CustomGridLine. |
void |
setTextColor(Color value)
Sets the Text Colot for a label in a CustomGridLine. |
void |
setValue(double value)
Sets the Value for a CustomGridLine. |
| Methods inherited from class com.softwarefx.chartfx.desktop.Line |
|---|
getColor, getEndCap, getStartCap, getStyle, getWidth, setColor, setEndCap, setStartCap, setStyle, setWidth |
| Methods inherited from class java.lang.Object |
|---|
equals, getClass, hashCode, notify, notifyAll, toString, wait, wait, wait |
| Constructor Detail |
|---|
public CustomGridLine()
public CustomGridLine(double value,
                      String text)
| Method Detail |
|---|
public com.softwarefx.StringAlignment getAlignment()
Gets the Alignment. For more detail see setAlignment(com.softwarefx.StringAlignment).
public EnumSet<CustomGridLineStyles> getExtraStyle()
Gets the ExtraStyle. For more detail see setExtraStyle(java.util.EnumSet.
public Font getFont()
Gets the Font. For more detail see setFont(java.awt.Font).
public com.softwarefx.StringAlignment getLineAlignment()
Gets the LineAlignment. For more detail see setLineAlignment(com.softwarefx.StringAlignment).
public String getText()
Gets the Text. For more detail see setText(java.lang.String).
public Color getTextColor()
Gets the TextColor. For more detail see setTextColor(java.awt.Color).
public double getValue()
Gets the Value. For more detail see setValue(double).
public boolean isOutsideText()
Gets the OutsideText. For more detail see setOutsideText(boolean).
public boolean isShowLine()
Gets the ShowLine. For more detail see setShowLine(boolean).
public boolean isShowText()
Gets the ShowText. For more detail see setShowText(boolean).
public void setAlignment(com.softwarefx.StringAlignment value)
Sets the Alignment for the Label in a CustomGridLine.
The Alignment will position the CustomGridLine Label in the desired location.
The possible values are Center, Far, Near.
This property will also take effect, if set to Far or Near, when the setOutsideText(boolean) property is set to true.
For more information on StringAlignment see the Java API documentation.
In the following sample, the CustomGridLine Alignment is set to StringAligment.Far:
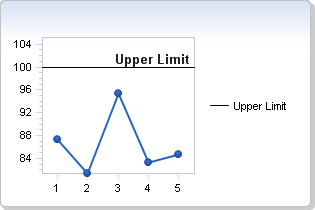
setText(java.lang.String),
setOutsideText(boolean),
Axis,
AxisX,
AxisYpublic void setExtraStyle(EnumSet<CustomGridLineStyles> value)
Allows you to set additional visual attributes in a custom grid line.
This property is set using the bitwise operators (And, Or, Not, Xor) provided by your Java API .
Chart.setExtraStyle(java.util.EnumSet) public void setFont(Font value)
Sets the Font utilized for the Label within the CustomGridLine.
When setting a font for a CustomGridLine label, you must create a new font object with the desired attributes and assign that object to the desired chart element every time you want to change the font.
For more information regarding the Font type, please refer to the Java API Documentation.
Fonts can be specified by using the standard string notation for fully or partially qualifying a font object. For example, "Verdana,12,style=Italic,Bold" produces a font of type Verdana, point size of 12 and font style of Italic and Bold.
You can set the font for the entire chart using the Chart
Class
JComponent.setFont(java.awt.Font) property.
setText(java.lang.String),
JComponent.setFont(java.awt.Font),
Axis,
AxisX,
AxisYpublic void setLineAlignment(com.softwarefx.StringAlignment value)
Sets the alignment for the Text line relative to the CustomeGridLine.
The LineAlignment will position the Text label line in the desired location.
The possible values are Center, Far, Near.
This property will also take effect when the setOutsideText(boolean) property is set to true.
For more information on StringAlignment see the Java API documentation.
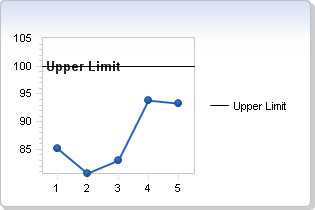
In the following sample, the CustomGridLine Alignment is set to StringAligment.Center:
setText(java.lang.String),
setOutsideText(boolean),
Axis,
AxisX,
AxisYpublic void setOutsideText(boolean value)
Setsthe OutsideText which controls the positioning of the CustomGridLine label outside the chart area.
When this property is set to True, the text associated with the CustomGridLine is placed outside the charting area.
setAlignment(com.softwarefx.StringAlignment) and setLineAlignment(com.softwarefx.StringAlignment) settings will still apply when this proprty is set to true.
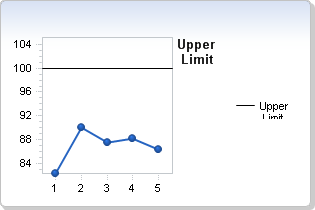
In the following chart, the constant line text is set as OutsideText:
setText(java.lang.String),
setAlignment(com.softwarefx.StringAlignment),
setLineAlignment(com.softwarefx.StringAlignment),
Axis,
AxisX,
AxisYpublic void setShowLine(boolean value)
Setsthe ShowLine, which shows or hides the CustomGridLine line.
When you hide a CustomGridLine line using this property, any text associated with the line will remain in the chart. Use the setShowText(boolean) property to show or hide the CustomGridLine text.
setShowText(boolean),
Axis,
AxisX,
AxisYpublic void setShowText(boolean value)
Setsthe Showtext, which shows or hides the CustomGridLine text.
When you hide a CustomGridLine test using this property, any Line associated will remain in the chart. Use the setShowLine(boolean) property to show or hide the CustomGridLine line.
setShowLine(boolean),
setText(java.lang.String),
Axis,
AxisX,
AxisYpublic void setText(String value)
Sets the Text for a label in a CustomGridLine.
The CustomGridLine's Text can be set using this property, or by specifying it when creating the CustomGridLine:
CustomGridLine c1 = new CustomGridLine(100, "Upper Limit");
When a CustomGridLine is associated with any of the Y axes, the default text alignment is Near (Left). On the other hand, if the label is associated with the X axis the default text alignment is Near (bottom). You can modify the text alignment with the setAlignment(com.softwarefx.StringAlignment) property.
To change the font for the text label in a CustomGridLine, use the setFont(java.awt.Font) property.
To change the text color, use the setTextColor(java.awt.Color) property.
setShowText(boolean),
setLineAlignment(com.softwarefx.StringAlignment),
setTextColor(java.awt.Color),
Axis,
AxisX,
AxisYpublic void setTextColor(Color value)
Sets the Text Colot for a label in a CustomGridLine.
The TextColor property is used to set a color for the text of a specified CustomGridLine.
Named colors are supported (e.g. Red); to use Hex notation you have to use quotes (e.g. "#FF00FF").
For more information regarding the Color type, please refer to the Java API .
setText(java.lang.String),
Axis,
AxisX,
AxisYpublic void setValue(double value)
Sets the Value for a CustomGridLine.
The value of the CustomGridLine goes in strict relationship with the Axis scale that is related to, as follows:
- If the CustomGridLine is associated with a numerical axis, the value of the constant is a double according to the scale values set for that particular axis. Please note that a CustomGridLine may be associated to the X axis in an XY Plot where the X axis is a numerical axis with specific scale values.
- If the CustomGridLine is associated with a categorical axis (X axis in charts other than XY Plots), the value is an integer specifying the point index you want to associate the CustomGridLine to; in this case, the CustomGridLine will be drawn starting at the Major tick mark for the selected point.
Please note that if you set a CustomGridLine out of the range of the visible axis scale values,
Chart FX for Java
will not recalculate the scale and you must set the Axis.setMin(double) or Axis.setMax(double) accordingly so the custom line can be seen.
For example, if you set a value of 1000 for a CustomGridLine in the Y axis, while the Y axis scale is from 0 to 500; then the custom line will not be visible and you will have to set a new maximum value using the Axis.setMax(double) property of the axis that the custom line is attached to in order to see it on the chart.
The CustomGridLine's Value can be set using this property, or by specifying it when creating the CustomGridLine:
CustomGridLine c1 = new CustomGridLine(100, "Upper Limit");
Axis,
AxisX,
AxisY
|
http://www.softwarefx.com | |||||||
| PREV CLASS NEXT CLASS | FRAMES NO FRAMES | |||||||
| SUMMARY: NESTED | FIELD | CONSTR | METHOD | DETAIL: FIELD | CONSTR | METHOD | |||||||