 SoftwareFX.ChartFX.PointAttributes
SoftwareFX.ChartFX.SeriesAttributes
SoftwareFX.ChartFX.PointAttributes
SoftwareFX.ChartFX.SeriesAttributes
|
Chart FX for Java 6.5 | |||||||
| PREV CLASS NEXT CLASS | FRAMES NO FRAMES | |||||||
| SUMMARY: NESTED | FIELD | CONSTR | METHOD | DETAIL: FIELD | CONSTR | METHOD | |||||||
java.lang.Object
public final class SeriesAttributes
Provides access to the SeriesAttributes object.
The chart series are represented by groups of data points. For example if you want to plot yearly sales for two different products. Product A and Product B are called the series of the chart. For example, if you create a bar chart, two groups of bars will appear, a group of bars will represent each product and each bar will represent actual sales for a particular month, as depicted in the following figure:
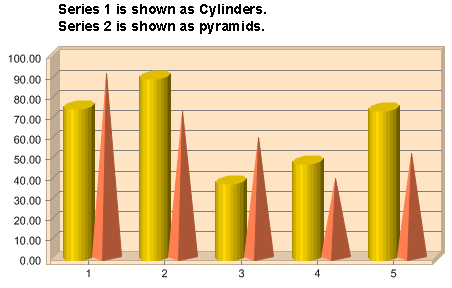
The series object allows you to set everything related to the series of the chart, including data, legends and visual attributes like colors, chart types and border styles among others.
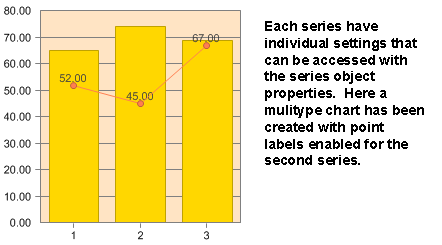
What's important about the series object is that you can use properties available in this object to set specific settings to individual series in the chart without affecting the other ones. For example, if you want to create a combination (multitype) chart, where Product A is plotted as line with data labels and Product B is displayed as bars with no borders, you can access each series properties using the series object and obtain the following chart:
| Constructor Summary | |
|---|---|
SeriesAttributes()
|
|
SeriesAttributes(Chart chart,
                 int index)
|
|
| Method Summary | |
|---|---|
void |
drawMarker(java.awt.Graphics2D g,
           java.awt.Point pt,
           int item,
           int radius,
           boolean drawLine)
Used to draw a marker on a selected device context. |
void |
DrawMarker(java.awt.Graphics2D g,
           java.awt.Point pt,
           int item,
           int radius,
           boolean drawLine)
Deprecated. You should use drawMarker(java.awt.Graphics2D, java.awt.Point, int, int, boolean) instead. |
java.awt.Color |
getColor()
Gets the Color. |
int |
getGallery()
Gets the Gallery. |
java.lang.String |
getLegend()
Gets the Legend. |
short |
getMarkerStep()
Gets the MarkerStep. |
int |
getSmoothFlags()
Gets the SmoothFlags. |
int |
getYAxis()
Gets the YAxis. |
boolean |
isStacked()
Gets the Stacked. |
boolean |
isVisible()
Gets the Visible. |
void |
setColor(java.awt.Color value)
Sets a color for the selected series. |
void |
setGallery(int value)
Sets the chart type for a particular series. |
void |
setLegend(java.lang.String value)
Allows you to set a legend (categorical Axis labels) for the selected series. |
void |
setMarkerStep(short value)
Controls how frequently point markers are shown in the selected series. |
void |
setSmoothFlags(int value)
Sets the rendering quality for the selected series and text related to this series. |
void |
setStacked(boolean value)
Allows you to stack the selected series with the previous series to achieve multi-stacked charts. |
void |
setVisible(boolean value)
Shows or hides the selected series. |
void |
setYAxis(int value)
Allows you to move (or assign) the selected data series to a different numerical axis. |
| Methods inherited from class java.lang.Object |
|---|
equals, getClass, hashCode, notify, notifyAll, toString, wait, wait, wait |
| Constructor Detail |
|---|
public SeriesAttributes()
public SeriesAttributes(Chart chart,
                        int index)
| Method Detail |
|---|
public void drawMarker(java.awt.Graphics2D g,
                       java.awt.Point pt,
                       int item,
                       int radius,
                       boolean drawLine)
Used to draw a marker on a selected device context.
This method allows you to draw a markers to a selected device context without ever assigning the values to a chart.
g - A Graphics object is associated with a specific device context.pt - A Point object with the desired X and Y coordinates where the marker will be drawn.item - Index of the marker item you wish to draw. (If a specific point index has been assigned special attributes you want to use, i.e. MarkerShape) Set to -1 to use default series assignments.radius - Controls the size of the markershape.drawLine - Specifies if the markers will have a line on either side of the marker. (Simulate markers in a line chart)DefaultBorder.draw(java.awt.Graphics2D, java.awt.Rectangle, java.awt.Color),
ImageBorder.draw(java.awt.Graphics2D, java.awt.Rectangle, java.awt.Color),
GradientBackground.draw(java.awt.Graphics2D, java.awt.Rectangle, java.awt.Color),
DefaultBorder,
ImageBorder,
GradientBackground
public void DrawMarker(java.awt.Graphics2D g,
                       java.awt.Point pt,
                       int item,
                       int radius,
                       boolean drawLine)
drawMarker(java.awt.Graphics2D, java.awt.Point, int, int, boolean) instead.
public java.awt.Color getColor()
Gets the Color. For more detail see setColor(java.awt.Color).
getColor in class PointAttributespublic int getGallery()
Gets the Gallery. For more detail see setGallery(int).
public java.lang.String getLegend()
Gets the Legend. For more detail see setLegend(java.lang.String).
public short getMarkerStep()
Gets the MarkerStep. For more detail see setMarkerStep(short).
public int getSmoothFlags()
Gets the SmoothFlags. For more detail see setSmoothFlags(int).
public int getYAxis()
Gets the YAxis. For more detail see setYAxis(int).
public boolean isStacked()
Gets the Stacked. For more detail see setStacked(boolean).
public boolean isVisible()
Gets the Visible. For more detail see setVisible(boolean).
public void setColor(java.awt.Color value)
Sets a color for the selected series.
If no colors are specified, The default color is automatically selected by Chart FX when you create the chart, and chosen according to the current palette and its position in the series array.
The color property is used to set a specific color to the selected series. You can control colors of other chart elements using the PointAttributes.setBorderColor(java.awt.Color), ChartCore.setBackColor(java.awt.Color) and ChartCore.setInsideColor(java.awt.Color) properties.
For more information regarding the Color type, please refer to the Java API Documentation.
setColor in class PointAttributesChartCore.setBackColor(java.awt.Color),
PointAttributes.setBorderColor(java.awt.Color),
ChartCore.setInsideColor(java.awt.Color),
Chart,
PointAttributespublic void setGallery(int value)
Sets the chart type for a particular series. All chart types are available in both 2D and 3D modes.
Gallery : Defines the chart type.| Value | Description |
|---|---|
Gallery.LINES | Line Chart. |
Gallery.BAR | Bar Chart. |
Gallery.CURVE | Spline Curve chart. |
Gallery.SCATTER | Scatter or XY Plot. |
Gallery.PIE | Pie Chart. |
Gallery.AREA | Area Chart. |
Gallery.PARETO | Pareto Chart. |
Gallery.STEP | Step Lines Chart |
Gallery.HI_LOW_CLOSE | Hi-Low-Close Chart. |
Gallery.SURFACE | Surface Plot. |
Gallery.RADAR | Radar Chart. |
Gallery.CUBE | Cubes Chart. |
Gallery.DOUGHNUT | Doughnut Chart. |
Gallery.PYRAMID | Pyramid Chart. |
Gallery.BUBBLE | Bubble Chart. |
Gallery.OPEN_HI_LOW_CLOSE | Open-Hi-Lo-Close Chart. |
Gallery.CANDLESTICK | CandleStick Chart. |
Gallery.CONTOUR | Contour Chart. |
Gallery.CURVE_AREA | Curve Area Chart. |
Gallery.GANTT | Horizontal Bar Chart. |
Applying this property to a specific series will create a MultiType chart, where different Chart Types can be combined in the same chart. For example, if you initially created a bar chart with 3 series, you can convert the first series to a line chart as follows:
chart1.getSeries(0).setGallery(Gallery.LINES);
You must be careful of the chart types you select to combine as not all of them will produce desirable results. For example, combining a chart that does not have numerical axis (e.g. Pie Chart) with a chart that has a numerical axis (e.g. Line Chart) will produce a chart that can't be read by the end user.
A rule of thumb is that you can combine axis charts with similar types and non-axis charts with similar types, as follows:
Axis Charts:
Lines, Bar, Curve, Scatter, Area, Step, HiLowClose, Cube, Bubble, CandleStick, CurveArea, OpenHiLowClose, Pareto.
Non-axis charts:
Pie, Radar, DoughNut, Pyramid
Note: Gantt, Surface and Contour can't be combined with other chart types
Another important issue to keep in mind when creating MultiType charts is the number of series each chart type requires to properly plot the data. For example, an Open-Hi-Lo-Close chart requires 4 consecutive series to properly plot the data, so if you want to combine this chart type with a line chart, the series containing the data for the line chart must be either the first or the last series in the data set.
ChartCore.setGallery(int),
Chartpublic void setLegend(java.lang.String value)
Allows you to set a legend (categorical Axis labels) for the selected series.
Once you have set the series legend in the chart, you can treat the legend window as an additional tool with different properties that can be accessed using the ChartCore.getSerLegBoxObj() property.
Use the ChartCore.setSerLegBox(boolean) property to make the series legend box visible.
You can also use the ChartCore.getSerLeg(int) property to define names for your series.
ChartCore.getSerLeg(int),
ChartCore.setSerLegBox(boolean),
ChartCore.getSerLegBoxObj(),
LegendBox,
Chartpublic void setMarkerStep(short value)
Controls how frequently point markers are shown in the selected series.
This property is very useful when the chart contains a large number of points and the point markers disturb the chart's readability. For example, if you are showing 100 points in a line chart, the physical separation (pixels) of them is very small and probably the point markers will make the chart unreadable to the end user. In this case, you can set this property to force Chart FX to show point markers every 20 points.
Point markers will not be shown in 3D line charts.
You must make sure the PointAttributes.setMarkerShape(int) Property is set to a valid point type (other than None), before setting this property.
You can control the shape and Size of the point markers with the PointAttributes.setMarkerShape(int) property and PointAttributes.setMarkerSize(short) properties, respectively.
You can extend the point types available by setting this property to an integer representing the negative ASCII code from any font. By default, Chart FX uses the WingDings font table to handle additional point types. For changing the default font, use the ChartCore.setPointFont(java.awt.Font) property.
PointAttributes.setMarkerSize(short),
PointAttributes.setMarkerShape(int),
ChartCore.setPointFont(java.awt.Font),
Chartpublic void setSmoothFlags(int value)
Sets the rendering quality for the selected series and text related to this series.
SmoothFlags : Sets the rendering quality| Value | Description |
|---|---|
SmoothFlags.FILL | Specifies antialiased rendering inside of the chart. |
SmoothFlags.BORDER | Specifies antialiased rendering on chart borders. |
SmoothFlags.TEXT | Specifies that each character is antialiased rendering. |
SmoothFlags.NONE | Specifies no antialiasing. |
SmoothFlags.TEXT_SYSTEM | Specifies to use the system settings. |
To change the chart rendering quality use directly the chart ChartCore.setSmoothFlags(int) property.
ChartCore.setSmoothFlags(int),
Chartpublic void setStacked(boolean value)
Allows you to stack the selected series with the previous series to achieve multi-stacked charts.
Stacked options apply only to Bar and Area charts. So before applying this property, you must make sure the previous series and the selected series are of the same type (Bar or Area).
You can also use the ChartCore.setStacked(int) property of the Chart object to assign the attribute to all series.
ChartCore.setStacked(int),
Chartpublic void setVisible(boolean value)
Shows or hides the selected series.
Hiding an Series will:
- not recalculate any of the scale values for the axis.
- not remove the data associated with it.
- hide the legend associated with it from the Series Legend.
- hide all the data points in the Data Editor.
If you hide a Series and want Chart FX to recalculate the axis scale values, you must invoke the ChartCore.recalcScale() method when you show and/or hide the selected Series.
ChartCore.recalcScale(),
PointAttributespublic void setYAxis(int value)
Allows you to move (or assign) the selected data series to a different numerical axis.
YAxis : Defines the main or secondary Y Axis when assigning series to a selected Y axis.| Value | Description |
|---|---|
YAxis.MAIN | Main Y axis. |
YAxis.SECONDARY | Secondary Y axis. |
Chart FX supports two Y axes with different and independent scales, you can use this property to associate data series with any of these axis. A typical example of a double Y axis chart is a financial (volume) chart, where the price of the stock ranges from 70-90 and the volume traded ranges from 500.000 to 2.000.000. Obviously, when you attempt to plot both series in the same chart, the scale needed in one axis to plot both series will not produce desirable results. In this case, you'll use this property to associate the stock price data series with the primary Y axis (ranging from 70-90) and the volume traded series with a secondary Y axis (ranging from 0 to 2.000.000).
When assigning a series to a Secondary Y axis you should make sure that you make the axis assignment before passing data. By doing this, Chart FX will calculate the AxisBase.setMax(double), AxisBase.setMin(double) and Axis.setStep(double) for the secondary Y axis automatically. If the axis assignment is done after the data has been passed, you can set the Max, Min and Step manually or call the ChartCore.recalcScale() method. Please keep in mind that calling the RecalcScale method is a less efficient way to create the chart.
Once you have set a specific data series to a chart, you can customize the axis settings using any of the properties supported by the Axis Object.
ChartCore.getAxis(int),
ChartCore.getAxisX(),
ChartCore.getAxisY(),
AxisBase.setMax(double),
AxisBase.setMin(double),
Axis.setStep(double),
ChartCore.recalcScale(),
Axis,
Chart
|
http://www.softwarefx.com | |||||||
| PREV CLASS NEXT CLASS | FRAMES NO FRAMES | |||||||
| SUMMARY: NESTED | FIELD | CONSTR | METHOD | DETAIL: FIELD | CONSTR | METHOD | |||||||