 SoftwareFX.ChartFX.ChartCore
|
Chart FX for Java 6.5 | |||||||
| PREV CLASS NEXT CLASS | FRAMES NO FRAMES | |||||||
| SUMMARY: NESTED | FIELD | CONSTR | METHOD | DETAIL: FIELD | CONSTR | METHOD | |||||||
java.lang.Object
public abstract class ChartCore
Provides access to the ChartCore object.
The ChartCore class is base class of the Chart FX for Java component.
| Field Summary | |
|---|---|
static double |
HIDDEN
|
| Constructor Summary | |
|---|---|
ChartCore()
|
|
| Method Summary | |
|---|---|
void |
clearData(int clearDataFlag)
Clears some or all data in the chart based on type setting. |
void |
closeData(int cod)
Used to close a previously opened communication channel with the openData(int, int, int) method. |
void |
exportChart(int format,
            java.io.OutputStream stream)
Used to export the chart data and/or properties to the clipboard, to a file or a stream using different formats. |
void |
exportChart(int format,
            java.lang.String fileName)
Used to export the chart data and/or properties to the clipboard, to a file or a stream using different formats. |
int |
getAngleX()
Gets the AngleX. |
int |
getAngleY()
Gets the AngleY. |
int |
getAxesStyle()
Gets the AxesStyle. |
AxisCollection |
getAxis()
Returns a selected Axis object. |
Axis |
getAxis(int n)
Deprecated. You should use getAxis() instead. |
Axis |
getAxisX()
Assigns properties specifically to the primary X axis. |
Axis |
getAxisY()
Assigns properties specifically to the Y axis. |
Axis |
getAxisY2()
Assigns properties specifically to the secondary Y axis. |
java.awt.Color |
getBackColor()
Gets the BackColor. |
java.awt.Image |
getBackgroundImage()
Deprecated. You should use getBackObject() instead. |
IAdornment |
getBackObject()
Gets the BackObject. |
java.awt.Color |
getBorderColor()
Gets the BorderColor. |
int |
getBorderEffect()
Gets the BorderEffect. |
IAdornment |
getBorderObject()
Gets the BorderObject. |
int |
getBottomGap()
Gets the BottomGap. |
int |
getChartStyle()
Gets the ChartStyle. |
Command |
getCommand(int nID)
Deprecated. You should use getCommands() instead. |
CommandBar |
getCommands()
Gets the list of commands associated with the chart. |
ConditionalAttributes |
getConditionalAttribute(int n)
Deprecated. You should use getConditionalAttributes() instead. |
ConditionalAttributesCollection |
getConditionalAttributes()
Returns a selected ConditionalAttributes object. |
ConstantLine |
getConstantLine(int n)
Deprecated. You should use getConstantLines() instead. |
ConstantLineCollection |
getConstantLines()
Allows you to set constant lines and assign their associated attributes to a chart. |
java.lang.String |
getCulture()
Gets the Culture. |
short |
getCylSides()
Gets the CylSides. |
DataEditor |
getDataEditorObj()
Allows you to set attributes directly to the DataEditor object. |
IDataProvider |
getDataSource()
Gets the DataSource. |
DataSourceSettings |
getDataSourceSettings()
Used to assign data related attributes to your chart applications. |
int |
getDataStyle()
Gets the DataStyle. |
DataTypeCollection |
getDataType()
An array property that specifies how Chart FX should treat the different fields available in the result set. |
int |
getDataType(int n)
Deprecated. You should use getDataType() instead. |
java.lang.String |
getDesignTimeData()
Gets the DesignTimeData. |
java.lang.Object |
getExtension(int n)
Deprecated. You should use getExtensions() instead. |
ExtensionManager |
getExtensions()
Collection used to add, clear and assign Chart FX extension objects. |
int |
getFileMask()
Gets the FileMask. |
int |
getGallery()
Gets the Gallery. |
IGalleryType |
getGalleryObj()
Gets the GalleryObj. |
java.awt.Rectangle |
getGaps()
Gets the Gaps. |
int |
getGrid()
Gets the Grid. |
HighlightSettings |
getHighlight()
Returns a HighlightSettings object for the chart. |
int |
getImageMode()
Deprecated. You should use ImageBackground.getMode() instead. |
java.lang.String |
getInfoString(java.lang.String mask,
              int series,
              int point,
              boolean inPoint)
Returns the mask string for a selected point or line in a chart. |
ChartDataObj |
getIniValue()
An array property used to set initial values to the data points to achieve floating bars and area charts. |
double |
getIniValue(int series,
            int point)
Deprecated. You should use getIniValue() instead. |
IAdornment |
getInsideBackObject()
Gets the InsideBackObject. |
java.awt.Color |
getInsideColor()
Gets the InsideColor. |
LabelList |
getKeyLeg()
Used to assign a key (short) legend to tickmarks in a categorical axis. |
java.lang.String |
getKeyLeg(int i)
Deprecated. You should use getKeyLeg() instead. |
int |
getLeftGap()
Gets the LeftGap. |
LabelList |
getLegend()
An array property that allows you to get or set the labels for the x-axis. |
java.lang.String |
getLegend(int i)
Deprecated. You should use getLegend() instead. |
LegendBox |
getLegendBoxObj()
Allows you to assign supported attributes directly to the values legend box. |
int |
getLineStyle()
Gets the LineStyle. |
int |
getLineWidth()
Gets the LineWidth. |
Link |
getLink()
Gets the Link object for the chart. |
int |
getMarkerShape()
Gets the MarkerShape. |
short |
getMarkerSize()
Gets the MarkerSize. |
short |
getMarkerStep()
Gets the MarkerStep. |
ToolBar |
getMenuBarObj()
Allows you to assign supported attributes directly the MenuBar object. |
int |
getMenuBarObj(int n)
Deprecated. You should use getMenuBarObj() instead. |
java.lang.String |
getMessageText(java.lang.String key)
Allows you to obtain default Chart FX stings which are displayed in the chart. |
int |
getNSeries()
Gets the NSeries. |
int |
getNValues()
Gets the NValues. |
java.awt.Color |
getPageColor()
Gets the PageColor. |
java.lang.String |
getPalette()
Gets the Palette. |
Pane |
getPane(int n)
Deprecated. You should use getPanes() instead. |
PaneCollection |
getPanes()
Returns a selected Panes object. |
int |
getPersonalizedFlags()
Gets the PersonalizedFlags. |
java.lang.String |
getPersonalizedName()
Gets the PersonalizedName. |
int |
getPerspective()
Gets the Perspective. |
PointAttributesCollection |
getPoint()
Assigns properties directly to a specific point in your chart. |
PointAttributes |
getPoint(int point)
Deprecated. You should use chart.getPoint()getItem instead. |
PointAttributes |
getPoint(int series,
         int point)
Deprecated. You should use chart.getPoint()getItem instead. |
java.awt.Font |
getPointFont()
Gets the PointFont. |
int |
getPointLabelAlign()
Gets the PointLabelAlign. |
short |
getPointLabelAngle()
Gets the PointLabelAngle. |
java.awt.Color |
getPointLabelColor()
Gets the PointLabelColor. |
java.awt.Font |
getPointLabelFont()
Gets the PointLabelFont. |
java.lang.String |
getPointLabelMask()
Gets the PointLabelMask. |
java.awt.Point |
getPointLabelOffset()
Gets the PointLabelOffset. |
Printer |
getPrinter()
Allows you to set properties to your chart for printing. |
int |
getRightGap()
Gets the RightGap. |
int |
getScheme()
Gets the Scheme. |
SeriesAttributesCollection |
getSeries()
Assigns properties directly to the selected series in the chart. |
SeriesAttributes |
getSeries(int n)
Deprecated. You should use getSeries() instead. |
LabelList |
getSerKey()
Set an abbreviated name for each series using a short string that will be displayed in the data editor. |
java.lang.String |
getSerKey(int i)
Deprecated. You should use getSerKey() instead. |
LabelList |
getSerLeg()
An array property that allows you to set the series legend for the chart. |
java.lang.String |
getSerLeg(int i)
Deprecated. You should use getSerLeg() instead. |
LegendBox |
getSerLegBoxObj()
Allows you to assign supported attributes directly the series legend box. |
int |
getSmoothFlags()
Gets the SmoothFlags. |
int |
getStacked()
Gets the Stacked. |
Stripe |
getStripe(int n)
Deprecated. You should use getStripes() instead. |
StripeCollection |
getStripes()
Allows you to assign attributes to a selected stripe object. |
int |
getStyleEx()
Gets the StyleEx. |
int |
getTemplateMask()
Gets the TemplateMask. |
java.lang.String |
getTipMask()
Gets the TipMask. |
TitleDockable |
getTitle(int n)
Deprecated. You should use getTitles() instead. |
TitleCollection |
getTitles()
Allows you to set a title to the top of a chart. |
ToolBar |
getToolBarObj()
Allows you to assign supported attributes directly the ToolBar object. |
int |
getToolBarObj(int n)
Deprecated. You should use getToolBarObj() instead. |
int |
getTopGap()
Gets the TopGap. |
int |
getTypeEx()
Gets the TypeEx. |
int |
getTypeMask()
Gets the TypeMask. |
UserLegendBox |
getUserLegendBoxObj()
Allows you to assign supported attributes directly the user legend box. |
ChartDataObj |
getValue()
Allows you to set the data values for the chart. |
double |
getValue(int series,
         int point)
Deprecated. You should use getValue() instead. |
int |
getView3DDepth()
Gets the View3DDepth. |
int |
getView3DLight()
Gets the View3DLight. |
short |
getVolume()
Gets the Volume. |
int |
getWallWidth()
Gets the WallWidth. |
ChartDataObj |
getXValue()
An array property that allows you to set X values to data points in a XY Plot. |
double |
getXValue(int series,
          int point)
Deprecated. You should use getXValue() instead. |
LabelList |
getYLeg()
Used to assign text labels to the Y axis. |
java.lang.String |
getYLeg(int i)
Deprecated. You should use getYLeg() instead. |
void |
importChart(int format,
            java.io.InputStream stream)
Used to import a previously saved chart file, template or stream. |
void |
importChart(int format,
            java.lang.String fileName)
Used to import a previously saved chart file, template or stream. |
boolean |
isAllowDrag()
Gets the AllowDrag. |
boolean |
isAllowEdit()
Gets the AllowEdit. |
boolean |
isBorder()
Gets the Border. |
boolean |
isChart3D()
Gets the Chart3D. |
boolean |
isCluster()
Gets the Cluster. |
boolean |
isContextMenus()
Gets the ContextMenus. |
boolean |
isCrossHairs()
Gets the CrossHairs. |
boolean |
isDataEditor()
Gets the DataEditor. |
boolean |
isDirty()
Gets the Dirty. |
boolean |
isLegendBox()
Gets the LegendBox. |
boolean |
isMenuBar()
Gets the MenuBar. |
boolean |
isMultipleColors()
Gets the MultipleColors. |
boolean |
isPointLabels()
Gets the PointLabels. |
boolean |
isScrollable()
Gets the Scrollable. |
boolean |
isSerLegBox()
Gets the SerLegBox. |
boolean |
isShowTips()
Gets the ShowTips. |
boolean |
isToolBar()
Gets the ToolBar. |
boolean |
isUserLegendBox()
Gets the UserLegendBox. |
boolean |
isView3D()
Gets the View3D. |
boolean |
isZoom()
Gets the Zoom. |
java.awt.Point |
markerToPixel(int series,
              int point)
Returns a point object with the position for a specified chart marker. |
void |
openData(int cod,
         int n1,
         int n2)
Opens a communications channel to pass data to the chart. |
void |
paint(java.awt.Graphics2D graphics2D,
      int x,
      int y,
      int width,
      int height,
      int paintFlags)
Allows you to paint the chart in a given device context. |
void |
recalcScale()
Resets and recalculates all scale values. |
void |
setAllowDrag(boolean value)
Enables or prevents the end user from dragging a marker with the mouse to change its value. |
void |
setAllowEdit(boolean value)
Enables or prevents the end user from altering data through the data editor. |
void |
setAngleX(int value)
Allows you to set a 3D rotation angle around the X-axis. |
void |
setAngleY(int value)
Allows you to set a 3D rotation angle around the Y-axis. |
void |
setAxesStyle(int value)
Used to change the style of the axes surrounding the chart area. |
void |
setBackColor(java.awt.Color value)
Gets or sets the chart background color. |
void |
setBackgroundImage(java.awt.Image value)
Deprecated. You should use setBackObject(SoftwareFX.ChartFX.IAdornment) instead. |
void |
setBackObject(IAdornment value)
Allows you to assign a gradient or an image to the background of a chart. |
void |
setBorder(boolean value)
Shows or hides the marker borders for all data series in the chart. |
void |
setBorderColor(java.awt.Color value)
Gets or sets the border color for all data series in the chart. |
void |
setBorderEffect(int value)
Alters the visual effect of the border surrounding the chart area as well as the border between the series. |
void |
setBorderObject(IAdornment value)
Gets or sets a default or image border to the chart. |
void |
setBottomGap(int value)
Defines the bottom margin between the chart and the bounding rectangle. |
void |
setChart3D(boolean value)
Toggles the chart between 2D and 3D modes. |
void |
setChartStyle(int value)
Allows you to restrict or allow end-user access to several functions provided through the Chart FX end-user interface. |
void |
setCluster(boolean value)
Displays a z-clustered 3D chart. |
void |
setContextMenus(boolean value)
Allows you to enable or disable context sensitive menus when the user right clicks a particular Chart FX element. |
void |
setCrossHairs(boolean value)
Enables or disables Cross-Hairs markers in the chart. |
void |
setCulture(java.lang.String value)
Allows you to localize charts for a specific language and region. |
void |
setCylSides(short value)
Sets a 3D cylindrical or conical shape to all data series in a chart. |
void |
setDataEditor(boolean value)
Allows you to show or hide the Data Editor in the chart area. |
void |
setDataSource(IDataProvider value)
Gets or sets the source containing the values used to populate the chart. |
void |
setDataStyle(int value)
Controls how Chart FX plots the fields in the resultset. |
void |
setDataType(int n,
            int value)
Deprecated. You should use getDataType() instead. |
void |
setDesignTimeData(java.lang.String value)
Used to set data for charts at design time. |
void |
setDirty(boolean value)
Returns a boolean specifying if the chart has been modified by the user. |
void |
setFileMask(int value)
Allows you to customize what to save in the chart when using the exportChart(int, java.lang.String) method. |
void |
setGallery(int value)
Sets the chart type. |
void |
setGalleryObj(IGalleryType value)
Used to create a gallery object to assign additional attributes to the selected gallery type. |
void |
setGaps(java.awt.Rectangle value)
Used to set the top, bottom, left and right gaps for a chart. |
void |
setGrid(int value)
Sets the vertical and/or horizontal grids for charts. |
void |
setImageMode(int value)
Deprecated. You should use ImageBackground.setMode(int) instead. |
void |
setIniValue(int series,
            int point,
            double value)
Deprecated. You should use getIniValue() instead. |
void |
setInsideBackObject(IAdornment value)
Allows you to assign a gradient to the inside area of a chart. |
void |
setInsideColor(java.awt.Color value)
Changes the color of the inner charting area. |
void |
setKeyLeg(int i,
          java.lang.String value)
Deprecated. You should use getKeyLeg() instead. |
void |
setLeftGap(int value)
Specifies the left margin between the chart and the bounding rectangle. |
void |
setLegend(int i,
          java.lang.String value)
Deprecated. You should use getLegend() instead. |
void |
setLegendBox(boolean value)
Shows or hides the Legend box in the chart area. |
void |
setLineStyle(int value)
Sets a line style to chart borders and 2D lines. |
void |
setLineWidth(int value)
Sets the line weight (or thickness) for chart borders or 2D lines. |
void |
setMarkerShape(int value)
Specifies the shape of the point markers painted in the chart. |
void |
setMarkerSize(short value)
Controls the size of the markers in the chart. |
void |
setMarkerStep(short value)
Controls how frequently point markers are shown in the chart. |
void |
setMenuBar(boolean value)
Allows you to show or hide the Chart FX MenuBar. |
void |
setMenuBarObj(int n,
              int value)
Deprecated. You should use getMenuBarObj() instead. |
void |
setMessageText(java.lang.String key,
               java.lang.String message)
Allows you to customize default Chart FX stings which are displayed in the chart. |
void |
setMultipleColors(boolean value)
Allows for independently colored data points. |
void |
setNSeries(int value)
Used to read the number of series available in a chart. |
void |
setNValues(int value)
Used to read the number of data points per series in a chart. |
void |
setPageColor(java.awt.Color value)
Allows you to specify a form background color needed to fill areas around image border shadowing. |
void |
setPalette(java.lang.String value)
Allows you to set a Chart FX pre-defined palette. |
void |
setPersonalizedFlags(int value)
Allows you to set the preferences for saving and loading personalized charts. |
void |
setPersonalizedName(java.lang.String value)
Allows you to use the same name for more that one chart or change the default name. |
void |
setPerspective(int value)
Allows you to set a 3D perspective to control the view of the chart depth. |
void |
setPoint(int series,
         int point,
         PointAttributes value)
Deprecated. You should use chart.getPoint()setItem instead. |
void |
setPoint(int point,
         PointAttributes value)
Deprecated. You should use chart.getPoint()setItem instead. |
void |
setPointFont(java.awt.Font value)
Allows you to select a different collection of wingding fonts for use as marker shapes. |
void |
setPointLabelAlign(int value)
Allows you to align point labels using the marker as a reference. |
void |
setPointLabelAngle(short value)
Sets the amount of text rotation for the labels. |
void |
setPointLabelColor(java.awt.Color value)
Sets the color of the point label text for the entire chart. |
void |
setPointLabelFont(java.awt.Font value)
Allows you to set a font directly to the point labels in a chart. |
void |
setPointLabelMask(java.lang.String value)
Allows you to customize the labels that appear when you set the PointLabels property. |
void |
setPointLabelOffset(java.awt.Point value)
Allows you to customize the point label position by configuring X and Y coordinates. |
void |
setPointLabels(boolean value)
Displays the value on each data point for all series in the chart. |
void |
setRightGap(int value)
Specifies the right margin between the chart and the bounding rectangle. |
void |
setScheme(int value)
Allows you to change the color scheme in the chart. |
void |
setScrollable(boolean value)
Enables or disables chart scrolling. |
void |
setSerKey(int i,
          java.lang.String value)
Deprecated. You should use getSerKey() instead. |
void |
setSerLeg(int i,
          java.lang.String value)
Deprecated. You should use getSerLeg() instead. |
void |
setSerLegBox(boolean value)
Shows or hides the series legend box in the chart. |
void |
setShowTips(boolean value)
Allows you to enable or disable tooltips when the user positions the mouse over a particular Chart FX element in the chart area only. |
void |
setSmoothFlags(int value)
Gives a smooth visual effect to a particular chart elements. |
void |
setStacked(int value)
Allows you to select the stacked style in the chart. |
void |
setStyleEx(int value)
Allows you to restrict or allow end-user access to several functions provided through the Chart FX end-user interface. |
void |
setTemplateMask(int value)
Used to specify the chart data to be saved in personalization and template files. |
void |
setTipMask(java.lang.String value)
Allows you to control the information to be displayed in the tooltip when the user positions the mouse over a particular data point in the chart. |
void |
setToolBar(boolean value)
Shows or hides the Chart FX Toolbar. |
void |
setToolBarObj(int n,
              int value)
Deprecated. You should use getToolBarObj() instead. |
void |
setTopGap(int value)
Specifies the top margin between the chart and the bounding rectangle. |
void |
setTypeEx(int value)
Allows you to set additional visual attributes in the chart and it is provided as an extension of the Type property. |
void |
setTypeMask(int value)
Allows you to set additional visual attributes in the chart. |
void |
setUserLegendBox(boolean value)
Shows or hides the user legend box. |
void |
setValue(int series,
         int point,
         double value)
Deprecated. You should use getValue() instead. |
void |
setView3D(boolean value)
Allows you to enable or disable 3D view of the chart. |
void |
setView3DDepth(int value)
Allows you to specify the depth of a 3D chart. |
void |
setView3DLight(int value)
Allows to specify the light setting for a 3D chart. |
void |
setVolume(short value)
Allows you to specify a volume for data series markers in supported galleries. |
void |
setWallWidth(int value)
Allows you to set the width of the wall for a 3D chart. |
void |
setXValue(int series,
          int point,
          double value)
Deprecated. You should use getXValue() instead. |
void |
setYLeg(int i,
        java.lang.String value)
Deprecated. You should use getYLeg() instead. |
void |
setZoom(boolean value)
Allows you to select a section of the chart using the mouse cursor and zoom in that area. |
| Methods inherited from class java.lang.Object |
|---|
equals, getClass, hashCode, notify, notifyAll, toString, wait, wait, wait |
| Field Detail |
|---|
public static final double HIDDEN
| Constructor Detail |
|---|
public ChartCore()
| Method Detail |
|---|
public void clearData(int clearDataFlag)
Clears some or all data in the chart based on type setting.
This method can be called combining the constants in a bitwise Or. For example if you want to remove both Title.setText(java.lang.String) and getValue(int, int), you may invoke the ClearData method as follows:
chart1.clearData(ClearDataFlag.TITLES | ClearDataFlag.VALUES);
Using multiple style flags allows control over which elements are cleared in a chart.
In general the ClearData method only clear arrays. ClearData is not to be used to "Reset To Defaults". If you want to revert the chart to a previous state, use Import/Export methods.
clearDataFlag - A ClearDataFlag specifying what type of data you want to remove form the chart.Parameter Values:
The available values for clearDataFlag are:
| Value | Description |
|---|---|
ClearDataFlag.VALUES | Clear all numeric values set with the Value property. |
ClearDataFlag.XVALUES | Clear all X Values for an XY Plot set with the XValue property. |
ClearDataFlag.INI_VALUES | Clear IniValues set with the Inivalue property. |
ClearDataFlag.DATA | Clear all data from the chart. |
ClearDataFlag.STRIPES | Clear all Color stripes. |
ClearDataFlag.CONSTANT_LINES | Clear all ConstantLines. |
ClearDataFlag.COLORS_AND_PATTERNS | Clears the Colors and Patterns for the Series collection objects. |
ClearDataFlag.PER_POINT_ATTRIBUTES | Clear all attributes that has been set per point. |
ClearDataFlag.PER_SERIES_ATTRIBUTES | Clear all attributes that has been set per series (MultiType). |
ClearDataFlag.LABELS | Clear all labels from the chart. |
ClearDataFlag.TITLES | Clear all titles from the chart. |
ClearDataFlag.STRINGS | Clear all strings (including legends and titles) passed to the chart. |
ClearDataFlag.TOOLS | Removes all tools being displayed in the chart. Legends, Toolbar, DataEditor, etc. |
ClearDataFlag.EXTENSIONS | Removes all Chart FX extensions being used. |
ClearDataFlag.COMMAND | Clear all new commands from the chart. |
ClearDataFlag.FONTOS | Clear fonts and go back to Chart FX defaults. |
ClearDataFlag.OTHER | Clear all other data not listed here. |
ClearDataFlag.ALL_DATA | Includes all constants specified above. |
openData(int, int, int),
closeData(int)public void closeData(int cod)
Used to close a previously opened communication channel with the openData(int, int, int) method.
For each OpenData method call there must be a CloseData method call with the same constant used in the OpenData method.
After the CloseData method is used, Chart FX automatically recalculates the scale values and repaints the chart when new data is received by the chart. Therefore, it is not required to call the recalcScale() after Closing the communication channel.
The right way of invoking this method is to combine the channel and styles using the Or (bitwise) operator, as follows:
chart1.closeData(COD.VALUES | COD.REMOVE);
cod - This is a combination (bitwise) of the channel and/or styles from the COD types.Parameter Values:
The available values for cod are:
| Value | Description |
|---|---|
COD.UNCHANGE | Modify a specific point value within a chart without changing the other series and point assignments. |
COD.VALUES | Data point values. |
COD.CONSTANTS | Constant Lines. |
COD.COLORS | Colors. |
COD.STRIPES | Stripes. |
COD.INI_VALUES | Initial values for Gantt or floating bar charts. |
COD.XVALUES | X values for XY Plots. |
COD.TITLES | Titles. |
COD.NO_ALLOC | For internal use only. Do not use this value. |
COD.ALLOC_HIDDEN | Allocates memory for points that are defined in the OpenData communication channel, but are not passed values. This flag treats these points as if they were hidden. |
COD.INSERT_POINTS | Used in real-time charts to insert points into the beginning of the chart forcing the chart to scroll to the right. |
COD.REAL_TIME | For RealTime charts. Do not scroll. |
COD.REAL_TIME_SCROLL | For RealTime charts. Scroll to the last acquired point. |
COD.ADD_POINTS | RealTime Usage. Relative pointer access. |
COD.REMOVE | Delete all data related to the appropriate Constants (e.g. Values). |
COD.NO_INVALIDATE | Do not invalidate chart for repainting. |
COD.SCROLL_LEGEND | Scroll Legends in RealTime charts. |
COD.UNKNOWN | Allows Chart FX to size the data array dynamically as it receives new points. Used when the number of points or series is unknown. |
getValue(int, int),
openData(int, int, int),
recalcScale(),
SeriesAttributes,
Stripe,
ConstantLine
public void exportChart(int format,
                        java.lang.String fileName)
Used to export the chart data and/or properties to the clipboard, to a file or a stream using different formats.
When saving to a Binary or XML file, you may select which chart settings to save by using the setFileMask(int) property. The BinaryTemplate type is preset to save using the Template enumeration for the FileMask property.
Please refer to the importChart(int, java.lang.String) method for more information on how to retrieve previously saved files.
The XML enumeration is used to export chart properties in XML format. You can read chart properties from XML files using the importChart(int, java.lang.String) method.
format - Specify the file format to export.fileName - The File name you are exporting to.Parameter Values:
The available values for format are:
| Value | Description |
|---|---|
FileFormat.BINARY | Binary |
FileFormat.BINARY_TEMPLATE | Binary file with 'Template' FileMask pre-assigned |
FileFormat.XML | XML |
FileFormat.TEXT | Text File |
FileFormat.BITMAP | Bitmap |
FileFormat.METAFILE | Metafile |
FileFormat.JPEG | Jpeg (Only supported with Internet control) |
FileFormat.PNG | Png (Only supported with Internet control) |
FileFormat.EXTERNAL | Reads the sting (file extension) from the ImgTags property and uses an image writer to generate a chart in the configured format. (Only supported with Internet control) |
setFileMask(int),
importChart(int, java.lang.String)
public void exportChart(int format,
                        java.io.OutputStream stream)
Used to export the chart data and/or properties to the clipboard, to a file or a stream using different formats.
When saving to a Binary or XML file, you may select which chart settings to save by using the setFileMask(int) property. The BinaryTemplate type is preset to save using the Template enumeration for the FileMask property.
Please refer to the importChart(int, java.lang.String) method for more information on how to retrieve previously saved files.
The XML enumeration is used to export chart properties in XML format. You can read chart properties from XML files using the importChart(int, java.lang.String) method.
format - Specify the file format to export.stream - Stream as System.IO.Stream.Parameter Values:
The available values for format are:
| Value | Description |
|---|---|
FileFormat.BINARY | Binary |
FileFormat.BINARY_TEMPLATE | Binary file with 'Template' FileMask pre-assigned |
FileFormat.XML | XML |
FileFormat.TEXT | Text File |
FileFormat.BITMAP | Bitmap |
FileFormat.METAFILE | Metafile |
FileFormat.JPEG | Jpeg (Only supported with Internet control) |
FileFormat.PNG | Png (Only supported with Internet control) |
FileFormat.EXTERNAL | Reads the sting (file extension) from the ImgTags property and uses an image writer to generate a chart in the configured format. (Only supported with Internet control) |
setFileMask(int),
importChart(int, java.lang.String)public int getAngleX()
Gets the AngleX. For more detail see setAngleX(int).
public int getAngleY()
Gets the AngleY. For more detail see setAngleY(int).
public int getAxesStyle()
Gets the AxesStyle. For more detail see setAxesStyle(int).
public Axis getAxis(int n)
getAxis() instead.
public AxisCollection getAxis()
Returns a selected Axis object.
The getAxisX() and getAxisY() members allow you to assign attributes directly to the X or Y axis. We suggest using those properties for general property assignment.
When using a predefined axis constants (e.g. 'YAxis.Secondary'), you will need to cast the data type for the constant:
chart1.getAxis((int) YAxis.SECONDARY).setVisible(true);
The Axis member is useful when setting attributes to the secondary Y-axis. In order to make a secondary Y-axis visible, you must set a AxisBase.setMax(double) and AxisBase.setMin(double) for the secondary Y-axis or assign the desired series to the secondary axis before the data has been passed to the chart.
When assigning a series to a Secondary Y axis you should make sure that you make the axis assignment before passing data. By doing this, Chart FX will calculate the AxisBase.setMax(double), AxisBase.setMin(double) and Axis.setStep(double) for the secondary Y axis automatically. If the axis assignment is done after the data has been passed, you can set the Max, Min and Step manually or call the recalcScale() method. Please keep in mind that calling the RecalcScale method is a less efficient way to create the chart.
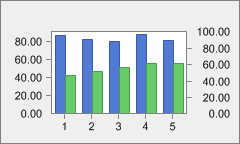
There is no automatic method for aligning a main and secondary axis, it is required that you set the Min and Max in order to align them manually. The generic algorithm used to find these values is the following:
Axis.Min = OtherAxis.Min/(OtherAxis.Max / Axis.Max)
Below the secondary Y axis is configured with a Min/Max set to 0/100:
getAxisX(),
getAxisY(),
AxisBase.setMax(double),
AxisBase.setMin(double),
getValue(int, int),
setLineStyle(int),
setLineWidth(int),
Axis.getLabel(int),
setStyleEx(int),
recalcScale(),
ConstantLine,
Stripe,
Axis,
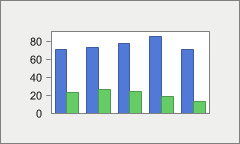
SeriesAttributespublic Axis getAxisX()
Assigns properties specifically to the primary X axis.
The AxisX property allows developers to assign attributes directly to the X axis object, use the getAxisY() property for the primary Y axis.
Axis Properties such as ValueFormat.setDecimals(int), ValueFormat.setFormat(int), AxisSectionBase.getGrid()AxisBase.setMax(double), AxisBase.setMin(double), AxisBase.setVisible(boolean), AxisSectionBase.setTextColor(java.awt.Color) and AxisBase.setTitle(SoftwareFX.ChartFX.Title) are enumerations of the AxisX property.
The getAxis(int) property is used to reference axes other than the primary X and Y.
When using a predefined axis constants (e.g. 'YAxis.Secondary'), you will need to cast the data type for the constant:
chart1.getAxis((int) YAxis.SECONDARY).setVisible(true);
You can control Axis line Line.setColor(java.awt.Color), Line.setStyle(int) and Line.setWidth(int) using the Line property and supported members of the Line
Class
.AxisBase.setVisible(boolean)
AxisSectionBase.setGridlines(boolean) and AxisSectionBase.setMinorGridlines(boolean) may be set using the supported properties. Using the AxisSectionBase.getGrid() and AxisSectionBase.getMinorGrid() properties, you can customize grid line attributes using the Line
Class
members.
The X axis has been hidden by turning the AxisBase.setVisible(boolean) property to False:
ValueFormat.setDecimals(int),
ValueFormat.setFormat(int),
AxisBase.setMax(double),
AxisBase.setMin(double),
AxisBase.setVisible(boolean),
AxisSectionBase.setTextColor(java.awt.Color),
AxisBase.setTitle(SoftwareFX.ChartFX.Title),
getAxis(int),
getAxisY(),
AxisSectionBase.setGridlines(boolean),
AxisSectionBase.setMinorGridlines(boolean),
AxisSectionBase.getGrid(),
AxisSectionBase.getMinorGrid(),
Line.setColor(java.awt.Color),
Line.setWidth(int),
Axis,
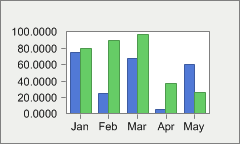
Linepublic Axis getAxisY()
Assigns properties specifically to the Y axis.
The AxisY property allows developers to assign attributes directly to the Y axis object, use the getAxisX() property for the primary X axis.
Axis Properties such as ValueFormat.setDecimals(int), ValueFormat.setFormat(int), AxisBase.setMax(double), AxisBase.setMin(double), AxisBase.setVisible(boolean), AxisSectionBase.setTextColor(java.awt.Color) and AxisBase.setTitle(SoftwareFX.ChartFX.Title) are enumerations of the AxisY property.
The getAxis(int) property is used to reference axes other than the primary X and Y.
When using a predefined axis constants (e.g. 'YAxis.Secondary'), you will need to cast the data type for the constant:
chart1.getAxis((int) YAxis.SECONDARY).setVisible(true);
You can control Axis line Line.setColor(java.awt.Color), Line.setStyle(int) and Line.setWidth(int) using the Line property and supported members of the Line
Class
.
AxisSectionBase.setGridlines(boolean) and AxisSectionBase.setMinorGridlines(boolean) may be set using the supported properties. Using the AxisSectionBase.getGrid() and AxisSectionBase.getMinorGrid() properties, you can customize grid line attributes using the Line
Class
members.
Below the Y axis has been formatted to use 4 decimals:
ValueFormat.setDecimals(int),
ValueFormat.setFormat(int),
AxisSectionBase.getGrid(),
AxisSectionBase.setGridlines(boolean),
AxisSectionBase.getMinorGrid(),
AxisSectionBase.setMinorGridlines(boolean),
AxisBase.setMax(double),
AxisBase.setMin(double),
AxisBase.setVisible(boolean),
AxisSectionBase.setTextColor(java.awt.Color),
AxisBase.setTitle(SoftwareFX.ChartFX.Title),
getAxis(int),
getAxisX(),
Line.setColor(java.awt.Color),
Line.setWidth(int),
Axis,
Linepublic Axis getAxisY2()
Assigns properties specifically to the secondary Y axis.
The getAxisY() property allows developers to assign attributes directly to the Y axis object and the getAxisX() property for the primary X axis.
Axis Properties such as ValueFormat.setDecimals(int), ValueFormat.setFormat(int), AxisBase.setMax(double), AxisBase.setMin(double), AxisBase.setVisible(boolean), AxisSectionBase.setTextColor(java.awt.Color) and AxisBase.setTitle(SoftwareFX.ChartFX.Title) are enumerations of the AxisY2 property.
The getAxis(int) property is used to reference axes other than the X, Y and Y2.
You can control Axis line Line.setColor(java.awt.Color), Line.setStyle(int) and Line.setWidth(int) using the Line property and supported members of the Line class.
ValueFormat.setDecimals(int),
ValueFormat.setFormat(int),
AxisSectionBase.getGrid(),
AxisSectionBase.setGridlines(boolean),
AxisSectionBase.getMinorGrid(),
AxisSectionBase.setMinorGridlines(boolean),
AxisBase.setMax(double),
AxisBase.setMin(double),
AxisBase.setVisible(boolean),
AxisSectionBase.setTextColor(java.awt.Color),
AxisBase.setTitle(SoftwareFX.ChartFX.Title),
getAxis(int),
getAxisX(),
Line.setColor(java.awt.Color),
Line.setWidth(int),
getAxisY(),
Axis,
Linepublic java.awt.Color getBackColor()
Gets the BackColor. For more detail see setBackColor(java.awt.Color).
public java.awt.Image getBackgroundImage()
getBackObject() instead.
public IAdornment getBackObject()
Gets the BackObject. For more detail see setBackObject(SoftwareFX.ChartFX.IAdornment).
public java.awt.Color getBorderColor()
Gets the BorderColor. For more detail see setBorderColor(java.awt.Color).
public int getBorderEffect()
Gets the BorderEffect. For more detail see setBorderEffect(int).
public IAdornment getBorderObject()
Gets the BorderObject. For more detail see setBorderObject(SoftwareFX.ChartFX.IAdornment).
public int getBottomGap()
Gets the BottomGap. For more detail see setBottomGap(int).
public int getChartStyle()
Gets the ChartStyle. For more detail see setChartStyle(int).
public Command getCommand(int nID)
getCommands() instead.
public CommandBar getCommands()
Gets the list of commands associated with the chart.
This property is accessed when you want to customize the Toolbar/Menubar or change any option associated with the default Toolbar/Menubar. For more information on how to customize the Toolbar/Menubar, please refer to the Programmer's Guide or Resource Center.
Please refer to the Command
Class
for more information on properties supported by this object.
When you create a chart, the ToolbarObj/MenubarObj and the chart's Commands properties are the same. This means you can access properties related to the Commands object by referencing the ToolbarObj/MenubarObj object or just the chart name as follows:
chart1.getToolbarObj().getCommands() or chart1.getMenubarObj().getCommands() or chart1.getCommands()
Commandpublic ConditionalAttributes getConditionalAttribute(int n)
getConditionalAttributes() instead.
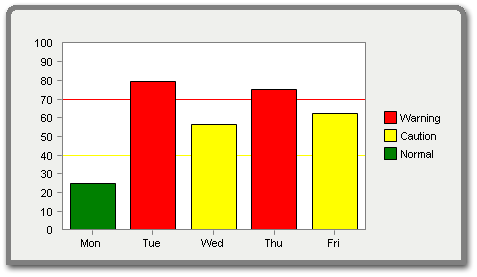
public ConditionalAttributesCollection getConditionalAttributes()
Returns a selected ConditionalAttributes object.
This property exposes the members of the Condition and ConditionalAttributes classes. Please see the Condition and ConditionalAttributes classes for additional information regarding those supported members.
Condition,
ConditionalAttributes,
ConditionalAttributesCollectionpublic ConstantLine getConstantLine(int n)
getConstantLines() instead.
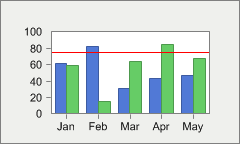
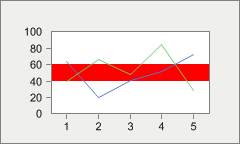
public ConstantLineCollection getConstantLines()
Allows you to set constant lines and assign their associated attributes to a chart.
You can customize the ConstantLine using the supported properties of the ConstantLine
Class
.
Multiple constant lines are supported in charts by using the index parameter.
Constant lines may be assigned to the primary/secondary X or Y axes.
You can control constant line Line.setColor(java.awt.Color), Line.setStyle(int) and Line.setWidth(int) using the supported members of the Line
Class
.
Here is a constant line on the Y axis at a value of 75:
ConstantLine.setAxis(int),
Line.setColor(java.awt.Color),
Line.setWidth(int),
Line.setStyle(int),
ConstantLine.setText(java.lang.String),
ConstantLine.setTextColor(java.awt.Color),
ConstantLine.setValue(double),
ConstantLine,
Linepublic java.lang.String getCulture()
Gets the Culture. For more detail see setCulture(java.lang.String).
public short getCylSides()
Gets the CylSides. For more detail see setCylSides(short).
public DataEditor getDataEditorObj()
Allows you to set attributes directly to the DataEditor object.
You must first make sure the DataEditor property is set to True before you can see any customization. This will make the data editor visible in the chart.
Properties such as DataEditor.setBackColor(java.awt.Color)DataEditor.setBackColorData(java.awt.Color), DataEditor.setAutoSize(boolean), DataEditor.setHeight(int), DataEditor.setWidth(int), etc. are available for the DataEditor
Class
.
The DataEditorObj property was used to set the DataEditor.setBackColorData(java.awt.Color) of the data editor to Aqua:
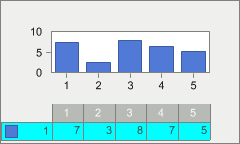
DataEditor.setAutoSize(boolean),
DataEditor.setBackColorData(java.awt.Color),
setDataEditor(boolean),
DataEditor.setHeight(int),
DataEditor.setWidth(int),
DataEditorpublic IDataProvider getDataSource()
Gets the DataSource. For more detail see setDataSource(SoftwareFX.ChartFX.IDataProvider).
public DataSourceSettings getDataSourceSettings()
Used to assign data related attributes to your chart applications.
You can use the DataSourceSettings.setDataSource(SoftwareFX.ChartFX.IDataProvider) property to define where the chart datasource when passing data from database, text files or arrays.
The DataSourceSettings.setDataStyle(int) property may be used to control how Chart FX plots the fields in a resultset.
The DataSourceSettings.getDataType(int) property allows you to specify how Chart FX should treat the different fields available in the resultset.
DataSourceSettings.setDataSource(SoftwareFX.ChartFX.IDataProvider),
DataSourceSettings.setDataStyle(int),
DataSourceSettings.getDataType(int),
DataSourceSettings.setLabelSeparator(java.lang.String),
DataSourceSettingspublic int getDataStyle()
Gets the DataStyle. For more detail see setDataStyle(int).
public int getDataType(int n)
getDataType() instead.
public DataTypeCollection getDataType()
An array property that specifies how Chart FX should treat the different fields available in the result set.
This property is used in conjunction with the setDataStyle(int) member to control how Chart FX takes the information from a Data Control.
When using this property, you must make sure each and every field has a DataType set. For example if you have 4 field in your result set, you must make sure 4 assignments are made using this property.
Make sure you set the DataType for all fields before reading the data.
The Value enumeration should be used when there is a categorical axis (1,2,3,4,5..) in your chart. To change the Legends (labels X axis) you should use the getLegend(int) member.
The series legend (setSerLegBox(boolean)) will show the label of the Y axis since it is an independent variable (X variable depends on Y variable). To modify the Series legend use the getSerLeg(int) member.
This property is very useful when you have a resultset that you would like to use to chart data, where you have some fields that are not necessary for the chart. If you would like to ignore a field in the result set, the DataType can be set to NotUsed.
chart1.setDataType(0, DataType.NOT_USED);
It is also useful to change the default rules Chart FX applies to retrieve data from a data control. The following are the rules:
1) Series Legends will be taken from the numerical field names.
2) All numerical columns will be plotted as different series and all string and/or date columns will be plotted as point legends (joined by the '-' character).
3) All string and numerical fields specified in the SELECT statement will be plot.
setDataStyle(int),
setDataSource(SoftwareFX.ChartFX.IDataProvider),
getSerLeg(int),
setSerLegBox(boolean),
openData(int, int, int),
closeData(int)public java.lang.String getDesignTimeData()
Gets the DesignTimeData. For more detail see setDesignTimeData(java.lang.String).
public java.lang.Object getExtension(int n)
getExtensions() instead.
public ExtensionManager getExtensions()
Collection used to add, clear and assign Chart FX extension objects.
Chart FX has been designed with extensibility in mind. Using this property, additional functionality can be added to the component such as the Annotation, OLAP, Maps, Financial, Statistical or RealTime Extensions. For more information about the available Chart FX Extensions, please visit our website at:
http://www.softwarefx.com/extensions/
AnnotationXpublic int getFileMask()
Gets the FileMask. For more detail see setFileMask(int).
public int getGallery()
Gets the Gallery. For more detail see setGallery(int).
public IGalleryType getGalleryObj()
Gets the GalleryObj. For more detail see setGalleryObj(SoftwareFX.ChartFX.IGalleryType).
public java.awt.Rectangle getGaps()
Gets the Gaps. For more detail see setGaps(java.awt.Rectangle).
public int getGrid()
Gets the Grid. For more detail see setGrid(int).
public HighlightSettings getHighlight()
Returns a HighlightSettings object for the chart.
To highlight a series in a chart, simply hover the mouse over a desired series while this property is set to true.
The HighlightSettings
Class
supports members which allow the developer to customize how a hightlighted item will be displayed. Please see the HighlightSettings
Class
for more information regarding the supported member.
HighlightSettingspublic int getImageMode()
ImageBackground.getMode() instead.
getBackObject()
public java.lang.String getInfoString(java.lang.String mask,
                                      int series,
                                      int point,
                                      boolean inPoint)
Returns the mask string for a selected point or line in a chart.
This method is useful when you would like to return the configured mask string for a selected point label.
You may set the mask string for a selected chart element using the setPointLabelMask(java.lang.String), setTipMask(java.lang.String) or URLParamMask properties.
mask - Speicifies the mask string. (May be null value.)series - Specifies the Series.point - Specifies the Point.inPoint - Specifies to return the mask of the Point or the line between the Points.setPointLabelMask(java.lang.String),
setTipMask(java.lang.String),
Chart
public double getIniValue(int series,
                          int point)
getIniValue() instead.
public ChartDataObj getIniValue()
An array property used to set initial values to the data points to achieve floating bars and area charts.
This property applies to BAR, AREA and GANTT charts only.
This property must be used with the openData(int, int, int) and closeData(int) methods, and in conjunction with the COD.INI_VALUES constant to specify the data type you are passing.
The value of this property is in strict relation to the value of the point set with getValue(int, int) member, as follows:
If the data set using the Value property is a positive number, the data set using the IniValue property must be lesser in value.
If the data set using the Value property is a negative number, the data set using the IniValue property must be greater in value.
This property allows you to create the 'floating bars' effect with bar charts:
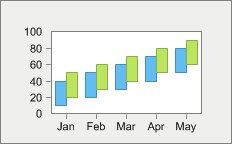
getValue(int, int),
openData(int, int, int),
closeData(int),
SeriesAttributespublic IAdornment getInsideBackObject()
Gets the InsideBackObject. For more detail see setInsideBackObject(SoftwareFX.ChartFX.IAdornment).
public java.awt.Color getInsideColor()
Gets the InsideColor. For more detail see setInsideColor(java.awt.Color).
public java.lang.String getKeyLeg(int i)
getKeyLeg() instead.
LabelListpublic LabelList getKeyLeg()
Used to assign a key (short) legend to tickmarks in a categorical axis.
You normally use the getLegend(int) property to assign labels to the tickmarks on the x-axis (when it is categorical). However, depending on the amount of points in the chart, these labels may be too long to properly fit in the space allotted for each tickmark in the x-axis.
Although you can control how frequent or how these labels are displayed with other properties supported by the Axis Class , sometimes you still have space limitations because of the size of the chart or the number of points.
This property can help you display shorter labels in the x-axis while maintaining longer labels in the legend window. Let's give you an example:
Let's suppose you have assigned the following labels to the x-axis with the Legend property: "January", "February", "March", "April", "May", "June", "July", "August", "September", "October", "November" and "December"
Now, these labels may or may not fit in the space allotted for each tickmark in the x-axis. If one of them does not fit, Chart FX will immediately display a TAG (red number) indicating that such label can not fit in the space allotted for it. This problem increases as the number of points in the chart increase.
With this property you can assign key labels (shorter strings) like: "Jan","Feb","Mar",Apr", etc...
Below is an example of setting a KeyLeg to abbreviate a chart legend:
getLegend(int),
setLegendBox(boolean),
Axis.getLabel(int),
Axispublic int getLeftGap()
Gets the LeftGap. For more detail see setLeftGap(int).
public java.lang.String getLegend(int i)
getLegend() instead.
LabelListpublic LabelList getLegend()
An array property that allows you to get or set the labels for the x-axis.
Although this property is provided as part of Chart FX, it is available only to provide backward compatibility with previous versions of Chart FX. Instead, you should use the Axis.getLabel(int) property supported by the axis object.
This property is used to get or set x-axis labels for a categorical axis. Normally, the X axis is a categorical axis containing labels associated with each major tick mark, while the Y axis label is a numerical axis where labels are controlled by the scale (AxisBase.setMin(double), AxisBase.setMax(double), etc) and numerical data contained in the chart.
You can set as many labels as points are available in the chart. These labels will be shown in the major tick marks of the selected axis. Some of them can be left empty so no labels are shown on that specific major tick mark.
You can control how frequent these labels are displayed by using the Axis.setStep(double) property. Label attributes such as rotation, color and font are also accessible through the Axis.setLabelAngle(short), AxisSectionBase.setTextColor(java.awt.Color), and Axis.setFont(java.awt.Font) properties (of the Axis
Class
, respectively).
By default, Chart FX does not associate any labels to the categorical axis (X axis) and a "TAG" number will be shown. When you use this property, the TAG numbers will be replaced by settings specified in this property.
You can easily remove all labels set to a chart with the clearData(int) method.
getAxisX(),
getAxisY(),
Axis.setStep(double),
Axis.setLabelAngle(short),
AxisSectionBase.setTextColor(java.awt.Color),
Axis.setFont(java.awt.Font),
Axis.getLabel(int),
clearData(int),
Axispublic LegendBox getLegendBoxObj()
Allows you to assign supported attributes directly to the values legend box.
You must make sure the setLegendBox(boolean) is visible so you can see modifications set using properties of the LegendBox
Class
.
The values legend box is used to display legends associated with data points and is used to improve the chart's readability in charts like Pie, Doughnut and Pyramid where there's no axis, but point labels are still necessary in the chart.
Dragging the legend box (end user) is not supported but may be positioned in the chart area using the LegendBoxBase.setDocked(int) property. Functionality has been added to the legends to enhance the appearance in a docked position (left, right, top or bottom). For example, you can include borders around a legend or leave them in the default compacted view. By modifying visual attributes, the legend box appears to be floating but it is attach to a logical position that will change as the chart size changes.
Please refer to the LegendBox
Class
for all supported properties.
setLegendBox(boolean),
LegendBoxBase.setAutoSize(boolean),
LegendBoxBase.setBackColor(java.awt.Color),
LegendBoxBase.setDocked(int),
LegendBoxBase.setTextColor(java.awt.Color),
LegendBoxBase.getTitles(),
LegendBoxpublic int getLineStyle()
Gets the LineStyle. For more detail see setLineStyle(int).
public int getLineWidth()
Gets the LineWidth. For more detail see setLineWidth(int).
public Link getLink()
Gets the Link object for the chart.
Developers may obtain the Link
Class
for a UserLegendBoxItem using this property. Using the supported Link
Class
members, developers may configure a Link.setUrl(java.lang.String) and Link.setTarget(java.lang.String) for the object.
Link.setUrl(java.lang.String),
Link.setTarget(java.lang.String),
Linkpublic int getMarkerShape()
Gets the MarkerShape. For more detail see setMarkerShape(int).
public short getMarkerSize()
Gets the MarkerSize. For more detail see setMarkerSize(short).
public short getMarkerStep()
Gets the MarkerStep. For more detail see setMarkerStep(short).
public int getMenuBarObj(int n)
getMenuBarObj() instead.
public ToolBar getMenuBarObj()
Allows you to assign supported attributes directly the MenuBar object.
You must make sure the setMenuBar(boolean) is visible so you can see modifications set using properties of the MenuBar
Class
.
To change attributes of the MenuBar, please refer to the supported properties of the ToolBar
Class
.
ToolBar.setAutoSize(boolean),
ToolBar.setBackColor(java.awt.Color),
ToolBar.setCommands(SoftwareFX.ChartFX.CommandBar),
ToolBar.setDocked(int),
ToolBar.setHeight(int),
ToolBar.setVisible(boolean),
ToolBar.setWidth(int),
ToolBarpublic java.lang.String getMessageText(java.lang.String key)
Allows you to obtain default Chart FX stings which are displayed in the chart.
The key parameter is case sensitive, therefore you must use the exact pre-defined key value string.
You can use the Culture property to fully localize your charts. Elements that can be modified include the names of the culture, the writing system, and the calendar used, as well as formatting dates and strings.
The ValueFormat.setCulture(java.lang.String) property of the ValueFormat class allow you to assign culture specific formatting to labels and numbers for a selected axis.
The setMessageText(java.lang.String, java.lang.String) method may be used to modify these Chart strings. This method is only used to read the string for the specified string.
Pre-defined message identifiers with the defualt values for each key (key=value):
NoData=No Data Available
LicDownloading=Downloading License ...
DataDownloading=Downloading Chart ...
DataFailed=Failed to download Chart\n{0}
Mask.Percentage=%s\n%l\n%v out of %t\n(%p%%)
Mask.OHLC=%l\nOpen: %v2\nHigh: %v4 - Low: %v1\nClose: %v3
Mask.HLC=%l\nHigh: %v3 - Low: %v1\nClose %v2
Mask.Ini=%s\n%l\nFrom %i to\n%v
Mask.XY=%s\n%l\nX: %x, Y: %v
Mask.Between=%s\n%l - %l\n%v - %v
Mask.Default=%s\n%l\n%v
LegMask.Series=Series #{0}
LegMask.Values=Value #{0}
CFX61B0=A temporary file on {0} could not be created
XAxis=X Axis
YAxis=Y Axis
General=General
Series=Series
Chart=Chart Area
Draw=Drawing Area
AllSeries=All Series
Auto=Auto
None=None
Raised=Raised
Light=Light
Dark=Dark
Opposite=Opposite
Shadow=Shadow
Number=Number
Currency=Currency
Scientific=Scientific
Percentage=Percentage
Date=Short Date
LongDate=Long Date
Time=Time
DateTime=Date-Time
Label0=Horizontal
Label1=Vertical
Label2=45 Degrees
Inside=Inside
Outside=Outside
Cross=Across
ExportFilter=ChartFX File (*.cfx)|*.cfx|Text File (data only)|*.txt|XML File (properties only)|*.xml|Bitmap Image (*.bmp)|*.bmp|Metafile Picture (*.emf)|*.emf
ImportFilter=ChartFX Files (*.cfx)|*.cfx|Text Files (data only)|*.txt|XML Files(properties only)|*.xml
NoPermission=The application does not have enough permissions to execute this operation.
key - Pre-defined message identifier.ValueFormat.setCulture(java.lang.String),
setMessageText(java.lang.String, java.lang.String),
ValueFormatpublic int getNSeries()
Gets the NSeries. For more detail see setNSeries(int).
public int getNValues()
Gets the NValues. For more detail see setNValues(int).
public java.awt.Color getPageColor()
Gets the PageColor. For more detail see setPageColor(java.awt.Color).
public java.lang.String getPalette()
Gets the Palette. For more detail see setPalette(java.lang.String).
public Pane getPane(int n)
getPanes() instead.
PaneCollectionpublic PaneCollection getPanes()
Returns a selected Panes object.
This property exposes the members of the Pane
Class
. Please see the Pane
Class
for additional information regarding those supported members.
Panepublic int getPersonalizedFlags()
Gets the PersonalizedFlags. For more detail see setPersonalizedFlags(int).
public java.lang.String getPersonalizedName()
Gets the PersonalizedName. For more detail see setPersonalizedName(java.lang.String).
public int getPerspective()
Gets the Perspective. For more detail see setPerspective(int).
public PointAttributes getPoint(int series,
                                int point)
chart.getPoint()getItem instead.
getPoint()public PointAttributes getPoint(int point)
chart.getPoint()getItem instead.
getPoint()public PointAttributesCollection getPoint()
Assigns properties directly to a specific point in your chart.
Allows you to assign supported properties directly to the specified data point. For supported properties, please see the PointAttributes
Class
.
Below the second series third point has been set to red:
PointAttributes.setAlternateColor(java.awt.Color),
PointAttributes.setBorder(boolean),
PointAttributes.setColor(java.awt.Color),
PointAttributes.setCylSides(short),
PointAttributes.setColor(java.awt.Color),
PointAttributes.setMarkerShape(int),
PointAttributes.setPicture(java.awt.Image),
PointAttributes.setPointLabels(boolean),
PointAttributes.setSeparateSlice(short),
PointAttributespublic java.awt.Font getPointFont()
Gets the PointFont. For more detail see setPointFont(java.awt.Font).
public int getPointLabelAlign()
Gets the PointLabelAlign. For more detail see setPointLabelAlign(int).
public short getPointLabelAngle()
Gets the PointLabelAngle. For more detail see setPointLabelAngle(short).
public java.awt.Color getPointLabelColor()
Gets the PointLabelColor. For more detail see setPointLabelColor(java.awt.Color).
public java.awt.Font getPointLabelFont()
Gets the PointLabelFont. For more detail see setPointLabelFont(java.awt.Font).
public java.lang.String getPointLabelMask()
Gets the PointLabelMask. For more detail see setPointLabelMask(java.lang.String).
public java.awt.Point getPointLabelOffset()
Gets the PointLabelOffset. For more detail see setPointLabelOffset(java.awt.Point).
public Printer getPrinter()
Allows you to set properties to your chart for printing.
The Printer property provides the mechanism for assigning important properties to print the chart. You can modify the margins, paper orientation, color or pattern printing, among others. Please refer to the Printer
Class
for supported properties.
The Printer class supports a Print, PrintDialog, PrintPreview, and PageSetup methods which are only supported in desktop application development. Please see the Printer
Class
for all supported members.
Printer.setCompress(boolean),
Printer.setForceColors(boolean),
Printer.setMargins(java.awt.Rectangle),
Printer.setOrientation(int),
Printer.setUsePrinterResolution(boolean),
Printerpublic int getRightGap()
Gets the RightGap. For more detail see setRightGap(int).
public int getScheme()
Gets the Scheme. For more detail see setScheme(int).
public SeriesAttributes getSeries(int n)
getSeries() instead.
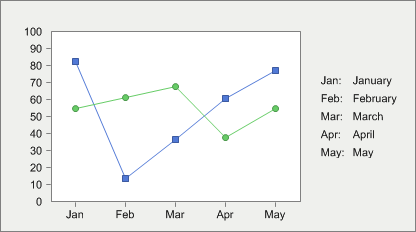
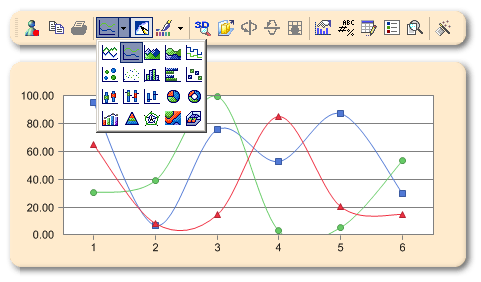
SeriesAttributesCollectionpublic SeriesAttributesCollection getSeries()
Assigns properties directly to the selected series in the chart.
Allows you to assign supported properties directly to the specified data series. For supported properties, please see the SeriesAttributes
Class
.
The Series property allows you to create charts with mixed SeriesAttributes.setGallery(int) types and assign specific colors to each series.
Below is an example of a MultiGallery chart (Bar & Lines):
SeriesAttributes.setColor(java.awt.Color),
SeriesAttributes.setGallery(int),
SeriesAttributespublic java.lang.String getSerKey(int i)
getSerKey() instead.
LabelListpublic LabelList getSerKey()
Set an abbreviated name for each series using a short string that will be displayed in the data editor.
The SerKey will be used in the series legend box if no getSerLeg(int) has been configured. You must enable the data editor in order to see the abbreviated series names.
The getSerLeg(int) property allows you to define longer strings for each series that will be displayed in the series legend box.
The getKeyLeg(int) property allows you to assign abbreviated labels for a categorical axis.
getSerLeg(int),
setSerLegBox(boolean),
getKeyLeg(int),
DataEditorpublic java.lang.String getSerLeg(int i)
getSerLeg() instead.
LabelListpublic LabelList getSerLeg()
An array property that allows you to set the series legend for the chart.
After setting these legends you can use the setSerLegBox(boolean) property to show or hide the legend box in the chart area.
To control how and where the series legend box is displayed on the chart, please refer to the alignment properties supported by the LegendBox
Class
.LegendBox
If what you want is associate legends to the tick marks in a categorical X axis, please refer to the Axis.getLabel(int) property in the axis object.
getLegend(int),
Axis.getLabel(int),
setSerLegBox(boolean),
getSerLegBoxObj(),
clearData(int),
Axis,
LegendBoxpublic LegendBox getSerLegBoxObj()
Allows you to assign supported attributes directly the series legend box.
You must make sure the setSerLegBox(boolean) is visible so you can see modifications set using properties of the ToolBarseries legend box.
The series legend defines exactly what each series in a chart represents. When you set the series legend box to visible, each series will be represented by a series legend key. By default, Chart FX will name each series by number (Series #1, Series #2, etc.), however, you may set each series' name by using the SerLeg property of the chart object.
Dragging the legend box (end user) is not supported but may be positioned in the chart area using the LegendBoxBase.setDocked(int) property. Functionality has been added to the legends to enhance the appearance in a docked position (left, right, top or bottom). For example, you can include borders around a legend or leave them in the default compacted view. By modifying visual attributes, the legend box appears to be floating but it is attach to a logical position that will change as the chart size changes.
Please refer to the LegendBox class for supported properties.
LegendBoxBase.setAlignment(int),
LegendBoxBase.setAutoSize(boolean),
LegendBoxBase.setBackColor(java.awt.Color),
LegendBoxBase.setDocked(int),
LegendBoxBase.setTextColor(java.awt.Color),
LegendBoxBase.getTitles(),
LegendBoxBase.setToolBorder(int),
LegendBox,
ToolBarpublic int getSmoothFlags()
Gets the SmoothFlags. For more detail see setSmoothFlags(int).
public int getStacked()
Gets the Stacked. For more detail see setStacked(int).
public Stripe getStripe(int n)
getStripes() instead.
public StripeCollection getStripes()
Allows you to assign attributes to a selected stripe object.
The Stripe.setAxis(int), Stripe.setColor(java.awt.Color), Stripe.setFrom(double) and Stripe.setTo(double) properties will allow you to customize the attributes of the Stripe
Class
.
Below is an example of a Stripe used to highlight a range in a chart:
Stripe.setAxis(int),
Stripe.setColor(java.awt.Color),
Stripe.setFrom(double),
Stripe.setTo(double),
Stripepublic int getStyleEx()
Gets the StyleEx. For more detail see setStyleEx(int).
public int getTemplateMask()
Gets the TemplateMask. For more detail see setTemplateMask(int).
public java.lang.String getTipMask()
Gets the TipMask. For more detail see setTipMask(java.lang.String).
public TitleDockable getTitle(int n)
getTitles() instead.
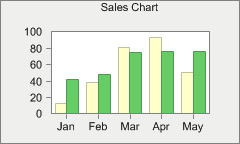
public TitleCollection getTitles()
Allows you to set a title to the top of a chart.
Using the numerical index, you can access multiple items of this collection.
The Title.setTextColor(java.awt.Color) property may be used to get or set the color of the title text; the Chart.setFont(java.awt.Font) Property can be used to configure a new font object for the title.
The title "Sales Chart" was configured in the following bar chart:
AxisBase.setTitle(SoftwareFX.ChartFX.Title),
Title.setTextColor(java.awt.Color),
Title.setFont(java.awt.Font),
Axis,
Titlepublic int getToolBarObj(int n)
getToolBarObj() instead.
public ToolBar getToolBarObj()
Allows you to assign supported attributes directly the ToolBar object.
You must make sure the setToolBar(boolean) is visible so you can see modifications set using properties of the ToolBar
Class
.
To change attributes of the ToolBar, please refer to the supported properties of the ToolBar
Class
ToolBar.setAutoSize(boolean),
ToolBar.setBackColor(java.awt.Color),
ToolBar.setCommands(SoftwareFX.ChartFX.CommandBar),
ToolBar.setDocked(int),
ToolBar.setHeight(int),
ToolBar.setShowImages(boolean),
ToolBar.setWidth(int),
ToolBarpublic int getTopGap()
Gets the TopGap. For more detail see setTopGap(int).
public int getTypeEx()
Gets the TypeEx. For more detail see setTypeEx(int).
public int getTypeMask()
Gets the TypeMask. For more detail see setTypeMask(int).
public UserLegendBox getUserLegendBoxObj()
Allows you to assign supported attributes directly the user legend box.
You must make sure the setUserLegendBox(boolean) is visible so you can see modifications set using properties of the UserLegendBox
Class
.
The user legend box allows you as the developer to create legends to provide essential information about a chart that normally cannot be relayed using the series legend box or the value legend box. The user legend must be filled manually by the programmer.
The UserLegendBox.getItem(int) property is used to create each key for the user legend.
Dragging the legend box (end user) is not supported but may be positioned in the chart area using the LegendBoxBase.setDocked(int) property. Functionality has been added to the legends to enhance the appearance in a docked position (left, right, top or bottom). For example, you can include borders around a legend or leave them in the default compacted view. By modifying visual attributes, the legend box appears to be floating but it is attach to a logical position that will change as the chart size changes.
The UserLegendBox class members are all supported by the user legend box.
LegendBoxBase.setAlignment(int),
LegendBoxBase.setAutoSize(boolean),
LegendBoxBase.setBackColor(java.awt.Color),
LegendBoxBase.setDocked(int),
LegendBoxBase.setTextColor(java.awt.Color),
LegendBoxBase.getTitles(),
LegendBoxBase.setToolBorder(int),
UserLegendBox
public double getValue(int series,
                       int point)
getValue() instead.
public ChartDataObj getValue()
Allows you to set the data values for the chart.
This property must be used with the openData(int, int, int) and closeData(int) methods, in conjunction with the COD.VALUES constant to specify the data type you are passing.
Once the chart has been populated using Value property, the DataEditor object allows users to view point values at runtime.
Please note that instead of the value associated with the point, you can assign a hidden constant which will cause the point to be hidden in the chart. Although a hidden point is physically in the data array, when you use this constant the marker will not appear in the chart, and if you have charts like a line or area chart, the line will break at that particular point.
Chart1.setValue(2,3, Chart.HIDDEN);
You can also assign XValues to create an XY Plot using the getXValue(int, int) member.
You can set initial values using the getIniValue(int, int) member. Used in conjunction with the Values property, you can create a 'floating bars' effect for bar charts.
getXValue(int, int),
getIniValue(int, int),
openData(int, int, int),
closeData(int),
recalcScale(),
SeriesAttributes,
LegendBox,
DataEditorpublic int getView3DDepth()
Gets the View3DDepth. For more detail see setView3DDepth(int).
public int getView3DLight()
Gets the View3DLight. For more detail see setView3DLight(int).
public short getVolume()
Gets the Volume. For more detail see setVolume(short).
public int getWallWidth()
Gets the WallWidth. For more detail see setWallWidth(int).
public double getXValue(int series,
                        int point)
getXValue() instead.
public ChartDataObj getXValue()
An array property that allows you to set X values to data points in a XY Plot.
In an XY Plot each point is defined by two coordinates, X and Y, with this property you can set the X coordinate and with the getValue(int, int) member you can set the Y coordinate of the point.
This property must be used with the openData(int, int, int) and closeData(int) methods, in conjunction with the COD.X_VALUES constant to specify the data type you are passing.
In an XY Plot, the X axis becomes a numerical axis where you can control scale values. Please refer to the Axis
Class
for more information on settings relating the configuration of the axes.
getValue(int, int),
openData(int, int, int),
closeData(int),
recalcScale(),
SeriesAttributes,
DataEditor,
LegendBox,
Axispublic java.lang.String getYLeg(int i)
getYLeg() instead.
LabelListpublic LabelList getYLeg()
Used to assign text labels to the Y axis.
This property is obsolete. You should use the legend property or the Axis.getLabel(int) property supported by the Axis
Class
.
Axis.getLabel(int),
getLegend(int),
getKeyLeg(int),
getSerLeg(int),
Axis
public void importChart(int format,
                        java.lang.String fileName)
Used to import a previously saved chart file, template or stream.
A chart file or template can be generated with the exportChart(int, java.lang.String) method or through the Chart FX setToolBar(boolean).
The XML enumeration is used to read chart properties in XML format. You can save chart properties from XML files using the exportChart(int, java.lang.String) method.
If an error is encountered, an exception will be thrown. Your development environment may allow you to catch this exception and add your own custom error messages. For more information regarding your own custom error messages, please refer to the Java API documentation.
format - Specify the file format to import.fileName - The path and filename to be imported.Parameter Values:
The available values for format are:
| Value | Description |
|---|---|
FileFormat.BINARY | Binary |
FileFormat.BINARY_TEMPLATE | Binary file with 'Template' FileMask pre-assigned |
FileFormat.XML | XML |
FileFormat.TEXT | Text File |
FileFormat.BITMAP | Bitmap |
FileFormat.METAFILE | Metafile |
FileFormat.JPEG | Jpeg (Only supported with Internet control) |
FileFormat.PNG | Png (Only supported with Internet control) |
FileFormat.EXTERNAL | Reads the sting (file extension) from the ImgTags property and uses an image writer to generate a chart in the configured format. (Only supported with Internet control) |
exportChart(int, java.lang.String)
public void importChart(int format,
                        java.io.InputStream stream)
Used to import a previously saved chart file, template or stream.
A chart file or template can be generated with the exportChart(int, java.lang.String) method or through the Chart FX setToolBar(boolean).
The XML enumeration is used to read chart properties in XML format. You can save chart properties from XML files using the exportChart(int, java.lang.String) method.
If an error is encountered, an exception will be thrown. Your development environment may allow you to catch this exception and add your own custom error messages. For more information regarding your own custom error messages, please refer to the Java API documentation.
format - Specify the file format to import.stream - Stream as System.IO.Stream.Parameter Values:
The available values for format are:
| Value | Description |
|---|---|
FileFormat.BINARY | Binary |
FileFormat.BINARY_TEMPLATE | Binary file with 'Template' FileMask pre-assigned |
FileFormat.XML | XML |
FileFormat.TEXT | Text File |
FileFormat.BITMAP | Bitmap |
FileFormat.METAFILE | Metafile |
FileFormat.JPEG | Jpeg (Only supported with Internet control) |
FileFormat.PNG | Png (Only supported with Internet control) |
FileFormat.EXTERNAL | Reads the sting (file extension) from the ImgTags property and uses an image writer to generate a chart in the configured format. (Only supported with Internet control) |
exportChart(int, java.lang.String)public boolean isAllowDrag()
Gets the AllowDrag. For more detail see setAllowDrag(boolean).
public boolean isAllowEdit()
Gets the AllowEdit. For more detail see setAllowEdit(boolean).
public boolean isBorder()
Gets the Border. For more detail see setBorder(boolean).
public boolean isChart3D()
Gets the Chart3D. For more detail see setChart3D(boolean).
public boolean isCluster()
Gets the Cluster. For more detail see setCluster(boolean).
public boolean isContextMenus()
Gets the ContextMenus. For more detail see setContextMenus(boolean).
public boolean isCrossHairs()
Gets the CrossHairs. For more detail see setCrossHairs(boolean).
public boolean isDataEditor()
Gets the DataEditor. For more detail see setDataEditor(boolean).
public boolean isDirty()
Gets the Dirty. For more detail see setDirty(boolean).
public boolean isLegendBox()
Gets the LegendBox. For more detail see setLegendBox(boolean).
public boolean isMenuBar()
Gets the MenuBar. For more detail see setMenuBar(boolean).
public boolean isMultipleColors()
Gets the MultipleColors. For more detail see setMultipleColors(boolean).
public boolean isPointLabels()
Gets the PointLabels. For more detail see setPointLabels(boolean).
public boolean isScrollable()
Gets the Scrollable. For more detail see setScrollable(boolean).
public boolean isSerLegBox()
Gets the SerLegBox. For more detail see setSerLegBox(boolean).
public boolean isShowTips()
Gets the ShowTips. For more detail see setShowTips(boolean).
public boolean isToolBar()
Gets the ToolBar. For more detail see setToolBar(boolean).
public boolean isUserLegendBox()
Gets the UserLegendBox. For more detail see setUserLegendBox(boolean).
public boolean isView3D()
Gets the View3D. For more detail see setView3D(boolean).
public boolean isZoom()
Gets the Zoom. For more detail see setZoom(boolean).
public java.awt.Point markerToPixel(int series,
                                    int point)
Returns a point object with the position for a specified chart marker.
When this method is applied to a bar chart, the point object is from the top center of the select bar.
This method may be used in conjunction with annotation objects. You may position annotation objects with chart markers very easily by extracting the X and Y values from the returned point object.
series - An integer specifying the series.point - An integer specifying the point.AnnotationObject
public void openData(int cod,
                     int n1,
                     int n2)
Opens a communications channel to pass data to the chart.
For each OpenData method call there must be a closeData(int) method call with the same constant used in the OpenData method.
Sometimes it is very costly to specify the amount of points you are going to pass to the chart. For example, if you are pulling the data from a database and you must fetch all records to know the number of points you are going to feed to the chart. You can use the Unknown constant to let Chart FX size the data array dynamically as it receives new points, as follows:
chart1.openData(COD.VALUES,1,COD.UNKNOWN);
All other COD enumerations available can be applied to the chart using the Or (bitwise) operator. For example, the correct way of invoking a combination of channel and style is as follows:
Chart.OpentData
Chart.Values
Chart.CloseData
chart1.openData(COD.VALUES | COD.ADD_POINTS, 1, 10);
Note: bitwise operator CAN NOT be used to open twho channel types at the same time, these must be open separately and closed separately. An example of a wrong usage is:
chart1.openData(COD.VALUES | COD.XVALUES, 1, 10);
Please note that instead of the value associated with the point, you can assign a hidden constant which will cause the point to be hidden in the chart. Although a hidden point is physically in the data array, when you use this constant the marker will not appear in the chart, and if you have charts like a line or area chart, the line will break at that particular point.
chart1.setValue(2,3, CHART_HIDDEN);
When using the COD.Unknown enumeration with the OpenData method, you may need to cast the constant type as 'int':
chart1.openData(COD.VALUES, 1, (int) COD.UNKNOWN);
cod - This is a combination (bitwise) of the channel and/or styles from the COD types.n1 - When using COD.Values, this integer will set the number of series in the chart.n2 - When using COD.Values, this integer will set the number of points in the chart.Parameter Values:
The available values for cod are:
| Value | Description |
|---|---|
COD.UNCHANGE | Modify a specific point value within a chart without changing the other series and point assignments. |
COD.VALUES | Data point values. |
COD.CONSTANTS | Constant Lines. |
COD.COLORS | Colors. |
COD.STRIPES | Stripes. |
COD.INI_VALUES | Initial values for Gantt or floating bar charts. |
COD.XVALUES | X values for XY Plots. |
COD.TITLES | Titles. |
COD.NO_ALLOC | For internal use only. Do not use this value. |
COD.ALLOC_HIDDEN | Allocates memory for points that are defined in the OpenData communication channel, but are not passed values. This flag treats these points as if they were hidden. |
COD.INSERT_POINTS | Used in real-time charts to insert points into the beginning of the chart forcing the chart to scroll to the right. |
COD.REAL_TIME | For RealTime charts. Do not scroll. |
COD.REAL_TIME_SCROLL | For RealTime charts. Scroll to the last acquired point. |
COD.ADD_POINTS | RealTime Usage. Relative pointer access. |
COD.REMOVE | Delete all data related to the appropriate Constants (e.g. Values). |
COD.NO_INVALIDATE | Do not invalidate chart for repainting. |
COD.SCROLL_LEGEND | Scroll Legends in RealTime charts. |
COD.UNKNOWN | Allows Chart FX to size the data array dynamically as it receives new points. Used when the number of points or series is unknown. |
getValue(int, int),
getIniValue(int, int),
closeData(int),
recalcScale(),
SeriesAttributes,
Stripe,
ConstantLine
public void paint(java.awt.Graphics2D graphics2D,
                  int x,
                  int y,
                  int width,
                  int height,
                  int paintFlags)
Allows you to paint the chart in a given device context.
This function is very useful when you want to print charts and others objects in the same page or more than one chart in a page.
graphics2D - x - y - width - height - paintFlags - The style used to paint the area.Parameter Values:
The available values for paintFlags are:
| Value | Description |
|---|---|
PaintFlags.NORMAL | Uses normal drawing rules. |
PaintFlags.PRINT | Rescales chart to use printer margins and printer resolution. |
PaintFlags.BACKGROUND | Includes the background. You may not want the background in order to save printer resources. |
PaintFlags.BORDER | Will paint the borders. |
PaintFlags.METAFILE | Used when the Graphics Object is a Metafile type. |
Printerpublic void recalcScale()
Resets and recalculates all scale values.
This method is automatically invoked after the closeData(int) method to allow Chart FX to recalculate all scale values associated with all numerical axes in the chart. With this method, you let Chart FX set the AxisBase.setMin(double), AxisBase.setMax(double) and Axis.setStep(double) properties.
This method should be invoked to force Chart FX to calculate the Min, Max and Step for the axes.
Please keep in mind that this method reads the entire data array, so abusing this method could affect the performance of your application, as Chart FX will read the entire data array every time this method is called.
This method will not affect the Axis.setStep(double) and Axis.setMinorStep(double) if they have been previously set. To make sure they respond to this method make sure the Step and MinorStep properties are set to zero (0).
A typical case of when to use this method is when you disable the Axis.setAutoScale(boolean) property to calculate your AxisBase.setMin(double) and AxisBase.setMax(double) and you set new data to the chart that causes the scale values to be recalculated to show the appropriate data.
When using a setStacked(int) style chart, recalculating the scale will sometimes make the chart more readable.
AxisBase.setMin(double),
AxisBase.setMax(double),
Axis.setStep(double),
Axis.setMinorStep(double),
Axis.setAutoScale(boolean),
setStacked(int),
Axispublic void setAllowDrag(boolean value)
Enables or prevents the end user from dragging a marker with the mouse to change its value.
When performing a marker drag the end user will be able to change the data point value and a Tooltip will appear.
If you want to prevent the user from changing existent values in the chart, you should also set the setAllowEdit(boolean) property to False.
setAllowEdit(boolean)public void setAllowEdit(boolean value)
Enables or prevents the end user from altering data through the data editor.
Use this property if you don't want the end user to change the existing data by using the data editor. Although the data editor may be displayed, it will not allow the user to double click a cell in the grid to change its value.
By default, an end user is able to change data using the Data Editor; however, this only changes values in the chart not a bound database.
setStyleEx(int),
setDataEditor(boolean),
DataEditorpublic void setAngleX(int value)
Allows you to set a 3D rotation angle around the X-axis.
The value can be set to an integer between [0-90] or [270-360] indicating the degree of rotation around the X-axis.
This property can only be used when the chart is in 3D view. So, be sure the setChart3D(boolean) and the setView3D(boolean) properties are set to True.
To avoid jagged lines we recommend you use prominent angles (for example: 0,30,45,60,90, etc).
To set a Y-axis rotation angle, please refer to the setAngleY(int) property.
setAngleY(int),
setView3D(boolean),
setChart3D(boolean)public void setAngleY(int value)
Allows you to set a 3D rotation angle around the Y-axis.
The value can be set to an integer between [0-90] or [270-360] indicating the degree of rotation around the Y-axis.
This property can only be used when the chart is in 3D view. So, be sure the setChart3D(boolean) and the setView3D(boolean) properties are set to True.
To avoid jagged lines we recommend you use prominent angles (for example: 0,30,45,60,90, etc).
To set a X-axis rotation angle, please refer to the setAngleX(int) property.
setAngleX(int),
setView3D(boolean),
setChart3D(boolean)public void setAxesStyle(int value)
Used to change the style of the axes surrounding the chart area.
AxesStyle : Define the style for the axes surround the chart area. | Value | Description |
|---|---|
AxesStyle.NONE | No frame is displayed around the axis. |
AxesStyle.FRAME_3D | A 3D frame will be shown as the axis. |
AxesStyle.MATH | Only tickmarks will be shown as the axis. |
AxesStyle.FLAT_FRAME | A single, flat frame is displayed in the axis. |
The AxesStyle property sets the selected style to all axes of a chart.
Toggling the chart from 2D and 3D modes will product different effects.
getAxis(int),
setChart3D(boolean),
Axis.setStep(double),
Axis.setMinorStep(double)public void setBackColor(java.awt.Color value)
Gets or sets the chart background color.
This property was formerly called RgbBk which is now obsolete.
You can customize the color of the inside charting area by using the setInsideColor(java.awt.Color) property.
Setting the BackColor to transparent is only supported when generating PNG images using the Chart FX web control. The BackColor may not be set to transparent when developing Chart FX desktop applications and .NET Client Control web applications.
A gradient may be assigned to the background using the setBackObject(SoftwareFX.ChartFX.IAdornment) property.
For more information regarding the Color type, please refer to the Java API Documentation.
Here the BackColor of the Chart has been set to Yellow:
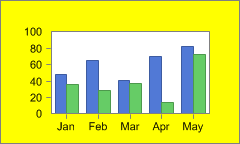
setInsideColor(java.awt.Color),
setBorderColor(java.awt.Color)public void setBackgroundImage(java.awt.Image value)
setBackObject(SoftwareFX.ChartFX.IAdornment) instead.
public void setBackObject(IAdornment value)
Allows you to assign a gradient or an image to the background of a chart.
In order to set a gradient, you must set the setScheme(int) to Scheme.Gradient for the chart.
Once you have created a gradient using the GradientBackground.setAngle(float), GradientBackground.getColor(int), GradientBackground.getFactor(int) and GradientBackground.getPosition(int) properties, you will need to assign the gradient object to the BackObject.
You can use the setInsideBackObject(SoftwareFX.ChartFX.IAdornment) to assign a gradient to the inside chart area, however is only supported in 2D charts.
Each chart has only one BackObject. Gradients may be applied to the BackObject of both 2D and 3D charts.
Below is a Gradient assigned to the BackObject:
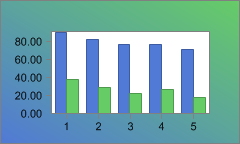
GradientBackground.setAngle(float),
GradientBackground.getColor(int),
GradientBackground.getFactor(int),
setInsideBackObject(SoftwareFX.ChartFX.IAdornment),
GradientBackground.getPosition(int),
setScheme(int),
GradientBackground,
ImageBackgroundpublic void setBorder(boolean value)
Shows or hides the marker borders for all data series in the chart.
This property applies to all data series in the chart, if you want it to apply to a specific point or series please refer to the PointAttributes.setBorder(boolean) border properties.
The effect of this property on 2D line charts is slightly different, as follows:
When set to True, the 2D line color will be equal to the color set with the setBorderColor(java.awt.Color) property. (setBorderEffect(int) must be BorderEffect.None)
When set to False, the 2D line color will be equal to the series color assigned with the SeriesAttributes.setColor(java.awt.Color) property.
To set the Border Style and Width, please refer to the setLineStyle(int) and setLineWidth(int) properties respectively.
setBorderEffect(int),
setBorderColor(java.awt.Color),
setLineStyle(int),
setLineWidth(int),
SeriesAttributes.setColor(java.awt.Color),
PointAttributes,
SeriesAttributespublic void setBorderColor(java.awt.Color value)
Gets or sets the border color for all data series in the chart.
In order for this property to take effect, you must set the setBorderEffect(int) to BorderEffect.None.
When setting this property, make sure the border for the selected series is visible by using the setBorder(boolean) property.
This property applies to all data series in the chart, if you want it to apply to a specific series please refer to the Point
Class
PointAttributes.setBorderColor(java.awt.Color) property.
When you set this property to a particular color for a 2D line chart, only the point marker borders will have the color.
To set the Border Style and Width, please refer to the setLineStyle(int) and setLineWidth(int) properties respectively.
For more information regarding the Color type, please refer to the Java API Documentation.
Below the BorderColor has been set to Red:
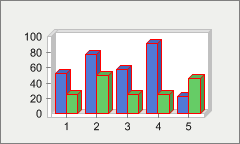
setBorder(boolean),
setLineStyle(int),
setLineWidth(int),
SeriesAttributes.setColor(java.awt.Color),
SeriesAttributes,
PointAttributespublic void setBorderEffect(int value)
Alters the visual effect of the border surrounding the chart area as well as the border between the series.
BorderEffect : Specify different border effects that may be applied to a object.| Value | Description |
|---|---|
BorderEffect.NONE | No border effect is applied. The border effect must be None for the BorderColor property to take effect. |
BorderEffect.RAISED | The border has raised inner and outer edges. |
BorderEffect.LIGHT | Apply light color to the border using the series/points color. |
BorderEffect.DARK | Apply dark color to the border using the series/points color. |
BorderEffect.OPPOSITE | Chooses between dark and light border depending on the object color. If the color is dark Chart FX will choose a light border color. If the color is light Chart FX will choose a dark border color. |
BorderEffect.SHADOW | The border will have shadow. |
The setBorder(boolean) property must first be set to True in order for the property to have any effect.
You must set the BorderEffect to BorderEffect.None when assigning a colored border using the setBorderColor(java.awt.Color) property.
setBorder(boolean),
setBorderColor(java.awt.Color),
SeriesAttributes,
PointAttributespublic void setBorderObject(IAdornment value)
Gets or sets a default or image border to the chart.
This property allows users to assign attributes directly to the border object of a chart.
The BorderObject property is used when setting default and image borders to the chart. In order to assign a default or image border, you must create a new defaultborder or imageborder object:
ImageBorder (Embed):
chart1.setBorderObject(new ImageBorder(ImageBorderType.EMBED));
Chart1.BorderObject.Type = ImageBorderType_Embed
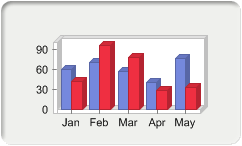
DefaultBorder (Raised):
chart1.setBorderObject(new DefaultBorder(BorderType.RAISED));
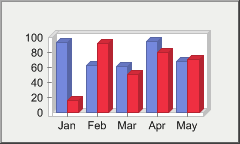
To remove the border from the chart, you can use the 'None' enumeration:
chart1.BorderObject = new DefaultBorder(BorderType.None);
The Chart FX ImageBorders use shading to give a multidimensional effect. The setPageColor(java.awt.Color) property can be used to modify the background color of the shaded area around ImageBorders.
You can also access the border object color attribute by the following:
chart1.getBorderObject().setColor(java.awt.Color.red);
setBorder(boolean),
setBorderColor(java.awt.Color),
DefaultBorder,
ImageBorderpublic void setBottomGap(int value)
Defines the bottom margin between the chart and the bounding rectangle.
The specified value sets the distance in pixels between the border of the bounding rectangle and the chart.
setTopGap(int),
setRightGap(int),
setLeftGap(int)public void setChart3D(boolean value)
Toggles the chart between 2D and 3D modes.
When set to True the chart is displayed in 3D.
Most Chart FX charts are supported in both 2D and 3D modes. If you want to change the chart type please refer to the setGallery(int) property.
The following is a 3D Line Chart:
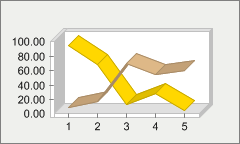
setCluster(boolean),
setGallery(int),
setView3D(boolean),
setView3DDepth(int),
setView3DLight(int)public void setChartStyle(int value)
Allows you to restrict or allow end-user access to several functions provided through the Chart FX end-user interface.
ChartStyle : Define end user access to several functions provided through the Chart FX end user interface. | Value | Description |
|---|---|
ChartStyle.TIPS | See ShowTips property. |
ChartStyle.MENUS_ON_DEMAND | See ContextMenus property. |
ChartStyle.ALLOW_DRAG | See AllowDrag property. |
ChartStyle.SCROLLBARS | If this flags is turn off, the scrollbars will not appear even if the user zooms the chart. |
ChartStyle.CHANGE_STEP | Allows the end user to change major and minor steps in any of the axis. |
ChartStyle.GALLERY | Allows the end user to see and change the chart gallery and the gallery of each series. |
ChartStyle.MULTITYPE | Obsolete. Do not use. |
ChartStyle.CHANGE_3D | This will permit the end user to switch to 3D view for any type of chart that is being displayed in 2D. |
ChartStyle.SCALE | This will permit the end user to change scale used on the Y-axis from the options dialog. |
ChartStyle.TITLES | This will permit the end user to change the text being assigned to the different titles supported (Top, Bottom, Right or Left). |
ChartStyle.FONTS | This will permit the end user to change the fonts used in any of the titles supported. |
ChartStyle.EDITABLE | Same as AllowEdit Property. |
ChartStyle.FILE_EXPORT | This will permit the end user to export (save) the current to a file. |
ChartStyle.FILE_IMPORT | This will permit the end user to import (open) a previously saved chart. |
ChartStyle.SCROLLABLE | Same as Scrollable property. |
ChartStyle.PRINTABLE | This will permit the end user to print the contents of the chart window. |
ChartStyle.CHANGE_3D_VIEW | This will permit the end user to modify the 3D View by accessing the 3D dialog where the user can rotate the view around the x or Y-axis. |
ChartStyle.GRID | This will permit the end user to modify the actual gridlines (Vertical, Horizontal or None) being displayed in the chart. |
ChartStyle.RESIZEABLE | Same as AllowResize property. |
ChartStyle.LOGSCALE | Obsolete. Do not use. |
ChartStyle.COPY | This will permit the end user to copy bitmap or data of actual chart to the clipboard. |
ChartStyle.CLOSEABLE | When having an Overlapped chart window, this will permit the end user to close the chart from the system menu. |
ChartStyle.DEFAULT | This will grant the user to have default access to the chart functions. |
ChartStyle.ALL | This will permit the end user to access all the functions explained above. |
This property is a mask property. This means all settings represent a bit in the word that you need to turn on or off according to what you want. For this purpose you will need to use the bitwise operators (And, Or, Not, Xor) provided by your development tool.
Because it is a mask property, you must make sure you use these operators to turn on/off bits and avoid losing previous settings to the property.
For example, if you want to turn ON the ChangeStep setting the correct way of setting this property is:
chart1.setChartStyle(chart1.getChartStyle() | ChartStyle.CHANGE_STEP);
If you type the following code:
chart1.setChartStyle(ChartStyle.CHANGE_STEP);
(WRONG!)
You will erase all other settings in the property causing an erratic behavior of the library and an incorrect setting of the individual properties which also control these flags.
setStyleEx(int),
setTypeEx(int)public void setCluster(boolean value)
Displays a z-clustered 3D chart.
When set to True the chart will show as clustered, when set to False the chart displays the series side-by-side.
When setting this property you must make sure the chart is displayed in 3D mode (setChart3D(boolean) property) and that the chart is cluster capable (BAR, LINES or GANTT chart).
When displaying a clustered chart, each series will have its own position in the z axis. This means, if this property is set to true each data series will occupy one row of data.
AREA charts are always clustered as there is no way to paint different series side by side. On the other hand, if you have a BAR chart, it is possible to paint bars side-by-side and not clustered in the z-axis.
Below is an example of a clustered bar chart:
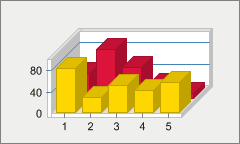
setGallery(int),
setChart3D(boolean)public void setContextMenus(boolean value)
Allows you to enable or disable context sensitive menus when the user right clicks a particular Chart FX element.
This property allows the end user to easily alter various chart elements rather than finding the appropriate dialog in the chart tabbed dialog. Therefore, we strongly recommend the use of this setting.
This is the context menu activated when right-clicking on a point marker while the ContextMenus property is set to True:
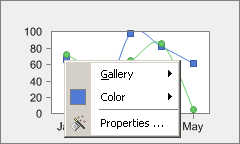
setStyleEx(int)public void setCrossHairs(boolean value)
Enables or disables Cross-Hairs markers in the chart.
When set to true the end user will be able to see the cross-hair markers.
If enabled, the end user will view a Cross-Hairs marker and a tooltip showing the point index and the value, when he presses the left button of the mouse. The Cross-Hairs marker will disappear when the user releases the button.
If the GetTipDrag enumeration of setTypeEx(int) property is enabled, along with the Cross-Hairs, the GetTip event sends a request to customize the ToolTip shown while moving the crosshairs. In this case, parameters nSerie and nPoint contain the position in pixels of the mouse, relative to the chart object.
setTypeEx(int)public void setCulture(java.lang.String value)
Allows you to localize charts for a specific language and region.
Culture attributes set with this property will effect the entire chart, if no attributes are set using this property then Chart FX inherits the current Thread culture. For more information please see the Thread class in the Java API Documentation.
The ValueFormat class supports a ValueFormat.setCulture(java.lang.String) property that allows you to set the culture for axes and values, not the entire chart.
If no attributes are set using this property or the Chart class setCulture(java.lang.String) property, then Chart FX inherits the system culture.
When setting this property, you may need the Languaje Code and/or Country Code constants for the desired culture. For more information, please refer to the java.util.Locale documentation.
Example:
chart1.getAxisY().getLabelsFormat().setCulture("es-ES");
ValueFormat.setCulture(java.lang.String),
setMessageText(java.lang.String, java.lang.String),
ValueFormatpublic void setCylSides(short value)
Sets a 3D cylindrical or conical shape to all data series in a chart.
This property has read/write permissions, so you can set or get the CylSides for all the series in the chart.
This property can only be applied to BAR, CUBES or GANTT charts. When specifying a large number of sides in the base (i.e. -32 or 32) it may be a good idea to remove the border (setBorder(boolean) Property), this will create a seamless color effect on the marker.
With this property you will set all data series to a conical or cylindrical shapes. If you want combine Cylinders with Cones or if you want to apply this effect to a particular series in the chart, please refer to the PointAttributes.setCylSides(short) property in the PointAttributes
Class
.
Setting this property to a positive number [1,32] will create a cylindrical shape.
Setting this property to a negative number [-32,-1] will create a conical shape. For example if you want to convert bars into pyramids (base 3) you can set the value of this property to -3.
Here is an example of the CylSides property set to a base of 24:
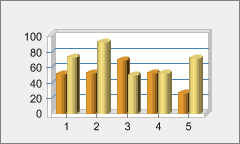
setBorder(boolean),
PointAttributes.setCylSides(short),
SeriesAttributes,
PointAttributespublic void setDataEditor(boolean value)
Allows you to show or hide the Data Editor in the chart area.
The Data Editor is a spreadsheet that shows the data points in tabular format. When shown, it allows the user to see both the chart and the grid at the same time.
Because the data editor is a Chart FX tool, you can configure its position and attributes within the chart area.
If you want to control where and how the Data Editor is shown refer to the different properties supported by the DataEditor
Class
.
Here is a chart with the data editor enabled:
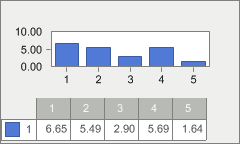
getDataEditorObj(),
DataEditorpublic void setDataSource(IDataProvider value)
Gets or sets the source containing the values used to populate the chart.
This property is used in conjunction with the DataSourceSettings.setDataStyle(int) and DataSourceSettings.getDataType(int) properties to bind Chart FX to a Data Control.
Once the DataSource has been configured using this property, the chart is automatically bound to the data.
When reading data from arrays, you will need to create the ListProvider object and use that as the DataSource:
chart1.setDataSource(new ListProvider(myArrayVariable));
When reading data from text files, you will need to create the TextProvider object and use that as the DataSource:
chart1.setDataSource(new TextProvider("TextFile.txt"));
DataSourceSettings.setDataStyle(int),
DataSourceSettings.getDataType(int),
openData(int, int, int),
closeData(int),
ListProvider,
TextProviderpublic void setDataStyle(int value)
Controls how Chart FX plots the fields in the resultset.
In other words, this property specifies what field types should be considered when data is passed to the chart.
DataStyle : Define the data column styles.| Value | Description |
|---|---|
DataStyle.DEFAULT | Use Chart FX default field assignments. |
DataStyle.NO_MIN_MAX | Do not assign a Min and Max based on data field values. |
DataStyle.TRANSPOSE | See Remarks. |
DataStyle.USE_BLOB_TEXT | Use as text from a "binary large object". |
DataStyle.KEEP_SER_LEG | Keep preset series legends. |
DataStyle.KEEP_LEGEND | Keep preset legends. |
DataStyle.ALLOC_HIDDEN | Instructs Chart FX to plot missing values in data fields as hidden points. |
DataStyle.READ_XVALUES | Instructs Chart FX that the data read will include both values and x values. |
DataStyle.READ_INI_VALUES | Instructs Chart FX that the data read will include both values and initial values. |
DataStyle.DATES_AS_LABELS | Instructs Chart FX to use date values as labels. |
This property is used in conjunction with the getDataType(int) property to control how Chart FX takes the information from a Data Control.
Please note that instead of the value associated with the point, you can assign a hidden constant which will cause the point to be hidden in the chart. Although a hidden point is physically in the data array, when you use this constant the marker will not appear in the chart, and if you have charts like a line or area chart, the line will break at that particular point.
chart1.setValue(2,3, CHART_HIDDEN);
Chart FX includes two data style flags that will instruct the component to expect values and X Values or to expect both values and initial values in the data array.
For example, lets say that your data looks like this and you want to plot an XY chart:
1 200 3 400
2 100 6 300
When you set the datastyle to ReadXValues, the data will be passed to the chart like:
chart1.XValue[0,0] = 1;
chart1.Value[0,0] = 200;
chart1.XValue[1,0] = 3;
chart1.Value[1,0] = 400;
chart1.XValue[0,1] = 2;
chart1.Value[0,1] = 100;
chart1.XValue[1,1] = 6;
chart1.Value[1,1] = 300;
chart1.setXValue(0,0,1);
chart1.setValue(0,0,200);
chart1.setXValue(1,0,3);
chart1.setValue(1,0,400);
chart1.setXValue(0,1,2);
chart1.setValue(0,1,100);
chart1.setXValue(1,1,6);
chart1.setValue(1,1,300);
The ReadIniValues will do the same except will set initial values using the IniValue property.
Transposing Data
ChartFX uses any numerical columns in your SQL statement as data series and each record in your SQL statement as values, e.g.
SELECT CharField,NumField1,NumField2 FROM Table
will create a chart with two series and CharField will be used as the X axis labels. If this SQL statement returns 5 records, the chart will contain 2 lines (assuming it is a line chart) and each line will have 5 point markers. If you want to create a chart with 5 lines (each with two point markers) you would use the Transpose before the DataSource Call:
chart1.setDataStyle(chart1.getDataStyle() | DataStyle.TRANSPOSE);
chart1.setDataSource(DataTable);
Chart FX will take all string and date fields to construct a long string that will be used as a legend for each point in the chart. If you want to avoid this behavior just turn OFF the appropriate constants in this property or control the fields Chart FX will use from the Data Control with the DataType property.
With this property you can overwrite the default rules Chart FX use to take information from the Data Control. These default rules are intelligent enough to pick the information from the database and assign the legends. So if you send a SELECT statement, Chart FX will create the chart series and point legends automatically. These rules are:
1) Series Legends will be taken from the numerical field names.
2) All numerical columns will be plotted as different series and all string and/or date columns will be plotted as point legends (joined by the '-' character).
3) All string and numerical fields specified in the SELECT statement will be plot.
This property is a mask property, this means all settings represent a bit in the word that you need to turn on or off. For this purpose you'll use the bitwise operators (And, Or, Not, Xor) provided by your development tool.
Because it is a mask property, you must make sure you use these operators to turn on/off bits and avoid losing previous settings to the property.
For example, if you want to turn on NoMinMax
The right way of setting this property is:
chart1.setDataStyle(chart1.getDataStyle() | DataStyle.NO_MIN_MAX);
If you type the following code:
chart1.setDataStyle(DataStyle.NO_MIN_MAX);
you will erase all other settings in the property causing an erratic behavior of the library and an incorrect setting of the individual properties which also control these flags.
setDataSource(SoftwareFX.ChartFX.IDataProvider),
getDataType(int),
openData(int, int, int),
closeData(int)
public void setDataType(int n,
                        int value)
getDataType() instead.
public void setDesignTimeData(java.lang.String value)
Used to set data for charts at design time.
This string property allows you to configure the path to a text file to be used as data at design time. Once the application is run, the design-time data will be used for the chart at runtime unless otherwise specified by the developer.
The design-time wizard utilizes this property when creating charts, as many of the chart types rely on fixed data for proper gallery representation.
If you use the openData(int, int, int) or closeData(int) methods, Chart FX will disregard the configured DesignTimeData and use the data passed to the chart. If no data is passed, random data will be used to populate the chart.
The text file format used to configure this property is exactly the same as the supported format of the TextProvider
Class
. To create supported data text file, please see the TextProvider section of the Resource Center.
When this property is configured, the setNValues(int) and setNSeries(int) design time properties have no effect on a chart. The number of series and points in the chart will be determined by the design time data configured.
setNSeries(int),
setNValues(int),
openData(int, int, int),
closeData(int),
TextProviderpublic void setDirty(boolean value)
Returns a boolean specifying if the chart has been modified by the user.
If a user makes any modification to the chart the return value of this read property will be True, else False.
setPersonalizedFlags(int)public void setFileMask(int value)
Allows you to customize what to save in the chart when using the exportChart(int, java.lang.String) method.
FileMask : Define what to save in the chart when using the Export method with CfxOleFile option. | Value | Description |
|---|---|
FileMask.GENERAL | Save Chart Type and general effects in the chart file. |
FileMask.FONTS | Save font settings in the chart file. |
FileMask.SCALE | Save axes scale in the chart file. |
FileMask.TITLES | Save titles in the chart file. |
FileMask.MULTI | Save Multitype settings (except colors) in the chart file. |
FileMask.COLORS | Save colors in the chart file. |
FileMask.TEMPLATE | Save a chart template (.cht) which could be later imported into Chart FX. |
FileMask.LABELS | Save legends in the chart file. |
FileMask.SIZE_DATA | Save just the number of points and series (not the data) in the chart file. |
FileMask.DATA | Save numeric data in the chart file. |
FileMask.ELEMENTS | Save Constant lines and color stripes in the chart file. |
FileMask.TOOLS | Save tools and additional customizations in the chart file. |
FileMask.EXTENSIONS | Save active extensions and their settings in the chart file. |
FileMask.PRINTER_INFO | Save special printer information in the chart file. |
FileMask.PICTURES | Saves image information in the chart file. |
FileMask.LICENSE | Saves license information in the chart file. |
FileMask.INTERNET | Saves domain information about the chart's parent website. |
FileMask.ALL | Save all chart settings (all of the above) in the chart file. |
FileMask.DATA_BIND | Save all current data with the chart file. |
FileMask.REUSE_EXTENSIONS | Used with OLAP Extension. Saves all the dimension and level information in the chart file so that it may be reused with new data values. |
When using the FileMask Property, you must make sure you are exporting the chart to a 'Binary' or 'XML' file type. These are the only file types that support saving of the FileMask flag attributes.
Please note settings in this property will be used by the exportChart(int, java.lang.String) method when saving a chart file. By default the setting of this property is 'All' so all chart settings are actually saved in the chart file.
This property is particularly useful because it allows you to customize how chart files are saved, this way you can build your own chart templates.
The ReuseExtension flag is used in combination with other Chart FX Extensions. At this time only the OLAP Extension actually utilizes the functionality. The flag instructs Chart FX to save all the "dimension" and "level" information in an OLAP chart so it may be reused with new OLAP data.
This property is a mask property, this means all settings represent a bit in the word that you need to turn on or off according to what you want. For this purpose you'll need to use the bitwise operators (And, Or, Not, Xor) provided by your development tool.
Because it is a mask property, you must make sure you use these operators to turn on/off bits and avoid losing previous settings to the property.
For example, if you want to turn ON the 'Tools' setting
The right way of setting this property is:
chart1.setFileMask(chart1.getFileMask | FileMask.TOOLS);
If you type the following code:
chart1.setFileMask(FileMask.TOOLS);
(WRONG!)
you will erase all other settings in the property causing an erratic behavior of the library when saving files.
exportChart(int, java.lang.String)public void setGallery(int value)
Sets the chart type.
Gallery : Defines the chart type.| Value | Description |
|---|---|
Gallery.LINES | Line Chart. |
Gallery.BAR | Bar Chart. |
Gallery.CURVE | Spline Curve chart. |
Gallery.SCATTER | Scatter or XY Plot. |
Gallery.PIE | Pie Chart. |
Gallery.AREA | Area Chart. |
Gallery.PARETO | Pareto Chart. |
Gallery.STEP | Step Lines Chart |
Gallery.HI_LOW_CLOSE | Hi-Low-Close Chart. |
Gallery.SURFACE | Surface Plot. |
Gallery.RADAR | Radar Chart. |
Gallery.CUBE | Cubes Chart. |
Gallery.DOUGHNUT | Doughnut Chart. |
Gallery.PYRAMID | Pyramid Chart. |
Gallery.BUBBLE | Bubble Chart. |
Gallery.OPEN_HI_LOW_CLOSE | Open-Hi-Lo-Close Chart. |
Gallery.CANDLESTICK | CandleStick Chart. |
Gallery.CONTOUR | Contour Chart. |
Gallery.CURVE_AREA | Curve Area Chart. |
Gallery.GANTT | Horizontal Bar Chart. |
When you set the gallery with this property it applies to all the series in the chart. If you want to create a Multitype (or combination chart) please refer to the Series object SeriesAttributes.setGallery(int) property.
When selecting a Gallery for charts, keep in mind the number of data series which will be included in the chart. Pie, Pyramid and Doughnut chart types can only display one series per chart. If you have multiple data series, you may want to select a Gallery type that supports one that one series.
Creating a gallery object using the setGalleryObj(SoftwareFX.ChartFX.IGalleryType) property allows you to assign additional attributes to selected gallery types.
SeriesAttributes.setGallery(int),
setGalleryObj(SoftwareFX.ChartFX.IGalleryType),
SeriesAttributes,
Pie,
Radarpublic void setGalleryObj(IGalleryType value)
Used to create a gallery object to assign additional attributes to the selected gallery type.
This property returns and bject which allows assignment of special properties to be set for the selected gallery.
Not all gallery types support additional properties, please refer to the Pie, Line, Surface and Radar classes for supported members.
setGallery(int),
Pie,
Radarpublic void setGaps(java.awt.Rectangle value)
Used to set the top, bottom, left and right gaps for a chart.
A gap is defined as the margin between the chart and the bounding rectangle. Each chart has a top, bottom, left and right gap.
The setTopGap(int), setBottomGap(int), setLeftGap(int) and setRightGap(int) properties also allow you to set these values.
setTopGap(int),
setBottomGap(int),
setLeftGap(int),
setRightGap(int)public void setGrid(int value)
Sets the vertical and/or horizontal grids for charts.
ChartGrid : Allows the display of grids at major intervals on one or more axis.| Value | Description |
|---|---|
ChartGrid.NONE | No gridlines. Default setting. |
ChartGrid.HORZ | Horizontal gridlines on the primary Y axis tick marks. |
ChartGrid.VERT | Vertical gridlines on the X axis tick marks. |
You can combine settings in this property with bitwise OR operator, for example if you want to show both vertical and horizontal gridlines you can do it as follows:
chart1.setGrid(chartGrid.HORZ | chartGrid.VERT);
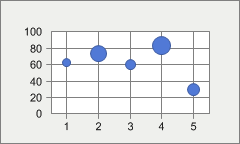
getAxisX(),
getAxisY(),
AxisSectionBase.getGrid(),
Axis.setInterlaced(boolean),
Axis,
Chartpublic void setImageMode(int value)
ImageBackground.setMode(int) instead.
setBackObject(SoftwareFX.ChartFX.IAdornment)
public void setIniValue(int series,
                        int point,
                        double value)
getIniValue() instead.
public void setInsideBackObject(IAdornment value)
Allows you to assign a gradient to the inside area of a chart.
In order to set a gradient, you must set the setScheme(int) to Scheme.Gradient for the chart.
Once you have created a gradient using the GradientBackground.setAngle(float), GradientBackground.getColor(int), GradientBackground.getFactor(int) and GradientBackground.getPosition(int) properties, you will need to assign the gradient
Class
to the InsideBackObject.
You can use the setBackObject(SoftwareFX.ChartFX.IAdornment) to assign a gradient to the chart background area.
Gradients applied to the InsideBackObject of a chart will only be applied to 2D charts. Gradients applied to the InsideBackObject of 3D charts will be ignored, however gradients applied to the setBackObject(SoftwareFX.ChartFX.IAdornment) of both 2D and 3D charts is supported.
To use gradients, the assembly SoftwareFX.Borders.dll must be added as a reference in the project.
Below is an example of a gradient assigned to the InsideBackObject:
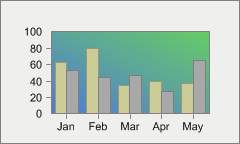
GradientBackground.setAngle(float),
setBackObject(SoftwareFX.ChartFX.IAdornment),
GradientBackground.getColor(int),
GradientBackground.getFactor(int),
GradientBackground.getPosition(int),
GradientBackgroundpublic void setInsideColor(java.awt.Color value)
Changes the color of the inner charting area.
This property was formerly called Rgb2DBk (or, Rgb3DBk).
You can change the background color by using the setBackColor(java.awt.Color) property.
A gradient may be assigned to the inside chart area using the setInsideBackObject(SoftwareFX.ChartFX.IAdornment) property.
For more information regarding the Color type, please refer to the Java API Documentation.
Here the InsideColor has been set to light green:
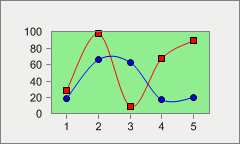
setBackColor(java.awt.Color),
setBorderColor(java.awt.Color),
AxisSectionBase.setAlternateColor(java.awt.Color),
Axis
public void setKeyLeg(int i,
                      java.lang.String value)
getKeyLeg() instead.
LabelListpublic void setLeftGap(int value)
Specifies the left margin between the chart and the bounding rectangle.
The specified value sets the distance in pixels between the border of the bounding rectangle and the chart.
setBottomGap(int),
setRightGap(int),
setTopGap(int)
public void setLegend(int i,
                      java.lang.String value)
getLegend() instead.
LabelListpublic void setLegendBox(boolean value)
Shows or hides the Legend box in the chart area.
The Legend box is a window that shows the data point labels set with the Axis.getLabel(int) or getLegend(int) properties. Usually these labels are displayed in the categorical (X) axis. However, sometimes these labels are long strings and they will not fit in the space allotted for them. Showing the Legend Box with this property can help increase the chart's readability.
The Legend box object is used to display legends associated with data points (not series). It is also necessary to improve chart readability for charts like PIE, where there is not an axis but point labels are still needed.
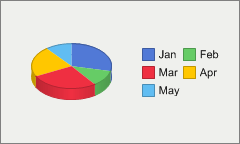
If you want to show the Series Legend box, please refer to the setSerLegBox(boolean) property.
Because the legend box is a Chart FX tool, you can configure its position and attributes within the chart area.
Dragging the legend box (end user) is not supported but may be positioned in the chart area using the LegendBoxBase.setDocked(int) property. Functionality has been added to the legends to enhance the appearance in a docked position (left, right, top or bottom). For example, you can include borders around a legend or leave them in the default compacted view. By modifying visual attributes, the legend box appears to be floating but it is attach to a logical position that will change as the chart size changes.
If you want to set where and how the legend box is displayed, please refer to the different members supported by the LegendBox Class .
Axis.getLabel(int),
getLegend(int),
getSerLeg(int),
setSerLegBox(boolean),
getLegendBoxObj(),
LegendBox,
Axispublic void setLineStyle(int value)
Sets a line style to chart borders and 2D lines.
DashStyle : Specifies the style with which dashed lines are drawn.| Value | Description |
|---|---|
DashStyle.CUSTOM | Specifies a user-defined custom dash style. |
DashStyle.DASH | Specifies a line consisting of dashes. |
DashStyle.DASH_DOT | Specifies a line consisting of a repeating pattern of dash-dot. |
DashStyle.DASH_DOT_DOT | Specifies a line consisting of a repeating pattern of dash-dot-dot. |
DashStyle.DOT | Specifies a line consisting of dots. |
DashStyle.SOLID | Specifies a solid line. |
If you're displaying a 2D Line chart, this property will set the 2D line style. For other charts, this property controls the style of the border surrounding the marker.
If you're using this property for a different chart type (other than a 2D Line chart) you can set the Border Color and Width, with the setBorderColor(java.awt.Color) and setLineWidth(int) properties respectively. However, you must make sure the Border is visible by setting the setBorder(boolean) property to True.
When setting the setBorderColor(java.awt.Color), be sure the setBorderEffect(int) is set to BorderEffect.None.
This property applies to all series available in the chart. If you want to change the line style for a particular item in the chart, please refer to the PointAttributes.setLineStyle(int) property available in the PointAttributes
Class
.
For more information regarding the Drawing type, please refer to the Java API Documentation.
setBorder(boolean),
setLineWidth(int),
setBorderColor(java.awt.Color),
SeriesAttributes.setColor(java.awt.Color),
SeriesAttributes,
PointAttributespublic void setLineWidth(int value)
Sets the line weight (or thickness) for chart borders or 2D lines.
If you're displaying a 2D Line chart, this property will set the line thickness. For other charts, this property controls the thickness of the border surrounding the marker.
If you're using this property for a different chart type (other than a 2D Line chart) you can set the Border Color and Style, with the setBorderColor(java.awt.Color) and setLineStyle(int) properties respectively. However, you must make sure the Border is visible by setting the setBorder(boolean) property to True.
When using the setBorderColor(java.awt.Color) property, make sure the setBorderEffect(int) property is set to BorderEffect.None.
This property applies to all series available in the chart. If you want to change the line width for a particular item in the chart, please refer to the PointAttributes.setLineWidth(short) property available in the PointAttributes
Class
.
setBorder(boolean),
setLineStyle(int),
setBorderColor(java.awt.Color),
SeriesAttributes.setColor(java.awt.Color),
SeriesAttributes,
PointAttributespublic void setMarkerShape(int value)
Specifies the shape of the point markers painted in the chart.
MarkerShape : Defines different shapes used to paint point markers in the chart. | Value | Description |
|---|---|
MarkerShape.NONE | Do not display point markers. |
MarkerShape.RECT | Displays a rectangle. |
MarkerShape.CIRCLE | Displays a circle. |
MarkerShape.TRIANGLE | Displays a triangle. |
MarkerShape.DIAMOND | Displays a diamond. |
MarkerShape.MARBLE | Displays a 3D marble. |
MarkerShape.HORZ_LINE | Displays a horizontal line. |
MarkerShape.VERT_LINE | Displays a vertical line. |
MarkerShape.CROSS | Displays a cross. |
MarkerShape.INVERTED_TRIANGLE | Displays a rotated triangle. |
MarkerShape.X | Displays an X. |
MarkerShape.MANY | Selects a combination of the above. |
MarkerShape.PICTURE | Displays a configured picture. |
Point markers will not be shown in 3D line charts.
This property applies only to: LINES, CURVE, SCATTER, PARETO, STEP and RADAR charts.
You can control the size of the points with the setMarkerSize(short) property, or how frequently do they appear on the selected series by using the setMarkerStep(short) property.
This property applies to all series available in the chart. If you want to change the marker shape for a particular item in the chart, please refer to the PointAttributes.setMarkerShape(int) property available in the PointAttributes object.
You can extend the point types available by setting this property to an integer representing the negative ASCII code from any font. By default, Chart FX uses the Wingdings font table to handle additional point types. For changing the default font, use the setPointFont(java.awt.Font) property.
You can use the Windows Character Map to associate a certain symbol with its corresponding ASCII code value (you will have to convert the Hex value to Decimal).
You can set custom images as chart markers by setting this property to the 'Picture' enumeration and setting an image using the PointAttributes.setPicture(java.awt.Image) property.
Below the MarkerShape has been set to Triangles:
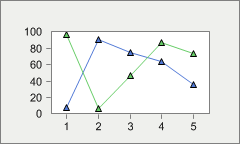
setMarkerSize(short),
setMarkerStep(short),
PointAttributes.setMarkerShape(int),
SeriesAttributes,
PointAttributespublic void setMarkerSize(short value)
Controls the size of the markers in the chart.
This property sets the radius of the marker in physical units (pixels). You must make sure the PointAttributes.setMarkerShape(int) property is set to a valid point type (other than None), before setting this property.
Point markers will not be shown in 3D line charts.
You can control the shape of the points with the PointAttributes.setMarkerShape(int) property, or how frequently they appear by using the setMarkerStep(short) property.
This property applies to all series available in the chart. If you want to change the marker size for a particular item in the chart, please refer to the setMarkerSize(short) property available in the PointAttributes
Class
.
setMarkerShape(int),
PointAttributes.setMarkerSize(short),
setMarkerStep(short),
SeriesAttributespublic void setMarkerStep(short value)
Controls how frequently point markers are shown in the chart.
This property is very useful when a chart contains numerous points. Having many point markers disturbs the chart's readability. For example, if you are showing 100 points in a line chart, the markers will crowd each other and the user won't be able to view the chart well.
You must make sure the setMarkerShape(int) Property is set to a valid marker shape (other than None), before setting this property.
You can control the shape and size of the point markers with the setMarkerShape(int) and setMarkerSize(short) properties, respectively.
This property applies to all series available in the chart. If you want to change the how frequently a marker appears in a particular series, refer to the SeriesAttributes.setMarkerStep(short) property available in the SeriesAttributes
Class
.
setMarkerShape(int),
setMarkerSize(short),
setPointFont(java.awt.Font),
SeriesAttributes.setMarkerStep(short),
SeriesAttributespublic void setMenuBar(boolean value)
Allows you to show or hide the Chart FX MenuBar.
Although the chart is displayed in a bounding rectangle, Chart FX is capable of displaying a menu bar as part of the chart.
Other tools that can be shown in the chart area are the setUserLegendBox(boolean), setLegendBox(boolean),setToolBar(boolean) and setSerLegBox(boolean).
You can modify attributes of the MenuBar using the getMenuBarObj(int) property.
Here is an example of the MenuBar enabled:
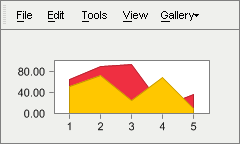
getMenuBarObj(int),
LegendBox,
ToolBar,
UserLegendBox
public void setMenuBarObj(int n,
                          int value)
getMenuBarObj() instead.
public void setMessageText(java.lang.String key,
                           java.lang.String message)
Allows you to customize default Chart FX stings which are displayed in the chart.
The key parameter is case sensitive, therefore you must use the exact pre-defined key value string.
You can use the Culture property to fully localize your charts. Elements that can be modified include the names of the culture, the writing system, and the calendar used, as well as formatting dates and strings.
The ValueFormat.setCulture(java.lang.String) property of the ValueFormat class allow you to assign culture specific formatting to labels and numbers for a selected axis.
Pre-defined message identifiers with the defualt values for each key (key=value):
NoData=No Data Available
LicDownloading=Downloading License ...
DataDownloading=Downloading Chart ...
DataFailed=Failed to download Chart\n{0}
Mask.Percentage=%s\n%l\n%v out of %t\n(%p%%)
Mask.OHLC=%l\nOpen: %v2\nHigh: %v4 - Low: %v1\nClose: %v3
Mask.HLC=%l\nHigh: %v3 - Low: %v1\nClose %v2
Mask.Ini=%s\n%l\nFrom %i to\n%v
Mask.XY=%s\n%l\nX: %x, Y: %v
Mask.Between=%s\n%l - %l\n%v - %v
Mask.Default=%s\n%l\n%v
LegMask.Series=Series #{0}
LegMask.Values=Value #{0}
CFX61B0=A temporary file on {0} could not be created
XAxis=X Axis
YAxis=Y Axis
General=General
Series=Series
Chart=Chart Area
Draw=Drawing Area
AllSeries=All Series
Auto=Auto
None=None
Raised=Raised
Light=Light
Dark=Dark
Opposite=Opposite
Shadow=Shadow
Number=Number
Currency=Currency
Scientific=Scientific
Percentage=Percentage
Date=Short Date
LongDate=Long Date
Time=Time
DateTime=Date-Time
Label0=Horizontal
Label1=Vertical
Label2=45 Degrees
Inside=Inside
Outside=Outside
Cross=Across
ExportFilter=ChartFX File (*.cfx)|*.cfx|Text File (data only)|*.txt|XML File (properties only)|*.xml|Bitmap Image (*.bmp)|*.bmp|Metafile Picture (*.emf)|*.emf
ImportFilter=ChartFX Files (*.cfx)|*.cfx|Text Files (data only)|*.txt|XML Files(properties only)|*.xml
NoPermission=The application does not have enough permissions to execute this operation.
key - Pre-defined message identifier.message - The new string value for the message.ValueFormat.setCulture(java.lang.String),
ValueFormatpublic void setMultipleColors(boolean value)
Allows for independently colored data points.
When set to False all the data points in the series will assume the same color. When set to True all data points on a series will have a unique color.
You can assign specific colors to specific points by utilizing the PointAttributes.setColor(java.awt.Color) property of the PointAttributes
Class
.
When MultipleColors is set to True and the getLegend(int) has been set for the chart, the legend command button in the Chart FX ToolBar will display the setLegendBox(boolean). If MulitpleColors is set to False and the getSerLeg(int) have been set for the chart, the setSerLegBox(boolean) will be displayed when the legend command button is selected.
In the following image, MultipleColors has been set to True:
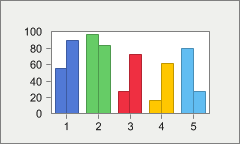
PointAttributes.setColor(java.awt.Color),
getLegend(int),
setLegendBox(boolean),
getSerLeg(int),
setSerLegBox(boolean),
PointAttributespublic void setNSeries(int value)
Used to read the number of series available in a chart.
At runtime, you can not change the number of data series in the chart without calling the openData(int, int, int) method or by passing data through datasets. However, at design time this value can be set in the property dialog window and will determine the number of series for the chart.
The setNValues(int) and NSeries properties are usually set a design-time using the property dialog box for the Chart object. The only time these properties should be included in code is when you wish to read the number of series or points in a chart.
This property is normally used to get the number of series available on the chart for administration purposes. For example, if you want to set a different color for each data series using the SeriesAttributes.setColor(java.awt.Color) property, you will need the number of available data series to complete the For loop.
The number of points per series can be obtained with the setNValues(int) property.
setNValues(int),
openData(int, int, int)public void setNValues(int value)
Used to read the number of data points per series in a chart.
At runtime, you can not change the number of data points per series in a chart without calling the openData(int, int, int) method or by passing data through datasets. However, at design time this value can be set in the property dialog window and will determine the number of points per series for the chart.
The NValues and setNSeries(int) properties are usually set a design-time using the property dialog box for the Chart object. The only time these properties should be included in code is when you wish to read the number of series or points in a chart.
This property is normally used to get the number of data points per series available in the chart for administration purposes. For example, if you want to change the values of each data point in a series, you will need the number of available points per series to complete the For loop.
The number of series can be obtained with the setNSeries(int) property.
setNSeries(int),
openData(int, int, int)public void setPageColor(java.awt.Color value)
Allows you to specify a form background color needed to fill areas around image border shadowing.
This is automatically done in Chart FX when creating desktop applications. This property is useful when using image borders with the Internet Edition.
For more information regarding the Color type, please refer to the Java API Documentation.
setBorderObject(SoftwareFX.ChartFX.IAdornment)public void setPalette(java.lang.String value)
Allows you to set a Chart FX pre-defined palette.
When changing the palette, all the properties related to changing colors in the chart will also be affected as Chart FX will change the windows palette for the chart window. So if you previously set a color using any of the Chart FX supported properties (Color, BackColor, etc) this color may not be part of the applied palette and therefore will be replaced by a color in the selected palette.
New palettes may be created and integrated into ChartFX. For more information regarding palette creation, please contact SoftwareFX support.
Below is a list of Chart FX palettes:
Default.Alternate
Default.ChartFX6
Default.EarthTones
Default.ModernBusiness
Default.Windows
DarkPastels.Pastels
DarkPastels.AltPastels
HighContrast.HighContrast
Nature.Sky
Nature.Adventure
Mesa
Vivid
ChartFX5.ChartFX5
setScheme(int),
SeriesAttributespublic void setPersonalizedFlags(int value)
Allows you to set the preferences for saving and loading personalized charts.
PersonalizedFlags : The Personalized Flags.| Value | Description |
|---|---|
PersonalizedFlags.NONE | The personalized features are not used. |
PersonalizedFlags.AUTO_LOAD | The personalized features are automatically loaded when the chart is created. |
PersonalizedFlags.AUTO_SAVE | The personalized features are automatically saved when the chart is destroyed. |
PersonalizedFlags.ENABLE_RESTORE | When the user makes the first change to the chart through the UI, the original chart is saved in memory. |
PersonalizedFlags.SERVER_SIDE | The personalized settings will be saved server side. |
Many users require and demand information on an individual basis. Using personalized charts allows users to change visual attributes and have those settings saved locally. When the user accesses the chart in the future, the saved settings can be automatically loaded so the user can view a chart configured to their personal preference.
The setPersonalizedName(java.lang.String) property allows you to assign a unique name for saving the user settings for each chart.
setPersonalizedName(java.lang.String),
exportChart(int, java.lang.String),
importChart(int, java.lang.String)public void setPersonalizedName(java.lang.String value)
Allows you to use the same name for more that one chart or change the default name.
When using the personalized features for Chart FX, the users attribute changes must be saved locally on their computer. The PersonalizedName property allows you to create unique or uniform names for your charts so the personalized settings can be loaded or saved.
The setPersonalizedFlags(int) property allows you to configure the save and loading preferences for personalized features.
setPersonalizedFlags(int),
exportChart(int, java.lang.String),
importChart(int, java.lang.String)public void setPerspective(int value)
Allows you to set a 3D perspective to control the view of the chart depth.
The perspective value specifies the ratio of the front of the chart to the back of the chart. It ranges from 0 (default) degrees to 100 degrees.
In order to apply a perspective the chart must be in 3D (setChart3D(boolean) property) and the setView3D(boolean) property must be turned on.
setChart3D(boolean),
setView3D(boolean)
public void setPoint(int series,
                     int point,
                     PointAttributes value)
chart.getPoint()setItem instead.
#setPoint()
public void setPoint(int point,
                     PointAttributes value)
chart.getPoint()setItem instead.
#setPoint()public void setPointFont(java.awt.Font value)
Allows you to select a different collection of wingding fonts for use as marker shapes.
This property is used in conjunction with the setMarkerShape(int) property. You can extend the point types available by setting the setMarkerShape(int) to an integer representing the negative ASCII code from any font. By default, Chart FX uses the Wingdings font table to handle additional point types. This property allows you to select a different Wingdings font.
setMarkerShape(int)public void setPointLabelAlign(int value)
Allows you to align point labels using the marker as a reference.
LabelAlign : Define the ways of aligning point labels using the marker as a reference. | Value | Description |
|---|---|
LabelAlign.LEFT | The label will be left aligned to the marker. |
LabelAlign.CENTER | The label will be centered with the marker. |
LabelAlign.RIGHT | The label will be right aligned to the marker. |
LabelAlign.TOP | The label will be on the top edge of the marker. |
LabelAlign.VCENTER | The label will be vertically centered. |
LabelAlign.BOTTOM | The label will be on the bottom edge of the marker. |
The correct way of setting this property is to chose a horizontal and vertical alignment style and combine them using the Or (bitwise) operator, as follows:
chart1.getSeries(0).setPointLabelAlign(LabelAlign.LEFT | LabelAlign.TOP);
To use this property, you must make sure the point labels are visible (setPointLabels(boolean) property).
Although you can set general alignment for labels showing data values, Chart FX may overwrite such setting to avoid an undesired display of the point label. For example, if you have negative values in the chart, Chart FX will overwrite the Centered-Bottom alignment to a Centered-Top alignment so the label will show properly for points having negative values.
You can also control the label angle with the setPointLabelAngle(short) property.
To set the font associated with point labels please refer to the chart's setPointLabelFont(java.awt.Font) property.
This property is also available in the SeriesAttributes and PointAttributes
Class
, so you can apply a label angle to a specific series or point instead of all series in the chart.
setPointLabels(boolean),
setPointLabelAngle(short),
setPointLabelFont(java.awt.Font),
SeriesAttributes,
PointAttributespublic void setPointLabelAngle(short value)
Sets the amount of text rotation for the labels.
In order to set this property you must make sure the font type associated with the axis is a True Type Font. Default rotation angle is 0 degrees. (Horizontal).
Use a positive number to rotate the labels from lower left to upper right. Use negative degrees to rotate text from upper left to lower right.
To use this property, you must make sure the setPointLabels(boolean) are visible.
To set the font associated with point labels please refer to the chart's setPointLabelFont(java.awt.Font) property.
This property is also available in the SeriesAttributes or PointAttributes
Class
, so you can apply a label angle to a specific series or point instead of all series in the chart.
setPointLabels(boolean),
setPointLabelAlign(int),
setPointLabelFont(java.awt.Font),
SeriesAttributes,
PointAttributespublic void setPointLabelColor(java.awt.Color value)
Sets the color of the point label text for the entire chart.
The setPointLabels(boolean) property must first be set to True in order to use this property.
It is recommended to use light PointLabelColors when the setInsideColor(java.awt.Color) or a series of a Bar chart is a dark color (and, vice versa).
To set the color of a specific series or point, use the SeriesAttributes or PointAttributes
Class
properties:
getSeries(index).setLabelColor(java.awt.Color.red);
getPoint(Series,Point).setLabelColor(java.awt.Color.red);
For more information regarding the Color type, please refer to the Java API Documentation.
PointAttributes.setColor(java.awt.Color),
setInsideColor(java.awt.Color),
setPointLabels(boolean),
SeriesAttributes,
PointAttributespublic void setPointLabelFont(java.awt.Font value)
Allows you to set a font directly to the point labels in a chart.
You must ensure that the setPointLabels(boolean) property is set to True in order to use this property.
When setting a font in Chart FX, you must create a new font object with the desired attributes and assign that object to the desired chart element every time you want to change the font.
This property sets a font to all point labels in the chart.
For more information regarding the Font type, please refer to the Java API Documentation.
setPointLabelAlign(int),
setPointLabelColor(java.awt.Color),
PointAttributes.setPointLabelFont(java.awt.Font),
setPointLabels(boolean),
Chart.setFont(java.awt.Font),
PointAttributes,
SeriesAttributespublic void setPointLabelMask(java.lang.String value)
Allows you to customize the labels that appear when you set the PointLabels property.
The syntax for this property is the same as the one used in the setTipMask(java.lang.String) property. Variables can be accessed using the % following the variable you want to include:
l Shows X-Axis Legend.
k Shows X-Axis Key Legend.
s Shows Series Legend.
x Shows getXValue(int, int) (XY Plots).
i Shows getIniValue(int, int) (Gantt).
v Shows Data getValue(int, int).
n <n> For types that require more than one series, these are replaced by the value of each one. (n represents an index).
t Series Total (Sum of all points in this series).
p Percentage of total this point represents (Pie).
T Point Total (Sum of all series for this point).
P Percentage of total this series represents (Used in stacked charts).
X displays the marker X value for any chart type including those that do not support X values such as bar.
L Shows the PointAttributes.setTag(java.lang.Object) string of the PointAttributes object.
N Shows the index for the point.
S Shows the index for the series.
setTipMask(java.lang.String),
setPointLabels(boolean),
setPointLabelAlign(int),
setPointLabelAngle(short),
setPointLabelColor(java.awt.Color),
setPointLabelFont(java.awt.Font),
PointAttributes.setTag(java.lang.Object),
PointAttributes,
SeriesAttributespublic void setPointLabelOffset(java.awt.Point value)
Allows you to customize the point label position by configuring X and Y coordinates.
Both the X and Y coordinates are necessary to configure this property.
You may configure a .NET point object with the desired values and assign that object to the PointLabelOffset property.
This property accepts both positive and negative X and Y coordinates.
The X and Y coordinate values are measured in pixels.
setPointLabelAlign(int),
setPointLabelAngle(short),
setPointLabels(boolean)public void setPointLabels(boolean value)
Displays the value on each data point for all series in the chart.
You can also control the text alignment and text display angle with the setPointLabelAlign(int) and setPointLabelAngle(short) properties, respectively.
Although you can control which series displays values on each data point, the font associated with these values is global and is controlled with the chart's setPointLabelFont(java.awt.Font) property.
This property applies to all series in the chart, if you want to show labels on a specific item, please refer to the PointAttributes.setPointLabels(boolean) property supported by the PointAttributes
Class
.
Below is an example of a line chart with PointLabels:
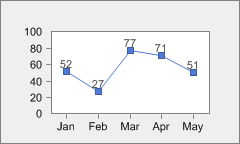
setPointLabelAlign(int),
setPointLabelAngle(short),
setPointLabelFont(java.awt.Font),
SeriesAttributes,
PointAttributespublic void setRightGap(int value)
Specifies the right margin between the chart and the bounding rectangle.
The specified value sets the distance in pixels between the border of the bounding rectangle and the chart.
setBottomGap(int),
setTopGap(int),
setLeftGap(int)public void setScheme(int value)
Allows you to change the color scheme in the chart.
Scheme : Define color scheme in the chart. | Value | Description |
|---|---|
Scheme.SOLID | Use solid colors. |
Scheme.BW_PATTERN | Use Black & White patterns. |
Scheme.PATTERN | Use colored patterns. |
Scheme.GRADIENT | Use Gradient when painting the chart series |
The difference between patterns and hatched patterns is that hatched patterns are defined by windows and they can be resized when printing the charts. However, there are limited hatched patterns available.
Chart FX uses patterns (not hatched) that are suitable for the screen but when they are printed, they are defined as 8x8 pixels and therefore they will not be visible when printing with high resolution printer (e.g. 600 dpi). The Printer.setForceColors(boolean) property in the printer object uses hatched patterns to print the charts.
A general rule of thumb is to use patterns for the screen and hatched patterns when printing the chart.
When using colored patterns or colored hatched patterns the foreground of the pattern is defined by the color set with the SeriesAttributes.setColor(java.awt.Color) property and the background color is defined by the color set with the setBackColor(java.awt.Color) property.
When creating gradients to be applied to the setBackObject(SoftwareFX.ChartFX.IAdornment) and setInsideBackObject(SoftwareFX.ChartFX.IAdornment) of your charts, you will need to set this property to 'Gradient'.
The PointAttributes.setScheme(int)
Class
also supports a PointAttributes.setScheme(int) property, so you may assign a scheme to a particular point or a complete series.
The Scheme for the chart below has been set to Gradient. Notice the slight fade from light to dark on each bar of the chart:
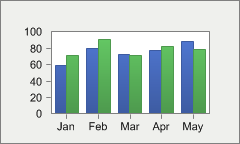
Printer.setForceColors(boolean),
SeriesAttributes.setColor(java.awt.Color),
setBackColor(java.awt.Color),
setBackObject(SoftwareFX.ChartFX.IAdornment),
setInsideBackObject(SoftwareFX.ChartFX.IAdornment),
GradientBackground,
PointAttributespublic void setScrollable(boolean value)
Enables or disables chart scrolling.
Charts should be generated as dynamic objects in order for the charts to actually support scrolling features. Charts generated as images will display a scrollbar, but will NOT support any user interaction. Chart images are static and do not support scrolling.
When the X axis is a categorical axis and the number of data points (or tick marks) do not fit in one screen Chart FX will display a scroll bar so the end user can scroll through the data (maintaining the tick mark separation set with the Axis.setPixPerUnit(double) property). This is particularly useful when the labels associated with tick marks are long strings but still important to improve chart's readability or when a particular marker separation is important.
In some other cases, having a scroll bar associated with the X axis is not desired and you can use this property to force Chart FX to display all data points in one screen. If you have a large number of points or long strings associated with tick marks this could affect the chart's readability and you'll need to reset the labels associated with the tick marks in the X axis.
This property controls the scroll bar when the X axis is a categorical axis. If you want to show a scroll bar for a numerical axis, please refer to the Axis.setPixPerUnit(double) property or the Axis.setScrollView(double, double) method.
To scroll a chart, you may use the keyboard arrows or the drag the scroll thumb with your mouse cursor.
Here the Scrollable property has been set to True, notice the scroll thumb located along the X axis:
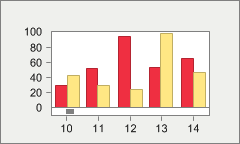
Axis.setPixPerUnit(double),
setZoom(boolean),
Axis.setScrollView(double, double),
Axis
public void setSerKey(int i,
                      java.lang.String value)
getSerKey() instead.
LabelList
public void setSerLeg(int i,
                      java.lang.String value)
getSerLeg() instead.
LabelListpublic void setSerLegBox(boolean value)
Shows or hides the series legend box in the chart.
The series legend box is a window that shows the series legend keys set with the getSerLeg(int) property.
If you want to show the Legend box (containing the labels associated with tick marks in the X axis) for a Pie chart, please refer to the setLegendBox(boolean) property.
If want to set the placement attributes of the legend box refer to the different members supported by the LegendBox
Class
.
Keep in mind when enabling any Chart FX Tool, the charting area used to paint the chart is reduced.
Dragging the legend box (end user) is not supported but may be positioned in the chart area using the LegendBoxBase.setDocked(int) property. Functionality has been added to the legends to enhance the appearance in a docked position (left, right, top or bottom). For example, you can include borders around a legend or leave them in the default compacted view. By modifying visual attributes, the legend box appears to be floating but it is attach to a logical position that will change as the chart size changes.
Below is an example of the series legend box:
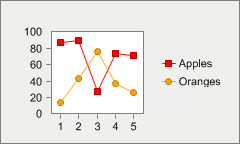
getLegend(int),
setLegendBox(boolean),
getSerLeg(int),
getSerLegBoxObj(),
LegendBoxpublic void setShowTips(boolean value)
Allows you to enable or disable tooltips when the user positions the mouse over a particular Chart FX element in the chart area only.
This property does not affect whether if the Toolbar ToolTips will appear or not when the user positions the mouse over a particular button or element in the Toolbar. For more information on how to disable Toolbar tooltips, please refer to the ToolTips property in the ToolBar
Class
.
Tooltips allow the user to easily recognize the appropriate Chart FX element.
This property must be set to True for the GetTip event to fire.
ToolBarpublic void setSmoothFlags(int value)
Gives a smooth visual effect to a particular chart elements.
SmoothFlags : Sets the rendering quality| Value | Description |
|---|---|
SmoothFlags.FILL | Specifies antialiased rendering inside of the chart. |
SmoothFlags.BORDER | Specifies antialiased rendering on chart borders. |
SmoothFlags.TEXT | Specifies that each character is antialiased rendering. |
SmoothFlags.NONE | Specifies no antialiasing. |
SmoothFlags.TEXT_SYSTEM | Specifies to use the system settings. |
All elements are using the SmoothFlags property by default, however if you wish not to use this property you may configure the 'None' value.
The TypeEx property also supports a DoubleBuffer enumeration that can prevent flickering in real-time charts.
The following images display the SmoothFlags property. The first image was made using the default SmoothFlags setting, the second using the 'None' enumeration:
SmoothFlags Default:

SmoothFlags None:
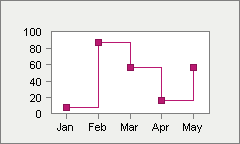
setTypeEx(int)public void setStacked(int value)
Allows you to select the stacked style in the chart.
Stacked : Defines the stacked style in the chart. | Value | Description |
|---|---|
Stacked.NO | No stacked chart. |
Stacked.NORMAL | Stacked. |
Stacked.STACKED_100 | 100% stacked. |
This property applies to BAR or AREA charts only.
This property applies the stacked style to all series in the chart. Chart FX also support multistacked charts where you can stack series by pairs. For more information, please refer to the SeriesAttributes.setStacked(boolean) property in the series object.
Below is a chart using the 'Stacked100' enumeration to stack the chart:
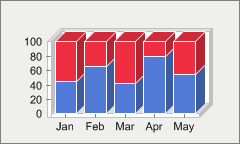
SeriesAttributes.setStacked(boolean),
SeriesAttributespublic void setStyleEx(int value)
Allows you to restrict or allow end-user access to several functions provided through the Chart FX end-user interface.
ChartStyleEx : Define a extension of Styles defined on ChartStyle type.| Value | Description |
|---|---|
ChartStyleEx.NO_SEPARATE | Prohibit users from separating slices of a pie or a doughnut chart. |
ChartStyleEx.NO_LAST_PAGE | By default Chart FX remembers which was the last accessed page in the Tabbed dialog. When this bit is turned on the library always display the first tab section. |
ChartStyleEx.WIN_95_TOP | Draws a Windows 95 3D line on top of the ToolBar, to separate the Toolbar from the menu in Windows 95. |
ChartStyleEx.CHILD_DESTROY | Send Destroy event even when the chart is a child window. By default this bit is off and the Destroy event is sent only when the chart is an pop-up window. |
ChartStyleEx.EXPORT_XVALUES | If this flag is ON, the X values are exported to the clipboard every time you export the chart as data. |
ChartStyleEx.FAST_LEGENDS | Disable the legend size computation. Use this flag to improve speed on setting the legends. You must set this flag on BEFORE setting any legend. You can not show a legend box if the legends are set while this flag is on. If you are going to set a new set of legends you must call the ClearLegend property before starting to set the legends in order to get the best performance. |
You set this property using the bitwise operators (And, Or, Not, Xor) provided by your development tool.
For example, the correct way to turn ON the FastLegends setting:
chart1.setStyleEx(chart1.getStyleEx() | ChartStyleEx.FAST_LEGENDS);
The following code is WRONG (it will erase all other settings in the property causing an erratic behavior of the library and an incorrect setting of the individual properties which also control these flags):
chart1.setStyleEx(ChartStyleEx.FAST_LEGENDS);
setChartStyle(int),
setTypeEx(int)public void setTemplateMask(int value)
Used to specify the chart data to be saved in personalization and template files.
FileMask : Define what to save in the chart when using the Export method with CfxOleFile option. | Value | Description |
|---|---|
FileMask.GENERAL | Save Chart Type and general effects in the chart file. |
FileMask.FONTS | Save font settings in the chart file. |
FileMask.SCALE | Save axes scale in the chart file. |
FileMask.TITLES | Save titles in the chart file. |
FileMask.MULTI | Save Multitype settings (except colors) in the chart file. |
FileMask.COLORS | Save colors in the chart file. |
FileMask.TEMPLATE | Save a chart template (.cht) which could be later imported into Chart FX. |
FileMask.LABELS | Save legends in the chart file. |
FileMask.SIZE_DATA | Save just the number of points and series (not the data) in the chart file. |
FileMask.DATA | Save numeric data in the chart file. |
FileMask.ELEMENTS | Save Constant lines and color stripes in the chart file. |
FileMask.TOOLS | Save tools and additional customizations in the chart file. |
FileMask.EXTENSIONS | Save active extensions and their settings in the chart file. |
FileMask.PRINTER_INFO | Save special printer information in the chart file. |
FileMask.PICTURES | Saves image information in the chart file. |
FileMask.LICENSE | Saves license information in the chart file. |
FileMask.INTERNET | Saves domain information about the chart's parent website. |
FileMask.ALL | Save all chart settings (all of the above) in the chart file. |
FileMask.DATA_BIND | Save all current data with the chart file. |
FileMask.REUSE_EXTENSIONS | Used with OLAP Extension. Saves all the dimension and level information in the chart file so that it may be reused with new data values. |
Using this property, you can control all the attributes that will be saved when using personalization options with charts.
This property is a mask property, this means all settings represent a bit in the word that you need to turn on or off according to what you want. For this purpose you'll need to use the bitwise operators (And, Or, Not, Xor) provided by your development tool.
Because it is a mask property, you must make sure you use these operators to turn on/off bits and avoid losing previous settings to the property.
For example, if you want to turn ON the 'Tools' setting
The right way of setting this property is:
chart1.setTemplateMask(chart1.getTemplateMask() | FileMask.TOOLS);
If you type the following code:
chart1.setTemplateMask(FileMask.TOOLS);
(WRONG!)
you will erase all other settings in the property causing an erratic behavior of the library when saving files.
setFileMask(int),
exportChart(int, java.lang.String)public void setTipMask(java.lang.String value)
Allows you to control the information to be displayed in the tooltip when the user positions the mouse over a particular data point in the chart.
The syntax for this property is the same as the one used in the setPointLabelMask(java.lang.String) property. Variables can be accessed using the % following the variable you want to include:
l Shows X-Axis Legend.
k Shows X-Axis Key Legend.
s Shows Series Legend.
S Shows the Series Index.
x Shows XValue (XY charts, when they were set with X values).
i Shows IniValues (Gantt).
v Shows Data Value.
v <n> For types that require more than one series, these are replaced by the value of each one. (n represents an index).
t Series Total (Sum of all points in this series).
p Percentage of total this point represents (Pie).
T Point Total (Sum of all series for this point).
P Percentage of total this series represents (Used in stacked charts).
X displays the marker X value for any chart type including those that do not support X values such as bar.
N Shows the index for the point.
L Shows the PointAttributes.setTag(java.lang.Object) string of the PointAttributes object.
This property is write-only.
setShowTips(boolean),
setPointLabelMask(java.lang.String),
PointAttributespublic void setToolBar(boolean value)
Shows or hides the Chart FX Toolbar.
The Toolbar provides the user tools for customizing the chart.
If you want to customize the toolbar, you will need to use properties supported by the ToolBar
Class
.
Other tools that can be shown in the chart area are the, setUserLegendBox(boolean), setLegendBox(boolean), setDataEditor(boolean) and setSerLegBox(boolean).
Below is a chart with the ToolBar enabled:
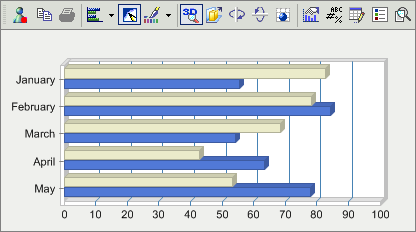
setLegendBox(boolean),
setSerLegBox(boolean),
setDataEditor(boolean),
setUserLegendBox(boolean),
ToolBar,
DataEditor,
LegendBox
public void setToolBarObj(int n,
                          int value)
getToolBarObj() instead.
public void setTopGap(int value)
Specifies the top margin between the chart and the bounding rectangle.
The specified value sets the distance in pixels between the border of the bounding rectangle and the chart.
setBottomGap(int),
setLeftGap(int),
setRightGap(int)public void setTypeEx(int value)
Allows you to set additional visual attributes in the chart and it is provided as an extension of the Type property.
Some of the settings available in this property were replaced by a general property.
ChartTypeEx : Define additional visual attributes in the chart and it is provided as an extension of the ChartType Type. | Value | Description |
|---|---|
ChartTypeEx.NO_LEG_INVALIDATE | Useful for RealTime charts. Is this flag is ON, the chart will not be invalidated when the legends are set. |
ChartTypeEx.ACT_MIN_MAX | See AutoScale. |
ChartTypeEx.NO_TITLE_SHADOW | Turn off the 3D effect for Top Title. |
ChartTypeEx.CREATE_LEGENDS | Allows the end-users to create legends from Data Editor. |
ChartTypeEx.NO_CROSS | Turn off cross-hairs feature. |
ChartTypeEx.ONLY_CHART | Makes the chart to hide everything outside the chart area such a axis,titles,etc.This feature is very useful when you want to overlap charts. |
ChartTypeEx.PLAIN_2_D_AXIS | Makes the 2D axis frame to be a simple rectangle. Eliminate the 3D frame effect for the 2D charts. |
ChartTypeEx.SIDEBY_SIDE | For 2D MultiType charts, makes the bars to be side-by-side instead of overlapped. |
ChartTypeEx.MONOCHROME | Turn ON will show a Black & White chart and it won't be possible to change chart colors. |
ChartTypeEx.USE_PALETTE | Is Obsolete. |
ChartTypeEx.DEFAULT | The default settings are: NoCross | UsePalette |
ChartTypeEx.GET_TIP_DRAG | When ON, Chart FX will send GetTip events for Drag-and-Drop data tips and Cross-Hairs data tips. |
ChartTypeEx.MERGE_PALETTE | MergePalette ON: In this mode ChartFX merges its palette with the current palette. MergePalette OFF: In this mode ChartFX replaces the system palette with its own. Please visit our website for more information at: http://support.softwarefx.com/kb/146/3/009.htm |
ChartTypeEx.DOUBLE_BUFFER | The chart will refresh itself using a double buffering technique. The effect will be a less flickering. BitBlitz technique |
ChartTypeEx.RANDOM_FIXED | Internal use. When generating random data, a fixed seed value is used. |
You set this property using the bitwise operators (And, Or, Not, Xor) provided by your development tool.
For example, the correct way to turn on the 'NoCross' setting:
chart1.setTypeEx(chart1.getTypeEx | ChartTypeEx.NO_CROSS);
The following code is WRONG (it will erase all other settings in the property causing an erratic behavior of the library and an incorrect setting of the individual properties which also control these flags):
chart1.setTypeEx(ChartTypeEx.NO_CROSS);
setStyleEx(int)public void setTypeMask(int value)
Allows you to set additional visual attributes in the chart.
In Chart FX many of the settings contained in this property are supported by general properties.
ChartType : Define additional visual attributes in the chart and allows to turn on/off them. | Value | Description |
|---|---|
ChartType.PAINT_MARKER | This constant will turn on message event for customize chart drawing process. |
ChartType.COLOR_LINE | This constant specifies that the lines of a 2D Line Chart must be drawn using colors. |
ChartType.SHOW_3D | See Chart3D. |
ChartType.HORZ | See Gallery. |
ChartType.TOOL | See Toolbar. |
ChartType.PALETTE | See PaletteBar. |
ChartType.LEGEND | See LegendBox. |
ChartType.HIDE_SERIES | This constant will hide all chart series. |
ChartType.EACH_BAR | See MultipleColors. |
ChartType.CLUSTER | See Cluster. |
ChartType.SHOW_DATA | See DataEditor. |
ChartType.EDITOR | This constant will show the Data Editor. See DataEditor. |
ChartType.DLG_GRAY | This constant will cause the dialogs to be shown with a gray background, to provide support for applications that also use gray backgrounds. This keeps the graphics library consistent with the rest of the client application. |
ChartType.PATTERN | See PatternBar. |
ChartType.SHOW_VALUES | See PointLabels. |
ChartType.POINT_LABELS | This constant will show the point markers on a Line or Spline Chart. |
ChartType.MENU | See MenuBar. |
ChartType.DEFAULT | See property default. |
ChartType.INTERNAL_BORDER | This constant will show an internal border for supported Chart FX tools in the chart area. |
ChartType.NO_BORDERS | See Border. |
ChartType.PIE_VALUES | This constant specifies that the values must be painted in the pie chart (instead of painting the percentages). |
ChartType.TRACK_MOUSE | This constant has to be included for those charts you want to capture mouse tracking. |
ChartType.EVEN_SPACING | This constant specifies points in the x axis will be even spaced, which means that points will be equally distanced in the x axis. When apply, this can cause a behavior in which you will see a blank gap at the right side of the chart, since the points can not be equally distance. Useful with real-time charts. (Default = Off) |
ChartType.SER_LEGEND | See SerLegBox. |
ChartType.GLOBAL | Internal use. Refers all enumerations that effect the chart globally, not by point or series. |
ChartType.USER_LEGEND | Shows or Hides the user legend box in the chart. See UserLegendBox. |
You set this property using the bitwise operators (And, Or, Not, Xor) provided by your development tool.
For example, the correct way to turn ON the 'DlgGray' setting:
chart1.setTypeMask(chart1.getTypeMask() | ChartType.DLG_GRAY);
The following code is WRONG (it will erase all other settings in the property causing an erratic behavior of the library and an incorrect setting of the individual properties which also control these flags):
chart1.setTypeMask(ChartType.DLG_GRAY);
setStyleEx(int),
setTypeEx(int)public void setUserLegendBox(boolean value)
Shows or hides the user legend box.
The User Legend box is a window that shows information about a chart that the programmer must define manually. The only time that a user legend is populated automatically by Chart FX is when setting the UserLegendBox.setAutoContourLabels(boolean) property. This method fills and displays the user legend in your chart when the closeData(int) method is called.
If you want to show the Legend box (containing the labels associated with tick marks in the x-axis) for a Pie chart, please refer to the setLegendBox(boolean) property.
Because the user legend box is a Chart FX tool, you can configure its position and attributes within the chart area.
If want to set the placement attributes of the legend box refer to the different properties supported by the LegendBox
Class
.
Keep in mind when enabling any Chart FX Tool, the charting area used to paint the chart is reduced.
Dragging the legend box (end user) is not supported but may be positioned in the chart area using the LegendBoxBase.setDocked(int) property. Functionality has been added to the legends to enhance the appearance in a docked position (left, right, top or bottom). For example, you can include borders around a legend or leave them in the default compacted view. By modifying visual attributes, the legend box appears to be floating but it is attach to a logical position that will change as the chart size changes.
A user legend box is very useful in the following situations:
- A Surface or Contour chart where the number of colors is not related to the number of series.
- When you set per-point attributes such as colors and marker shapes and wish to give a description or key.
setLegendBox(boolean),
setSerLegBox(boolean),
getUserLegendBoxObj(),
LegendBoxBase.setDocked(int),
UserLegendBox.setAutoContourLabels(boolean),
LegendBox,
UserLegendBox
public void setValue(int series,
                     int point,
                     double value)
getValue() instead.
public void setView3D(boolean value)
Allows you to enable or disable 3D view of the chart. Also permits angle and perspective attribute assignments.
You must make sure the setChart3D(boolean) property is set to True in order to use this property.
When this property is set to True, you can apply a rotation angle or perspective with the setAngleX(int), setAngleY(int) and setPerspective(int) properties.
setChart3D(boolean),
setAngleX(int),
setAngleY(int),
setPerspective(int)public void setView3DDepth(int value)
Allows you to specify the depth of a 3D chart.
You must make sure the setChart3D(boolean) property is set to True in order to use this property.
The value is a percentage of the marker's width (the distance between two consecutive points in the X-Axis). For example:
100% means the marker will have a depth equals to its width.
200% means the marker will have a depth double than its width.
This chart's depth is set to 200:
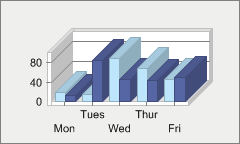
setChart3D(boolean)public void setView3DLight(int value)
Allows to specify the light setting for a 3D chart.
Shadow : Define light setting for a 3D chart. | Value | Description |
|---|---|
Shadow.NONE | No light. |
Shadow.FIXED | Normal Light. |
Shadow.REALISTIC | Realistic lights. |
To apply this property correctly you must make sure the chart is displayed in 3D mode using the setChart3D(boolean) property.
Setting this property to zero (no light), will accelerate the paint of the chart in non true-colors video cards.
setChart3D(boolean)public void setVolume(short value)
Allows you to specify a volume for data series markers in supported galleries.
By adjusting the volume, you can modify the amount of space between the series.
The larger the value, the lesser the distance between the selected series and its neighbors.
This property has a dual functionality depending on the clustered status of the chart, as follows:
If the chart is clustered, this property is used to specify the amount of space between the selected series and its neighbors in the z-axis (a.k.a. Gap Depth). When used in this context, this property is used for any chart type that supports clustered options (Including Multi-Type charts)
When the chart is not clustered, this property controls the amount of space between the selected series and its neighbors in the x-axis (a.k.a Gap Width). When used in this context, this property applies to any chart type that allows side to side positioning of the series (BAR, BUBBLE, CANDLESTICK, HI-LO-CLOSE, OPEN-HI-LOW-CLOSE and CUBES).
If you want to control the Volume property for a particular series or point in the chart you can use the Volume property supported by the SeriesAttributes and PointAttributes
Class
.
The following chart types must be set to setChart3D(boolean) in order for this property to work:
LINES, CURVE, SCATTER, AREA, STEP, SURFACE, CURVEAREA, CONTOUR.
The volume property will not work with RADAR charts (even when setChart3D(boolean) is set to TRUE).
In the figure below, the Volume property has been set to 100:
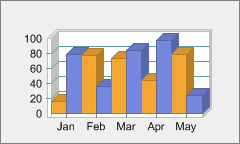
setChart3D(boolean),
SeriesAttributes,
PointAttributespublic void setWallWidth(int value)
Allows you to set the width of the wall for a 3D chart.
The width value is measured in pixels.
In order to set this properly correctly you must make sure the chart is in 3D (setChart3D(boolean) property).
You can also set the Wall color with the setInsideColor(java.awt.Color) property.
Notice the thickness of the wall when the WallWidth is set to 10 pixels:
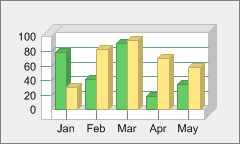
setChart3D(boolean),
setInsideColor(java.awt.Color)
public void setXValue(int series,
                      int point,
                      double value)
getXValue() instead.
public void setYLeg(int i,
                    java.lang.String value)
getYLeg() instead.
LabelListpublic void setZoom(boolean value)
Allows you to select a section of the chart using the mouse cursor and zoom in that area.
When set to True, this property allows you to select a section of the chart using the mouse cursor for Chart FX to zoom in for a closer look.
When set to False, this property turns off all zoom attributes globally, including the Axis object Axis.zoom(double, double) and Axis.zoomOff() methods.
When the Zoom property is enabled, you can select a portion of the chart to Zoom by left clicking and dragging your mouse of the desired area:
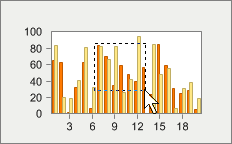
Once you have selected a range, the zoom area of the chart will be displayed:
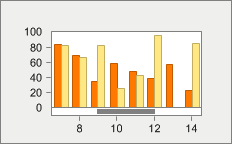
getAxisX(),
getAxisY(),
getAxis(int),
Axis.zoom(double, double),
Axis.zoomOff(),
Axis
|
http://www.softwarefx.com | |||||||
| PREV CLASS NEXT CLASS | FRAMES NO FRAMES | |||||||
| SUMMARY: NESTED | FIELD | CONSTR | METHOD | DETAIL: FIELD | CONSTR | METHOD | |||||||