 SoftwareFX.ChartFX.AxisSectionBase
SoftwareFX.ChartFX.AxisBase
SoftwareFX.ChartFX.AxisSectionBase
SoftwareFX.ChartFX.AxisBase
|
Chart FX for Java 6.5 | |||||||
| PREV CLASS NEXT CLASS | FRAMES NO FRAMES | |||||||
| SUMMARY: NESTED | FIELD | CONSTR | METHOD | DETAIL: FIELD | CONSTR | METHOD | |||||||
java.lang.Object
public abstract class AxisBase
Provides access to the AxisBase object.
This Base class is not intended to be used directly by the programmer, however, derived classes of the AxisBase can be used for axis customization. For example, the Axis class is derived from the AxisBase and its members accessible through the use of the Axis, AxisX and AxisY properties.
The AxisBase class is comprised of members which allow general customization for the selected axis. Using these properties, you will be able to set grids as well as grid attributes, format axis labels, set min and max, and control axis titles.
| Constructor Summary | |
|---|---|
AxisBase()
|
|
| Method Summary | |
|---|---|
void |
adjustScale()
Adjusts the selected axis to "nice" scale values. |
void |
clearLabels()
Clears all labels for a selected axis. |
java.awt.Color |
getAlternateColor()
Gets the AlternateColor. |
Line |
getGrid()
Returns a Line object used to customize the gridlines for a selected Axis or AxisSection object. |
ValueFormat |
getLabelsFormat()
Used to format the labels displayed on the selected axis. |
Link |
getLink()
Gets the Link object for a selected Axis or AxisSection item. |
double |
getMax()
Gets the Max. |
double |
getMin()
Gets the Min. |
Line |
getMinorGrid()
Returns a Line object used to customize the minor gridlines. |
int |
getMinorTickMark()
Gets the MinorTickMark. |
int |
getPosition()
Gets the Position. |
java.awt.Color |
getTextColor()
Gets the TextColor. |
int |
getTickMark()
Gets the TickMark. |
Title |
getTitle()
Gets the Title. |
boolean |
isForceZero()
Gets the ForceZero. |
boolean |
isGridlines()
Gets the Gridlines. |
boolean |
isMinorGridlines()
Gets the MinorGridlines. |
boolean |
isVisible()
Gets the Visible. |
boolean |
isYAxis()
Gets the YAxis. |
double |
pixelToValue(int xyPixel)
Converts a position in pixels in the chart area to its value representation on the selected axis. |
void |
resetScale()
Prepares the selected axis to receive new data by resetting scale values. |
void |
setAlternateColor(java.awt.Color value)
Gets or sets the AlternateColor for a selected Axis or AxisSection object. |
void |
setForceZero(boolean value)
Gets or sets a value indicating whether or not to start an axis mininum value at zero. |
void |
setGridlines(boolean value)
Gets or sets a value indicating to show gridlines for the selected Axis or AxisSection object. |
void |
setMax(double value)
Defines the maximum value of a specific axis. |
void |
setMin(double value)
Defines the minimum value of a selected axis. |
void |
setMinorGridlines(boolean value)
Gets or sets a value indicating whether to show or hide minor gridlines. |
void |
setMinorTickMark(int value)
Gets or sets the style for the minor tick marks of an Axis or AxisSection object. |
void |
setPosition(int value)
Specifies the placement of the axis labels and tick marks relative to the chart. |
void |
setTextColor(java.awt.Color value)
Gets or sets the color for text of a selected Axis or AxisSection object. |
void |
setTickMark(int value)
Gets or sets the style for the tick marks of an Axis or AxisSection object. |
void |
setTitle(Title value)
Gets or sets the title object for a specific axis. |
void |
setVisible(boolean value)
Shows or hides the lines, labels, tick marks and grids for the selected axis. |
void |
setYAxis(boolean value)
Used to set the orientation (X or Y) for a newly created axis. |
int |
valueToPixel(double dValue)
Converts a logical chart value to its position in pixels for a selected axis. |
| Methods inherited from class java.lang.Object |
|---|
equals, getClass, hashCode, notify, notifyAll, toString, wait, wait, wait |
| Constructor Detail |
|---|
public AxisBase()
| Method Detail |
|---|
public void adjustScale()
Adjusts the selected axis to "nice" scale values.
This method is not useful if the Axis.setAutoScale(boolean) member is enabled (true), as Chart FX will recalculate (ChartCore.recalcScale()) scale values and adjust (AdjustScale) the axis accordingly. But if you disable the AutoScale feature to set your own Min and Max (and Step when applicable) you can use this method to round them to "nice" values.
"Nice" values are calculated according to the values associated with the axis in powers of 10, For example:
If your y axis ranges from 0-18, the AdjustScale method can round the Max value to 20.
If your y axis ranges from 0-0.56, the AdjustScale method can round the Max Value to 0.6.
If your y axis ranges from 0-234, the AdjustScale method can round the Max Value to 300.
This method will not affect the Axis.setStep(double) and Axis.setMinorStep(double) if they have been previously set. To make sure they respond to this method make sure the Step and MinorStep properties are set to zero (0).
A typical case of when to use this method is when you disable the Axis.setAutoScale(boolean) member to calculate your Min and Max and any of them is not a "nice" number because they are being calculated according to the data being sent to the chart. At this time, you can invoke the AdjustScale method so they are rounded to "nice" numbers.
Axis.setAutoScale(boolean),
Axis.setMinorStep(double),
Axis.setStep(double),
ChartCore.recalcScale(),
Axis,
Chartpublic void clearLabels()
Clears all labels for a selected axis.
To can add labels to the desired axis using the Axis.getLabel(int) member of the Axis class.
You may use the AdjustScale method to adjust the scale of a selected axis to "nice" values.
Axis.getLabel(int),
adjustScale(),
Axispublic java.awt.Color getAlternateColor()
Gets the AlternateColor. For more detail see setAlternateColor(java.awt.Color).
getAlternateColor in class AxisSectionBasepublic Line getGrid()
Returns a Line object used to customize the gridlines for a selected Axis or AxisSection object.
Please see the Line class for the supported members exposed by this property.
Use the AxisSectionBase.setGridlines(boolean) member to show or hide the axis gridlines for the AxisSection object.
The Axis.getSections() member returns an AxisSection object which may be configured using the AxisSection classs members.
getGrid in class AxisSectionBaseAxisSectionBase.setGridlines(boolean),
Axis.getSections(),
Line,
Axispublic ValueFormat getLabelsFormat()
Used to format the labels displayed on the selected axis.
This property allows you to format axis labels without effecting the format of the data values contained in the chart.
You can use the Axis.getDataFormat() member to set a format for selected point labels, mouseover tips or values.
The LabelsFormat property returns a ValueFormat object. Please see the ValueFormat class for more information regarding supported members.
ChartCore.getAxisX(),
ChartCore.getAxisY(),
ChartCore.getAxis(int),
Axis.getDataFormat(),
Chart,
ValueFormatpublic Link getLink()
Gets the Link object for a selected Axis or AxisSection item.
Developers may obtain the Link object for an axis section item using this property. Using the supported Link class members, developers may configure a URL and Target using the respective members (Link.setUrl(java.lang.String) and Link.setTarget(java.lang.String)).
getLink in class AxisSectionBaseLink.setUrl(java.lang.String),
Link.setTarget(java.lang.String),
Linkpublic double getMax()
Gets the Max. For more detail see setMax(double).
public double getMin()
Gets the Min. For more detail see setMin(double).
public Line getMinorGrid()
Returns a Line object used to customize the minor gridlines.
Please see the Line class for the supported members exposed by this property.
Control the Step for the minor grids using the Axis.setMinorStep(double) member.
Use the AxisSectionBase.setMinorGridlines(boolean) member to show or hide the axis gridlines for a selected axis object.
The Axis.getSections() property returns an AxisSection object which may be configured using the AxisSection and AxisSectionBase classs members.
The Axis.getSections() member returns an AxisSection object which may be configured using the AxisSection class members.
getMinorGrid in class AxisSectionBaseAxisSectionBase.setMinorGridlines(boolean),
Axis.getSections(),
Axis,
AxisSectionpublic int getMinorTickMark()
Gets the MinorTickMark. For more detail see setMinorTickMark(int).
getMinorTickMark in class AxisSectionBasepublic int getPosition()
Gets the Position. For more detail see setPosition(int).
public java.awt.Color getTextColor()
Gets the TextColor. For more detail see setTextColor(java.awt.Color).
getTextColor in class AxisSectionBasepublic int getTickMark()
Gets the TickMark. For more detail see setTickMark(int).
getTickMark in class AxisSectionBasepublic Title getTitle()
Gets the Title. For more detail see setTitle(SoftwareFX.ChartFX.Title).
public boolean isForceZero()
Gets the ForceZero. For more detail see setForceZero(boolean).
public boolean isGridlines()
Gets the Gridlines. For more detail see setGridlines(boolean).
isGridlines in class AxisSectionBasepublic boolean isMinorGridlines()
Gets the MinorGridlines. For more detail see setMinorGridlines(boolean).
isMinorGridlines in class AxisSectionBasepublic boolean isVisible()
Gets the Visible. For more detail see setVisible(boolean).
public boolean isYAxis()
Gets the YAxis. For more detail see setYAxis(boolean).
public double pixelToValue(int xyPixel)
Converts a position in pixels in the chart area to its value representation on the selected axis.
The origin or (0,0) coordinate in pixels, is always positioned in the top/left corner of the chart, without including the toolbar or other tools that may be showing in the chart area.
When customizing the chart painting or positioning annotation objects in the chart area. You may want to convert a particular position in pixels to axis coordinates. Therefore, this method is particularly useful for this purpose.
The valueToPixel(double) method provides the opposite result, converting chart axis value to pixel coordinates in the chart.
All mouse events return event arguments that hold the X and Y pixel values where the mouse event was fired in the chart area. By converting the pixels you can determine the point value where the user clicked. Chart FX for Java only supports Client-Side Mouse events when generating charts as objects (Active Charts).
xyPixel - An integer specifying the pixel value to be converted.ChartCore.getAxisX(),
ChartCore.getAxisY(),
valueToPixel(double),
Chartpublic void resetScale()
Prepares the selected axis to receive new data by resetting scale values.
This method was formerly the ResetMaxMin enumeration of the ChartCore.openData(int, int, int) method.
This method is to be called before new data is going to be send to the chart.
This method resets all scale values for the selected axis so new when new data is set Chart FX can recalculate values accordingly.
The affected scale values are:
setMin(double) and setMax(double) which are set to undefined so when new data arrives they can be calculated accordingly by Chart FX.
Axis.setStep(double) and Axis.setMinorStep(double) which are set to Automatic.
This method should be called before sending new data to the chart. Calling this method after setting the data to the chart will cause undesired results. Please refer to the ChartCore.recalcScale() method to recalculate automatic values for existent data.
setMax(double),
setMin(double),
Axis.setStep(double),
Axis.setMinorStep(double),
ChartCore.openData(int, int, int),
ChartCore.closeData(int),
ChartCore.recalcScale(),
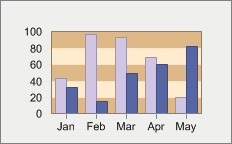
Chartpublic void setAlternateColor(java.awt.Color value)
Gets or sets the AlternateColor for a selected Axis or AxisSection object.
The AlternateColor is used when the selected axis is configured as Axis.setInterlaced(boolean). The other color is defined by the configured ChartCore.setInsideColor(java.awt.Color).
The AxisSectionBase.setTextColor(java.awt.Color) property is used to control the color for the text of the selected Axis or AxisSection object.
The Axis.getSections() member returns an AxisSection object which may be configured using the AxisSection class members.
For more information regarding the Color type, please refer to the Java API Documentation.
Here is an example of an Interlaced Y axis:
setAlternateColor in class AxisSectionBaseAxis.setInterlaced(boolean),
AxisSectionBase.setTextColor(java.awt.Color),
Axis.getSections(),
ChartCore.setInsideColor(java.awt.Color),
Axis,
AxisSectionpublic void setForceZero(boolean value)
Gets or sets a value indicating whether or not to start an axis mininum value at zero.
By default, Chart FX will set the minimum value of a numerical axis to zero even if the data set starts at a greater value. If you want Chart FX to automatically set the minimum value of the axis to the minimum value in the data passed, set this property to FALSE.
This property can also be controlled by the Axis.setStyle(int) member and the AS_FORCEZERO flag.
This property can also be controlled by the Axis.setStyle(int) member and the AS_FORCE_ZERO flag.
This property applies to numerical axes only.
Axis.setStyle(int),
Axispublic void setGridlines(boolean value)
Gets or sets a value indicating to show gridlines for the selected Axis or AxisSection object.
The AxisSectionBase.getGrid() member returns a Line object which may be customized using the supported Line class members.
The Axis.getSections() member returns an AxisSection object which may be configured using the AxisSection class members.
setGridlines in class AxisSectionBaseAxisSectionBase.getGrid(),
Axis.getSections(),
AxisSection,
Axispublic void setMax(double value)
Defines the maximum value of a specific axis.
Gets or sets the Max value assigned to the specified axis.
The Max property can be applied only to a numerical axis, a categorical axis will ignore this setting.
The Max property is a member of the axis object, therefore the axis object must be referenced in order to properly access the Max property.
If no Max value is specified, Chart FX will automatically set a maximum value according to the data provided, you can use this property to read or write this default value.
Resetting the data contained in a chart will not automatically set a new Max value unless the ChartCore.recalcScale() method is called or the Axis.setAutoScale(boolean) member is set to True.
The value of the Max property must be greater than the value of the Min property.
There is no automatic method for aligning a main and secondary axis, it is required that you set the Min and Max in order to align them manually. The generic algorithm used to find these values is the following:
Axis.Min = OtherAxis.Min/(OtherAxis.Max / Axis.Max)
Axis.setAutoScale(boolean),
ChartCore.getAxisX(),
ChartCore.getAxisY(),
ChartCore.getAxis(int),
setMin(double),
ChartCore.recalcScale(),
Chartpublic void setMin(double value)
Defines the minimum value of a selected axis.
Gets or sets the Min value assigned to the specified axis.
The Min property can be applied only to a numerical axis, a categorical axis will ignore this setting.
The Min property is a member of the axis object, therefore the axis object must be referenced in order to properly access the Min property.
If no Min value is specified, Chart FX will automatically set a minimum value according to the data provided, you can use this property to read or write this default value.
Changing the data contained in a chart will not automatically set a new Min value unless the ChartCore.recalcScale() method is called or the Axis.setAutoScale(boolean) member is set to True.
The value of the Min property must be lesser than the value of the Max property.
There is no automatic method for aligning a main and secondary axis, it is required that you set the Min and Max in order to align them manually. The generic algorithm used to find these values is the following:
Axis.Min = OtherAxis.Min/(OtherAxis.Max / Axis.Max)
Axis.setAutoScale(boolean),
ChartCore.getAxisX(),
ChartCore.getAxisY(),
ChartCore.getAxis(int),
setMax(double),
ChartCore.recalcScale(),
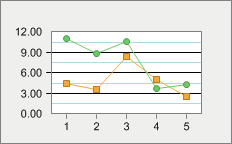
Chartpublic void setMinorGridlines(boolean value)
Gets or sets a value indicating whether to show or hide minor gridlines.
The minor interval is controlled by the Axis.setMinorStep(double) member, which must be set in order to use the MinorGrid. You can control the major interval using the Axis.setStep(double) member.
The AxisSectionBase.getMinorGrid() member returns a Line object which may be customized using the supported Line class members.
You can use the AxisSectionBase.setGridlines(boolean) and AxisSectionBase.getGrid() members to configure the major grids for a chart.
The Axis.getSections() member returns an AxisSection object which may be configured using the AxisSection class members.
Below the MinorGrid (LightBlue) has been set to True, and the Axis.setMinorStep(double) member was set to 1.5:
setMinorGridlines in class AxisSectionBaseAxisSectionBase.getMinorGrid(),
Axis.getSections(),
Axis,
AxisSectionpublic void setMinorTickMark(int value)
Gets or sets the style for the minor tick marks of an Axis or AxisSection object.
TickMark : Define the different ways of displaying tick marks at the major and minor gridlines on the selected axis. | Value | Description |
|---|---|
TickMark.NONE | Hides tick marks for the selected axis. |
TickMark.OUTSIDE | Displays tick marks on the outside of the selected axis. |
TickMark.INSIDE | Displays tick marks on the inside of the selected axis. |
TickMark.CROSS | Displays tick marks that cross inside and outside the selected axis. |
This property applies only to the minor gridlines, for the major gridlines please refer to the AxisSectionBase.setTickMark(int) member.
The tick mark is not the gridline that crosses the entire chart, it is just a reference line that appears on every tick of the minor unit of the axis. If you want to display a gridline that crosses the chart, please refer to the AxisSectionBase.setMinorGridlines(boolean) member.
The Axis.getSections() member returns an AxisSection object which may be configured using the AxisSection class members.
setMinorTickMark in class AxisSectionBaseAxisSectionBase.setTickMark(int),
AxisSectionBase.getMinorGrid(),
Axis.getSections(),
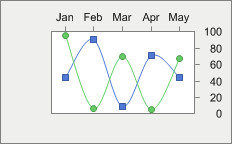
Axispublic void setPosition(int value)
Specifies the placement of the axis labels and tick marks relative to the chart.
AxisPosition : Specifies the placement of the axis line relative to the chart.| Value | Description |
|---|---|
AxisPosition.NEAR | Specifies the axis line be placed near the chart in the following way: In a X axis, the axis line be below the chart. In Y axis, the axis line be left to the chart. |
AxisPosition.CENTER | Specifies that axis line placed in the center of the chart. |
AxisPosition.FAR | Specifies that axis line is placed far from the chart in the following way: In a X axis, the axis line be above the chart. In a Y axis, the axis line is right to the chart. |
The Position property is a member of the axis object, therefore the axis object must be referenced in order to set the property correctly.
Multiple axes may be created using the ChartCore.getAxis(int) member of the chart object.
Both X and Y axes have been set to the AxisPosition.FAR position to switch their default locations:
ChartCore.getAxisX(),
ChartCore.getAxisY(),
ChartCore.getAxis(int),
Axis.getLabel(int),
AxisSectionBase.setTickMark(int),
Chartpublic void setTextColor(java.awt.Color value)
Gets or sets the color for text of a selected Axis or AxisSection object.
The TextColor member is used to set a color for the specified Axis or AxisSection labels. Please refer to the TextColor property of the Title object to customize the color for the axis title.
The Axis.getSections() member returns an AxisSection object which may be configured using the AxisSection and class members.
For more information regarding the Color type, please refer to your development environment documentation.
setTextColor in class AxisSectionBaseAxis.getSections(),
Axis,
AxisSectionpublic void setTickMark(int value)
Gets or sets the style for the tick marks of an Axis or AxisSection object.
TickMark : Define the different ways of displaying tick marks at the major and minor gridlines on the selected axis. | Value | Description |
|---|---|
TickMark.NONE | Hides tick marks for the selected axis. |
TickMark.OUTSIDE | Displays tick marks on the outside of the selected axis. |
TickMark.INSIDE | Displays tick marks on the inside of the selected axis. |
TickMark.CROSS | Displays tick marks that cross inside and outside the selected axis. |
This property applies only to the major gridlines, for the minor gridlines please refer to the AxisSectionBase.setMinorTickMark(int) member.
The tick mark is not the gridline that crosses the entire chart, it is just a reference line that appears on every tick of the minor unit of the axis. If you want to display a gridline that crosses the chart, please refer to the AxisSectionBase.setGridlines(boolean) member.
The Axis.getSections() member returns an AxisSection object which may be configured using the AxisSection and class members.
The major unit is controlled by the Axis.setStep(double) member.
setTickMark in class AxisSectionBaseAxisSectionBase.setMinorTickMark(int),
AxisSectionBase.setGridlines(boolean),
Axis.getSections(),
Axis.setStep(double),
Axis,
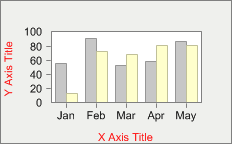
AxisSectionpublic void setTitle(Title value)
Gets or sets the title object for a specific axis.
The Title property is a member of the axis object; therefore, the axis object must be referenced in order to properly utilize the Title property.
This property receives or returns a Title class. Accessing the title object properties you will be able to change attributes like: Alignment, Color, Font,Text, etc.
This property is used to get or set title objects for the the axis. To set the chart top title, please refer to the chart object ChartCore.getTitles() property.
You can create a multiple line title by including a new line character inside the title string.
Below is a chart with both X and Y Axis titles:
ChartCore.getAxisX(),
ChartCore.getAxisY(),
Title.setText(java.lang.String),
ChartCore.getAxis(int),
Chart,
Titlepublic void setVisible(boolean value)
Shows or hides the lines, labels, tick marks and grids for the selected axis.
The Visible property is a member of the axis object; therefore, the axis object must be referenced in order to properly utilize the Visible property.
By hiding the labels for the specified axis using the Visible property, other attributes such as the AxisSectionBase.getGrid() and tick marks are also hidden.
The X axis has been hidden in the chart below:
ChartCore.getAxisX(),
ChartCore.getAxisY(),
ChartCore.getAxis(int),
Chartpublic void setYAxis(boolean value)
Used to set the orientation (X or Y) for a newly created axis.
When you create a new axis using the Axis property, you may assign the axis as an X or Y axis. When YAxis is set to True, the new axis will be a vertical Y axis. When YAxis is set to False, the new axis will be a horizontal X axis.
The setPosition(int) member allows you to position an axis Near or Far.
You can use the Axis.setSeparation(int) member to modify the gap between axes.
There is no automatic method for aligning a main and secondary axis, it is required that you set the Min and Max in order to align them manually. The generic algorithm used to find these values is the following:
Axis.Min = OtherAxis.Min/(OtherAxis.Max / Axis.Max)
ChartCore.getAxis(int),
setPosition(int),
Axis.setSeparation(int),
Chartpublic int valueToPixel(double dValue)
Converts a logical chart value to its position in pixels for a selected axis.
When customizing the chart painting or positioning annotation objects in the chart area. You may want to convert a particular position in the chart area given in axis units to screen coordinates (pixels). Therefore, this method is particularly useful for this purpose.
The pixelToValue(int) method provides the opposite result, converting screen coordinates to axis values in the chart.
dValue - A double specifying the point value to be converted.ChartCore.getAxisX(),
ChartCore.getAxisY(),
pixelToValue(int),
Chart
|
http://www.softwarefx.com | |||||||
| PREV CLASS NEXT CLASS | FRAMES NO FRAMES | |||||||
| SUMMARY: NESTED | FIELD | CONSTR | METHOD | DETAIL: FIELD | CONSTR | METHOD | |||||||