 SoftwareFX.ChartFX.AxisSectionBase
SoftwareFX.ChartFX.AxisBase
SoftwareFX.ChartFX.Axis
SoftwareFX.ChartFX.AxisSectionBase
SoftwareFX.ChartFX.AxisBase
SoftwareFX.ChartFX.Axis
|
Chart FX for Java 6.5 | |||||||
| PREV CLASS NEXT CLASS | FRAMES NO FRAMES | |||||||
| SUMMARY: NESTED | FIELD | CONSTR | METHOD | DETAIL: FIELD | CONSTR | METHOD | |||||||
java.lang.Object
public final class Axis
Provides access to the Axis object.
Axes are one of the most important aspects in a chart since they provide users with a visual means to read and analyze data. Therefore, a charting tool must provide mechanisms to manipulate axis settings programmatically.
Chart FX automatically configures axes accommodating the data that was used to populate the chart. This behavior will minimize the initial programming effort of customizing the chart's axes. However, in some cases programmers will face complex needs like special labeling, scrolling, formatting and scaling that must be addressed via code. To achieve this, Chart FX provides a powerful object-oriented API, so programmers can customize virtually any axis setting.
It's important to be aware that Chart FX supports many different axes: The main Y Axis, the Secondary Y axis and the X-Axis are illustrated in the following figure:

Normally, the X-axis is a categorical axis (although it can also be a numerical axis in XY Plots) and the Y axes are numerical axis that you can independently control through different properties available in the axis object.
One of the major advantages in Chart FX numerical axis handling is the introduction of major and minor units which will allow you to control gridlines, tick marks and labels associated with the axis. For example, you could have a chart where the primary Y axis ranges from 0-100, the labels are position every 25 with a cross tick mark and gridlines position every 12.5 units, as depicted in the following figure.

Multiple Axes
Chart FX supports the configuration of multiple axes in your charts. Most gallery types include two axes by default; however, sometimes another axis can be beneficial in conveying information to the user.
The Axis property is used to create multiple axes. This array property allows you to specify an index so you may create many different axes. Some index values have been reserved such as 0 (primary Y axis), 1 (secondary Y axis) and 2 (primary X axis), therefore, to add an additional axis you must start using the index value 3.
To create an additional axis in your chart, you must specify the desired max and min values the axis will reflect:
//Create and set the Max and Min for axis3Axis axis3 = chart1.getAxis(3);axis3.setMax(100);axis3.setMin(0);By default, additional axes are configured as a new Y axis (vertical). If you would like a newly create axis to act as an X axis (horizontal) you can use the YAxis property:
//Create axis4Axis axis4 = chart1.getAxis(4);//Set as additional Y axis (vertical)axis4.setYAxis(true);//Set as additional X axis (horizontal)axis4.setYAxis(false);You can also control the axis position relative to the charting area using the Position property. The axis position may be configured to Near, Center or Far. This will control what side of the chart the axis is created.
//Create axis5Axis axis5 = chart1.getAxis(5);//Set the axis position to Nearaxis5.setPosition(AxisPosition.Near);//Set the axis position to Faraxis5.setPosition(AxisPosition.Far);
Important Note: When assigning a series to a Secondary Y axis you should make sure that you make the axis assignment before passing data. By doing this, Chart FX will calculate the AxisBase.setMax(double), AxisBase.setMin(double) and setStep(double) for the secondary Y axis automatically. If the axis assignment is done after the data has been passed, you can set the Max, Min and Step manually or call the ChartCore.recalcScale() method. Please keep in mind that calling the RecalcScale method is a less efficient way to create the chart.
There is no automatic method for aligning a main and secondary axis, it is required that you set the Min and Max in order to align them manually. The generic algorithm used to find these values is the following:
Axis.Min = OtherAxis.Min / (OtherAxis.Max / Axis.Max)
| Constructor Summary | |
|---|---|
Axis()
|
|
| Method Summary | |
|---|---|
double[] |
getCustomSteps()
Gets the CustomSteps. |
ValueFormat |
getDataFormat()
Used to format the data displayed on point labels and tool tips shown at a mouseover. |
int |
getFirstLabel()
Gets the FirstLabel. |
java.awt.Font |
getFont()
Gets the Font. |
LabelList |
getKeyLabel()
Sets key (short) labels for a selected Axis. |
java.lang.String |
getKeyLabel(int i)
Deprecated. You should use getKeyLabel() instead. |
LabelList |
getLabel()
Sets labels for a selected Axis. |
java.lang.String |
getLabel(int i)
Deprecated. You should use getLabel() instead. |
short |
getLabelAngle()
Gets the LabelAngle. |
double |
getLabelValue()
Gets the LabelValue. |
Line |
getLine()
Allows you to apply supported Line class members to a selected axis line. |
double |
getLogBase()
Gets the LogBase. |
double |
getMinorStep()
Gets the MinorStep. |
int |
getPane()
Gets the Pane. |
double |
getPixPerUnit()
Gets the PixPerUnit. |
double |
getScaleUnit()
Gets the ScaleUnit. |
int |
getScrollPosition()
Gets the ScrollPosition. |
int |
getScrollSize()
Gets the number of scrolls in a chart based on the scroll view configuration. |
double |
getScrollViewMax()
Returns the maximun value for an axis at the current scroll position. |
double |
getScrollViewMin()
Returns the minimum value for an axis at the current scroll position. |
AxisSection |
getSection(int n)
Deprecated. You should use getSections() instead. |
AxisSectionCollection |
getSections()
Returns a selected AxisSection object. |
int |
getSeparation()
Gets the Separation. |
double |
getStep()
Gets the Step. |
int |
getStyle()
Gets the Style. |
boolean |
isAutoScale()
Gets the AutoScale. |
boolean |
isHorizontal()
Returns a boolean value specifying whether the select axis is a horizontal or vertical axis. |
boolean |
isInterlaced()
Gets the Interlaced. |
boolean |
isInverted()
Gets the Inverted. |
boolean |
isNotify()
Gets the Notify. |
boolean |
isStaggered()
Gets the Staggered. |
void |
setAutoScale(boolean value)
Instructs Chart FX to always recalculate the specified Axis scale values (Min, Max) when new values are set to the chart. |
void |
setCustomSteps(double[] steps)
Gets or sets a custom step for the selected axis. |
void |
setFirstLabel(int value)
Gets or sets a value used to customize the first label displayed on a selected axis. |
void |
setFont(java.awt.Font value)
Allows you to change the label Font attributes of the selected axis. |
void |
setInterlaced(boolean value)
Creates a grid of alternating colors for a selected axis to improve chart readability. |
void |
setInverted(boolean value)
Gets or sets a value specifying if a selected numerical axis max value is lesser than the min value. |
void |
setKeyLabel(int i,
            java.lang.String value)
Deprecated. You should use getKeyLabel() instead. |
void |
setLabel(int i,
         java.lang.String value)
Deprecated. You should use getLabel() instead. |
void |
setLabelAngle(short value)
Sets the text rotation for the labels in the selected axis. |
void |
setLabelValue(double value)
Allows you to set associate text labels to major tick marks in a numerical axis. |
void |
setLogBase(double value)
Used to set a logarithmic scale for a numerical axis and recalculate the values as powers equal to the setting of this property. |
void |
setMinorStep(double value)
Specifies the increment you want between minor tick marks and minor gridlines (if they are displayed) on the selected axis. |
void |
setNotify(boolean value)
Used to enable or disable the GetAxisLabel event so you can customize labels on the specified axis. |
void |
setPane(int value)
Gets or sets an integer value specifying the Pane for an Axis object. |
void |
setPixPerUnit(double value)
Gives you the ability to control how many pixels per unit are in a selected axis. |
void |
setScaleUnit(double value)
Gets or sets the scale unit of a selected axis. |
void |
setScrollPosition(int value)
Gets or sets the starting scroll position when a chart is scrollable. |
void |
setScrollView(double min,
              double max)
Calculates the appropriate PixPerUnit and related scale values to create a scroll bar to view a portion of the selected axis. |
void |
setSeparation(int value)
Gets or sets a gap value (in pixels) between multiple axis. |
void |
setStaggered(boolean value)
Alternates the level of the axis labels for the selected axis labels. |
void |
setStep(double value)
Specifies the interval of major tick marks and gridlines on the selected axis. |
void |
setStyle(int value)
Allows you to add additional styles to the selected axis. |
void |
zoom(double min,
     double max)
Allows you to specify a min and max zoom value for a selected axis. |
void |
zoomOff()
Allows you to ignore any zoom attributes set using the Zoom method and return to the default axis view. |
| Methods inherited from class SoftwareFX.ChartFX.AxisBase |
|---|
adjustScale, clearLabels, getAlternateColor, getGrid, getLabelsFormat, getLink, getMax, getMin, getMinorGrid, getMinorTickMark, getPosition, getTextColor, getTickMark, getTitle, isForceZero, isGridlines, isMinorGridlines, isVisible, isYAxis, pixelToValue, resetScale, setAlternateColor, setForceZero, setGridlines, setMax, setMin, setMinorGridlines, setMinorTickMark, setPosition, setTextColor, setTickMark, setTitle, setVisible, setYAxis, valueToPixel |
| Methods inherited from class java.lang.Object |
|---|
equals, getClass, hashCode, notify, notifyAll, toString, wait, wait, wait |
| Constructor Detail |
|---|
public Axis()
| Method Detail |
|---|
public double[] getCustomSteps()
Gets the CustomSteps. For more detail see setCustomSteps(double[]).
public ValueFormat getDataFormat()
Used to format the data displayed on point labels and tool tips shown at a mouseover.
The ChartCore.setPointLabelMask(java.lang.String) member will overwrite the settings for point labels. Mouse over tips will retain the DataFormat settings.
The AxisBase.getLabelsFormat() member can be used to format the selected axis labels.
Setting this property for the chart will also format data viewed via the Chart FX data editor.
The DataFormat member returns a ValueFormat object. Please see the ValueFormat class for more information regarding supported members.
AxisBase.getLabelsFormat(),
ChartCore.setPointLabelMask(java.lang.String),
ChartCore.setPointLabels(boolean),
ChartCore.getAxisX(),
ChartCore.getAxisY(),
ChartCore.setDataEditor(boolean),
Chart,
ValueFormatpublic int getFirstLabel()
Gets the FirstLabel. For more detail see setFirstLabel(int).
public java.awt.Font getFont()
Gets the Font. For more detail see setFont(java.awt.Font).
public java.lang.String getKeyLabel(int i)
getKeyLabel() instead.
LabelListpublic LabelList getKeyLabel()
Sets key (short) labels for a selected Axis.
The getLabel(int) member is used to assign string labels to the tickmarks in the X axis (when generating charts with a categorical axis). Depending on the amount of points in the chart, these labels may be too long to properly fit in the space allotted for each tickmark in the X axis.
Labels customization may be accomplished using the supported members of the Axis object. Remember the size of the chart may also limit the available space to position labels.
This property can help you display shorter labels in the X axis while maintaining longer labels in the legend window. Let's give you an example:
Let's suppose you have assigned the following labels to the X axis using the Label property:
"January", "February", "March", "April", "May", "June", "July", "August", "September", "October", "November" and "December"
Now, these labels may or may not fit in the space allotted for each tickmark in the X axis. Using this property you can assign key labels (shorter strings) like: "Jan","Feb","Mar",Apr", etc... that will be displayed in the X axis itself, while the Legend window will display both the Key Legend and the Legend set with the Label property.
ChartCore.getAxisX(),
ChartCore.getAxisY(),
getLabel(int),
ChartCore.setLegendBox(boolean),
ChartCore.getKeyLeg(int),
Chart,
LegendBoxpublic java.lang.String getLabel(int i)
getLabel() instead.
LabelListpublic LabelList getLabel()
Sets labels for a selected Axis.
This member is used to set labels for a categorical axis. Normally, the X axis is a categorical axis containing labels associated with each major tick mark, while the Y axis is a numerical axis where labels are controlled by the scale (Min, Max, etc) and numerical data contained in the chart.
You may configure as many labels as points are available in the chart. These labels will be shown in the major tick marks of the selected axis. Some of them can be left empty so no labels are shown on that specific major tick mark.
The frequency of these labels are controlled using the setStep(double) member. Label visual attributes like rotation, color and font are also accessible through the setLabelAngle(short), AxisSectionBase.setTextColor(java.awt.Color), and setFont(java.awt.Font) members, respectively.
When used in conjunction with the setLabelValue(double) member, this property can be used to set string values to a numerical axis.
You can easily remove all labels set to an axis with the ChartCore.clearData(int) method.
ChartCore.getAxisX(),
ChartCore.getAxisY(),
setStep(double),
setLabelAngle(short),
setLabelValue(double),
AxisSectionBase.setTextColor(java.awt.Color),
setFont(java.awt.Font),
ChartCore.getAxis(int),
ChartCore.clearData(int),
Chartpublic short getLabelAngle()
Gets the LabelAngle. For more detail see setLabelAngle(short).
public double getLabelValue()
Gets the LabelValue. For more detail see setLabelValue(double).
public Line getLine()
Allows you to apply supported Line class members to a selected axis line.
The Line.setColor(java.awt.Color),Line.setWidth(int) and Line.setStyle(int) members of the Line class may be used to customize the appearence of the axis line.
The Line.setEndCap(int) and Line.setStartCap(int) members allow you to configured various shapes at the beginning and ending of a selected line.
Line.setColor(java.awt.Color),
Line.setWidth(int),
Line.setStyle(int),
Line.setEndCap(int),
Line.setStartCap(int),
ChartCore.getAxisX(),
ChartCore.getAxisY(),
Line,
Axispublic double getLogBase()
Gets the LogBase. For more detail see setLogBase(double).
public double getMinorStep()
Gets the MinorStep. For more detail see setMinorStep(double).
public int getPane()
Gets the Pane. For more detail see setPane(int).
public double getPixPerUnit()
Gets the PixPerUnit. For more detail see setPixPerUnit(double).
public double getScaleUnit()
Gets the ScaleUnit. For more detail see setScaleUnit(double).
public int getScrollPosition()
Gets the ScrollPosition. For more detail see setScrollPosition(int).
public int getScrollSize()
Gets the number of scrolls in a chart based on the scroll view configuration.
(Read only)
You may configure the scroll position using the setScrollPosition(int) member.
You may set the scroll view for a selected axis using the setScrollView(double, double) property. The getScrollViewMin() and getScrollViewMax() methods may be used to read these values from an axis.
setScrollPosition(int),
setScrollView(double, double)public double getScrollViewMax()
Returns the maximun value for an axis at the current scroll position.
Please refer to the setScrollView(double, double) method for more information on the use of this method.
getScrollViewMin(),
ChartCore.getAxisX(),
ChartCore.getAxisY(),
setScrollView(double, double),
Chartpublic double getScrollViewMin()
Returns the minimum value for an axis at the current scroll position.
Please refer to the setScrollView(double, double) method for more information on the use of this method.
getScrollViewMax(),
ChartCore.getAxisX(),
ChartCore.getAxisY(),
setScrollView(double, double),
Chartpublic AxisSection getSection(int n)
getSections() instead.
AxisSectionCollectionpublic AxisSectionCollection getSections()
Returns a selected AxisSection object.
This method returns an AxisSection object. Please see the AxisSection object for additional information regarding the supported members.
AxisSectionpublic int getSeparation()
Gets the Separation. For more detail see setSeparation(int).
public double getStep()
Gets the Step. For more detail see setStep(double).
public int getStyle()
Gets the Style. For more detail see setStyle(int).
public boolean isAutoScale()
Gets the AutoScale. For more detail see setAutoScale(boolean).
public boolean isHorizontal()
Returns a boolean value specifying whether the select axis is a horizontal or vertical axis.
When the return value of this property is True, the selected axis is horizontal. If False, the selected axis is a vertical axis.
This property will return False if the selected axis has not been enabled in the chart.
ChartCore.getAxis(int),
ChartCore.getAxisX(),
ChartCore.getAxisY(),
AxisBase.setYAxis(boolean),
Chartpublic boolean isInterlaced()
Gets the Interlaced. For more detail see setInterlaced(boolean).
public boolean isInverted()
Gets the Inverted. For more detail see setInverted(boolean).
public boolean isNotify()
Gets the Notify. For more detail see setNotify(boolean).
public boolean isStaggered()
Gets the Staggered. For more detail see setStaggered(boolean).
public void setAutoScale(boolean value)
Instructs Chart FX to always recalculate the specified Axis scale values (Min, Max) when new values are set to the chart.
If you set a Min or Max value and new data is received by the chart when the AutoScale property is enabled, the scale values will be overwritten by Chart FX. This method will not affect the Step property if it has previously set to a specific value. If you want the AutoScale property to recalculate the setStep(double) value, make sure the Step property is set to zero (0).
The ChartCore.recalcScale() method is used to instruct a chart to recaculate. When called, the chart is re-scaled.
ChartCore.getAxis(int),
ChartCore.getAxisX(),
ChartCore.getAxisY(),
AxisBase.setMin(double),
AxisBase.setMax(double),
setStep(double),
setMinorStep(double),
ChartCore.recalcScale(),
Chartpublic void setCustomSteps(double[] steps)
Gets or sets a custom step for the selected axis.
The CustomSteps property holds an array of numbers (double) that specifies the custom step for a selected axis.
The step applied to the axis will begin to cycle if your chart contains more points than values specifed in the CustomStep assignment. For example, if you set the CustomStep to (5,10,20,30) the axis step would look like:
0,5,15,35,65,70,80,100,130,135,...
setStep(double),
setMinorStep(double),
ChartCore.getAxisX(),
ChartCore.getAxisY(),
Chartpublic void setFirstLabel(int value)
Gets or sets a value used to customize the first label displayed on a selected axis.
The setting must be an integer specifying where you want labels to begin. The axis will then follow the setStep(double) associated with it to display subsequent labels.
When you set a value for this property, the AutoFirstLabel value of the Axis.Style is overwritten to the value you specify.
When using this property in the X Axis of a chart with values ranging from 0 to 1, the axis' setMinorStep(double) is used to calculate which label is the first, second, third, etc. When X Axis values range >1, then the axis' setStep(double) is used for this calculation.
ChartCore.getAxis(int),
ChartCore.getAxisX(),
ChartCore.getAxisY(),
getLabel(int),
getKeyLabel(int),
setStep(double),
setMinorStep(double),
Chartpublic void setFont(java.awt.Font value)
Allows you to change the label Font attributes of the selected axis.
The Font property is used to change the font settings for the labels in the selected axis, if you're trying to change the font settings for the axis title, please refer to the Title.setFont(java.awt.Font) member of the Title object.
When setting a font in Chart FX, you should create a new font object with the desired attributes. Then assign that object to the desired chart element.
For more information regarding the Font type, please refer to the Java API Documentation.
ChartCore.getAxis(int),
ChartCore.getAxisX(),
ChartCore.getAxisY(),
Title.setFont(java.awt.Font),
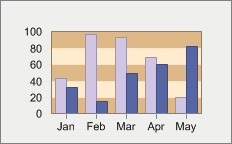
Titlepublic void setInterlaced(boolean value)
Creates a grid of alternating colors for a selected axis to improve chart readability.
When set to True, a grid with alternating colors is created for the selected axis. This visual attribute helps end users distinguish the different value ranges in the chart and easily recognize the value for a particular point.
Use the AxisSectionBase.setAlternateColor(java.awt.Color) and ChartCore.setInsideColor(java.awt.Color) members to set the Interlaced colors.
If you use this property for both the X and Y axes, the results show overlapping interlaced grids.
Here is an example of an Interlaced grid on the Y axis:
ChartCore.getAxisX(),
ChartCore.getAxisY(),
AxisSectionBase.getGrid(),
DataEditor.setInterlaced(int),
ChartCore.getAxis(int),
Chart,
DataEditorpublic void setInverted(boolean value)
Gets or sets a value specifying if a selected numerical axis max value is lesser than the min value.
For an axis to be inverted using this property, the setting must be applied before Chart FX calculates the scale for the axis. For example before the CloseData or RecalcScale method calls.
This property should be applied to a numerical axis. Assignment to categorical axes will not have an effect.
This property can only be applied to the X Axis in an XY plot chart. In an XY plot, the X Axis is a numerical axis rather than categorical.
When a selected axis is inverted, the alignment of the categorical axis of the chart will be reversed to make the chart more readable.
AxisBase.setMax(double),
AxisBase.setMin(double),
ChartCore.getAxisY(),
ChartCore.getAxisX(),
ChartCore.recalcScale(),
ChartCore.closeData(int),
Chart
public void setKeyLabel(int i,
                        java.lang.String value)
getKeyLabel() instead.
LabelList
public void setLabel(int i,
                     java.lang.String value)
getLabel() instead.
LabelListpublic void setLabelAngle(short value)
Sets the text rotation for the labels in the selected axis.
This property accepts an integer (representing degrees) ranging from [-90,90], specifying the rotation angle desired. Set this property to 90 to show labels vertically.
In order to set this property you must make sure the font type associated with the axis is a True Type Font.
Use a positive number to rotate the labels from lower left to upper right. Use negative degrees to rotate text from upper left to lower right.
If you would like to change the angle of PointLabels, you can use the ChartCore.setPointLabelAngle(short) member of the Chart object.
ChartCore.getAxisX(),
ChartCore.getAxisY(),
getLabel(int),
setStyle(int),
ChartCore.setPointLabelAngle(short),
ChartCore.getAxis(int),
Chartpublic void setLabelValue(double value)
Allows you to set associate text labels to major tick marks in a numerical axis.
This property can get or set the LabelValue assigned to any of the axes.
Normally, labels in a numerical axis are automatically controlled and displayed according to the AxisBase.setMin(double), AxisBase.setMax(double) and setStep(double) members. In some cases, you'll need to associate text labels with a numerical axis (using the getLabel(int) property), but when any of the scale values (Min, Max, Step, etc) change, these labels will no longer serve their purpose as the tick marks will be recalculated according to scale settings.
For example, if you have a chart where the Y axis ranges from Min=0 to Max=100 and Step=25, you'll have 4 tick marks on 25,50,75 and 100. By default Chart FX will display numbers (as labels) associated with each tick mark.
Now let's say you want to associate text labels (instead of the number) with each tick mark in the Y axis and you use the Label Property to set the following text labels: "Twenty-Five", "Fifty", "Seventy-Five", "One Hundred".
When you do this, everything will work out fine and the 4 tick marks will be labeled accordingly. However, if during the execution of your program or through user interaction, the Step suddenly changes from 25 to 12.5, you'll have 8 tick marks instead of 4 and because you used the Label property with indexes 0,1,2 and 3, the "Fifty" tickmark will no longer correspond to the 50 value.
If you would have set the LabelValue Property to 25, when the Step changes from 25 to 12.5 Chart FX will label every other tick mark and the labels will correspond to their initial setting.
Label visual attributes like rotation, color and font are also accessible through the setLabelAngle(short), AxisSectionBase.setTextColor(java.awt.Color), and setFont(java.awt.Font) members, respectively.
ChartCore.getAxis(int),
ChartCore.getAxisX(),
ChartCore.getAxisY(),
setStep(double),
getLabel(int),
setLabelAngle(short),
AxisSectionBase.setTextColor(java.awt.Color),
setFont(java.awt.Font),
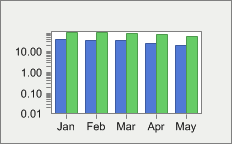
Chartpublic void setLogBase(double value)
Used to set a logarithmic scale for a numerical axis and recalculate the values as powers equal to the setting of this property.
The LogBase property can be applied only to a numerical axis, a categorical axis will ignore this setting.
The LogBase property is a member of the axis object, therefore the axis object must be referenced in order to properly access the LogBase property.
No zeros or negative data values are permitted in logarithmic charts.
The setStep(double) and setMinorStep(double) configurations must be equal or greater than the LogBase property setting.
Resetting the data contained in a chart will not automatically recalculate axis values, unless the ChartCore.recalcScale() method is called.
The LogBase has been set to 10 in the following bar chart:
ChartCore.getAxisX(),
ChartCore.getAxisY(),
ChartCore.getAxis(int),
AxisBase.setMin(double),
AxisBase.setMax(double),
setStep(double),
setMinorStep(double),
ChartCore.recalcScale(),
Chartpublic void setMinorStep(double value)
Specifies the increment you want between minor tick marks and minor gridlines (if they are displayed) on the selected axis.
This property is used to control the interval of minor tick marks and gridlines in the selected axis. For example, if the selected axis ranges from 0-100 and you have specified a setStep(double) value of 10, labels and gridlines will appear at 10, 20, 30, etc. If you would like to have 5 minor tick marks in each major interval, set the MinorStep to 2. Please note the values for the Step and MinorStep properties are data related.
Labels will not appear at minor tick marks.
The value of the MinorStep property must be lesser than the value of the setStep(double) member.
When using the setFirstLabel(int) member in the X Axis of a chart with values ranging from 0 to 1, the axis' MinorStep is used to calculate which label is the first, second, third, etc. When X Axis values range >1, then the axis' setStep(double) is used for this calculation.
ChartCore.getAxisX(),
ChartCore.getAxisY(),
ChartCore.getAxis(int),
AxisSectionBase.getMinorGrid(),
setAutoScale(boolean),
AxisSectionBase.setMinorTickMark(int),
setStep(double),
setFirstLabel(int),
ChartCore.recalcScale(),
Chartpublic void setNotify(boolean value)
Used to enable or disable the GetAxisLabel event so you can customize labels on the specified axis.
This property can also be controlled by the setStyle(int) member and the Notify flag.
Chart FX for Java only supports the GetAxisLabel event when generating charts as .NET client controls and using client side chart events.
ChartCore.getAxisX(),
ChartCore.getAxisY(),
ChartCore.getAxis(int),
setStyle(int),
Chartpublic void setPane(int value)
Gets or sets an integer value specifying the Pane for an Axis object.
Additional axes may be assigned to panes in a chart. Once an axis object is assigned to a pane, that pane will be visible in the chart area. Data also associated with the selected axis will also be applied to the configured pane.
Use the ChartCore.getPanes() member to customize that attributes for a selected pane. This property exposes all the supported members of the Pane class.
ChartCore.getPanes(),
Chart,
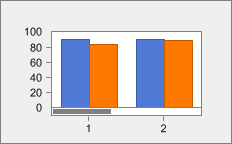
Panepublic void setPixPerUnit(double value)
Gives you the ability to control how many pixels per unit are in a selected axis.
This property is very useful if you want a scroll bar in the selected axis.
If the ChartCore.setScrollable(boolean) member is set to False, the PixPerUnit will not have any effect on the axis. So make sure the Scrollable property is set to True when using the PixPerUnit property.
In the following chart, the X axis PixPerUnit has been set to 60:
ChartCore.setScrollable(boolean)ChartCore.setScrollable(boolean)ChartCore.setScrollable(boolean)ChartCore.setScrollable(boolean)
ChartCore.getAxisX(),
ChartCore.getAxisY(),
setStep(double),
ChartCore.setScrollable(boolean),
setScrollView(double, double),
Chartpublic void setScaleUnit(double value)
Gets or sets the scale unit of a selected axis.
This property is useful when values passed to chart are large (i.e. 10,000,000). By configuring a reasonable scale unit, charts become easier to read and analyze.
The ScaleUnit property is a member of the axis object, therefore the axis object must be referenced in order to set the property correctly.
ChartCore.getAxisX(),
ChartCore.getAxisY(),
ChartCore.getAxis(int),
AxisBase.setMax(double),
AxisBase.setMin(double),
ChartCore.recalcScale(),
Chartpublic void setScrollPosition(int value)
Gets or sets the starting scroll position when a chart is scrollable.
Whenever applying any scroll attributes to a chart, the chart should be configured as scrollable using the ChartCore.setScrollable(boolean) member.
When setting the ScrollPosition, the specified point will be the first point point included in the chart.
The getScrollSize() member is used to read the total number of scrolls in the chart based on the current scroll range.
You can set the scroll range using the setScrollView(double, double) method.
getScrollSize(),
setScrollView(double, double),
Chart
public void setScrollView(double min,
                          double max)
Calculates the appropriate PixPerUnit and related scale values to create a scroll bar to view a portion of the selected axis.
Sometimes is difficult to calculate the appropriate PixPerUnit value to create a view of a specific axis. This method allows you to set a min (starting point) and a max (ending point) that Chart FX will use to calculate the PixPerUnit and display the view.
When applied to a categorical axis (e.g. X Axis) the Min and Max are integer numbers that range from 1 to the number of points you have in the axis. If you want to create a view (scroll bar) with 10 points per view and start at point 20, the settings for the Min should be 20 and the Max setting is 30
When applied to a numerical axis (e.g. Y Axis), you should set the Min and Max according to the scale values of the axis. For example, if your axis ranges between 0 and 1 you may set a view with a Min=0.3 and Max=0.6
To destroy the view you can set the Min and Max to 0.
The GetScrollViewMin and GetScrollViewMax members may be used to obtain the current scroll view (min and max) for a selected axis.
min - Where the view (scroll bar) begins.max - Where the view (scroll bar) ends.ChartCore.getAxisX(),
ChartCore.getAxisY(),
ChartCore.getAxis(int),
setPixPerUnit(double),
Chartpublic void setSeparation(int value)
Gets or sets a gap value (in pixels) between multiple axis.
This property is useful when multiple axes are configured and you need to create space for readability.
ChartCore.getAxis(int),
ChartCore.getAxisX(),
ChartCore.getAxisY(),
Chartpublic void setStaggered(boolean value)
Alternates the level of the axis labels for the selected axis labels.
Staggering axis labels can help improve chart readability when axis label strings are long.
You can also set staggered axis labels by using the setStyle(int) member with the SHOW_2LEVELS flag.
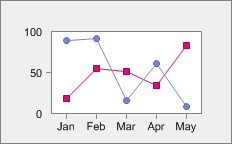
setStyle(int)public void setStep(double value)
Specifies the interval of major tick marks and gridlines on the selected axis.
It also controls the gap or interval between labels in the selected axis.
Normally, you use this property to control the interval of labels, tick marks and gridlines in the selected axis. For example, if the selected axis ranges from 0 -100 and you want to show labels, tick marks or gridlines every 10 units the appropriate setting for the Step property is 10.
This property can also be used for a categorical axis. For example, if your X axis displays labels ranging from January to December and you set the Step property to 2, then the categorical axis will display legends every other month.
You can also control a minor interval with the setMinorStep(double) member.
If no Step value is specified, Chart FX will automatically set a Step according to the data provided, you can use this property to read or write this default value.
Changing the data contained in a chart will not automatically change the Step value. If you want Chart FX to calculate an appropriate Step value automatically set the Step value to 0 (Automatic) or invoke the ChartCore.recalcScale() method.
The value of the Step property must be greater than the value of the setMinorStep(double) member.
In the example below, the Step for the Y axis has been set to 50. Notice the tick marks on the Y axis increase by 50:
When using the setFirstLabel(int) member in the X Axis of a chart with values ranging from 0 to 1, the axis' setMinorStep(double) is used to calculate which label is the first, second, third, etc. When X Axis values range >1, then the axis' Step is used for this calculation.
ChartCore.getAxisX(),
ChartCore.getAxisY(),
ChartCore.getAxis(int),
AxisSectionBase.getGrid(),
setAutoScale(boolean),
AxisSectionBase.setTickMark(int),
setMinorStep(double),
setFirstLabel(int),
ChartCore.recalcScale(),
Chartpublic void setStyle(int value)
Allows you to add additional styles to the selected axis.
AxisStyle : Define valid Styles for the axis| Value | Description |
|---|---|
AxisStyle.HIDE_TEXT | Hides labels for the selected axis. |
AxisStyle.NOTIFY | Setting this flag will make the chart generate a GetAxisLabel Event every time it needs to draw a legend in the selected axis. |
AxisStyle.SHOW_2_LEVELS | Displays staggered labels. |
AxisStyle.SINGLE_LINE | Do not word-wrap labels. |
AxisStyle.BREAK_ZERO | This constant will cause a chart to set the starting point at zero. For example, if you have a bar chart with a minimum value of -50 and turn on this flag the starting point will be zero and you will have bars that go up or down, depending on their value. |
AxisStyle.HIDE | Hides entire axis, including labels and tick marks. |
AxisStyle.NOT_CLIPPED | Do not clip the X legends (It is the programmers responsibility to assure that labels don't overlap each other). Setting this flag ON will avoid the RED tags to show when a label is too big, you can also use this flag when you don't want to set labels for every point (i.e. set a label every 20th point). |
AxisStyle.INTERLACED | Displays Interlaced Grid on the selected axis. |
AxisStyle.CENTERED | Moves tick mark so that labels are centered between major tick marks. |
AxisStyle.ROTATE_TEXT | This setting applies to 3D charts only and it allows the text to be rotated when the chart is rotated. |
AxisStyle.LONG_TICK | Displays a long major tick mark that makes the axis label appear enclosed in a box. This setting is used in conjunction with the Centered flag. |
AxisStyle.AUTO_SCALE | Same as AutoScale Property. |
AxisStyle.FORCE_ZERO | Forces minimum to zero when adjusting the axis in a chart where all values are positive. |
AxisStyle.DEFAULT | The default value is: SingleLine OR BreakZero OR LongTick OR AutoScale OR ForceZero |
AxisStyle.SHOW_ENDS | Forces ChartFX to display the minimum and maximum value independently from the step set to the chart. For example, if step is 10 and maximum is 95 when this setting is used, the axis will show ...60,70,80,90 and 95. |
AxisStyle.NO_ROUND_STEP | Do not round the interval of tick marks and gridlines on the selected axis. The values shown on the axis will exactly the same data passed to the chart. |
AxisStyle.IGNORE_LABELS | Ignores any axis label assignments and displays labels as default. |
AxisStyle.GRID_FRONT | Paints the axis gridlines on top of the series point markers. |
AxisStyle.INVERTED | Sets the Max value for the selected axis lesser than the Min value. |
AxisStyle.DETECT_AREA | Instructs Chart FX to include the area around the axis labels when accessing the axis context menu. By default the menu is only accessible by right-clicking over an axis label. |
AxisStyle.SHOW_INTERMEDIATE_LOG_LABELS | Used to display incremental values for charts with logarithmic scale. |
AxisStyle.AUTO_MINOR_STEP | Instructs Chart FX to calculate the MinorStep automatically. |
AxisStyle.AUTO_FIRST_LABEL | Automatically positions the first label to the closest number rounded to the axis step. |
AxisStyle.AUTO_CENTER | Instructs Chart FX to center the labels automatically. |
AxisStyle.FIX_RIGHT_ALIGNED | Right justifies label text. |
This property is a mask property. This means all settings represent a bit in the word that you need to turn on or off according to what you want. For this purpose you will need to use the bitwise operators (And, Or, Not, Xor) provided by your development tool.
Because it is a mask property, you must make sure you use these operators to turn on/off bits and avoid losing previous settings to the property.
For example, if you want to turn ON the Interlaced setting the right way of setting this property is:
chart1.getAxisX().setStyle(chart1.getAxisX().getStyle() | AxisStyle.INTERLACED);
If you type the following code:
chart1.getAxisX().setStyle(AxisStyle.INTERLACED); (WRONG!)
You will erase all other settings in the property causing an erratic behavior of the library and an incorrect setting of the individual properties which also control these flags.
The Axis.Style property supports a flag called AutoFirstLabel (Default=ON) which automatically positions the first label to the closest number rounded to the axis step. For example, if a numeric axis starts at 7 with a Step of 10 and the AutoFirstLabel property is ON, the axis will show labels at 10,20,30 and so on. If the AutoFirstLabel property is turned off labels will be shown at 7,17,27 and so on.
Note: If the axis contains dates (Date Axis) the AutoFirstLabel property will position the first label at the end of the month. If the AutoFirstLabel is turned OFF, the labels will be shown using the first avaialble date and advanced using the Step property setting.
ChartCore.getAxisX(),
ChartCore.getAxisY(),
ChartCore.getAxis(int),
AxisBase.setMax(double),
AxisBase.setMin(double),
getLabel(int),
ChartCore.recalcScale(),
Chart
public void zoom(double min,
                 double max)
Allows you to specify a min and max zoom value for a selected axis.
You may turn the zoom off using the zoomOff() method of the Axis Object.
If the ChartCore.setZoom(boolean) member of the Chart object is configured to False, all Axis specific zooms will be turned off.
min - Starting point of the zoom range.max - Ending point of the zoom range.ChartCore.getAxisX(),
ChartCore.getAxis(int),
ChartCore.getAxis(int),
ChartCore.setZoom(boolean),
zoomOff(),
Chartpublic void zoomOff()
Allows you to ignore any zoom attributes set using the Zoom method and return to the default axis view.
Use the zoom(double, double) method to set a zoom for a specified range on a selected axis.
If the ChartCore.setZoom(boolean) member of the Chart object is configured to False, all Axis specific zooms will be turned off.
ChartCore.getAxisX(),
ChartCore.getAxisY(),
ChartCore.setZoom(boolean),
zoom(double, double),
Chart
|
http://www.softwarefx.com | |||||||
| PREV CLASS NEXT CLASS | FRAMES NO FRAMES | |||||||
| SUMMARY: NESTED | FIELD | CONSTR | METHOD | DETAIL: FIELD | CONSTR | METHOD | |||||||